6 Month Premium Site Anniversary Offer

It has been an amazing 2015 for Robert and the Chart Freak site.  Since going live, we’ve had a consistent stream of really great winners too. And in celebration of our 6 month Premium Site launch anniversary, we’re offering our first and only promotion to date for those wanting to try out the Chart Freak service.

Until Monday night ONLY, we’re offering 20% off the purchase price of a Quarterly membership. A 3 month membership is normally $95, but if you use COUPON CODE: SAVE20 on the checkout page, the price will drop to just $76 for your first 3 months.

And by popular request, as of today, we now accept PayPal on the site.  This promotional offer is available to PayPal users too.

Robert has been posting around 100 charts per week covering a wide array of sectors.  Come join our community and see what hundreds of loyal members have been raving about.


   Your Promotional Offer – Click Here


Public Post – Energy on the Move

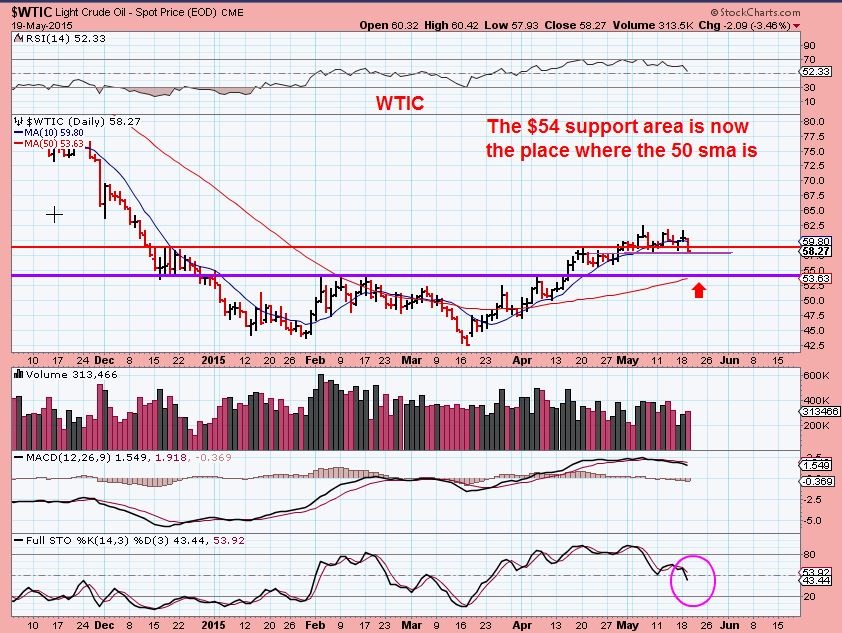
WTIC-  I have mentioned all along that a drop to test the break out could come.   The 50sma is in that area.  OIL has been strong, and  it did start to dip.  Click on the chart & look closely, It is at recent consolidation lows, but could drop further. $WTIC 5-19s Read More

Public Post – HOW HIGH!

For all of my public blog followers, here is a taste of what a normal, "daily update" premium report looks like! Enjoy and thanks for following the blog.


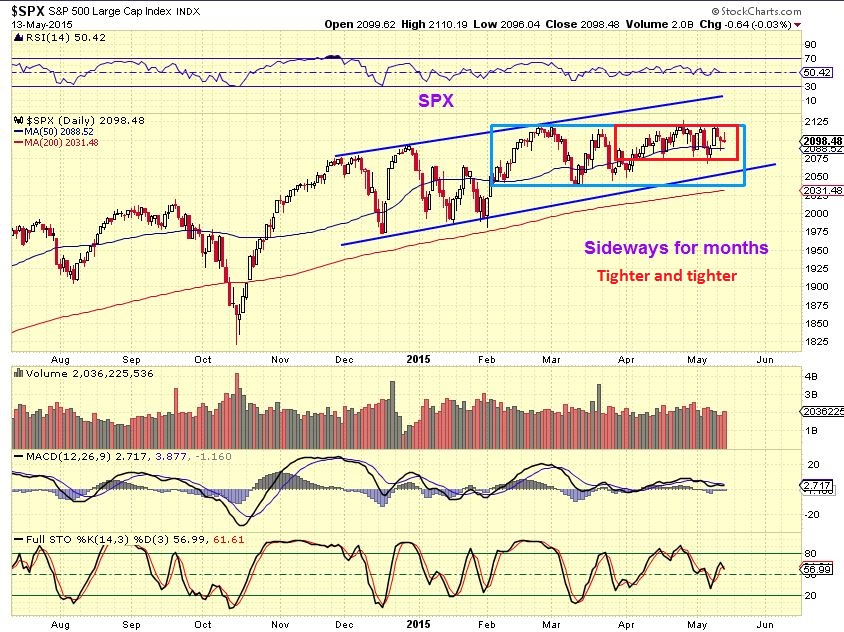
SPX - When this consolidation breaks, the move should last for a while

SPX 5-13  

The NASDAQ looks a little different...

Read More

PUBLIC POST …WHAT IS NEXT?

Many people read my public posts but have missed out on my private reports. 

  Is it possible that you are missing out on something that could add insight to your trading by adding my reports to your trading style? Could you possibly even make that money back  ( $37.95 / month) on your next trade?

To answer that, I am going to show you  what we at CHARTFREAK focused on over the past few months.  AMONG other set ups-

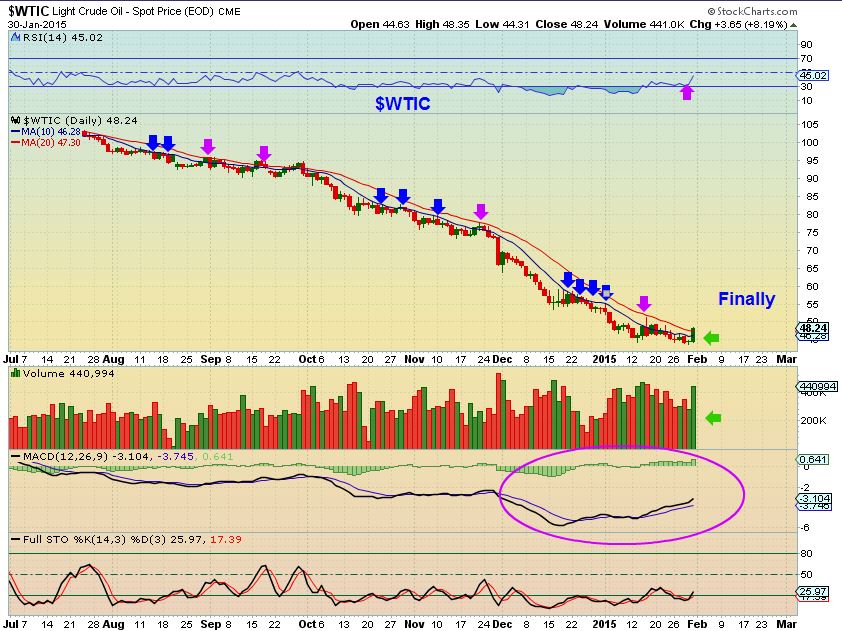
1.  Many were afraid during the oil sell off Aug through Jan.  I was reading everywhere in Jan that you should be SHORTING OIL to the low $30’s.   I am a contrarian during certain times and I found Many reasons to be one then.  This is what I was telling my readers in late JAN.  

  “BUY OIL / ENERGY STOCKS ABOVE the 20sma. It has NOT been there in a while.”   I was buying certain Energy stocks at the end of Jan while   Most others  shorted these lows.

$WTIC

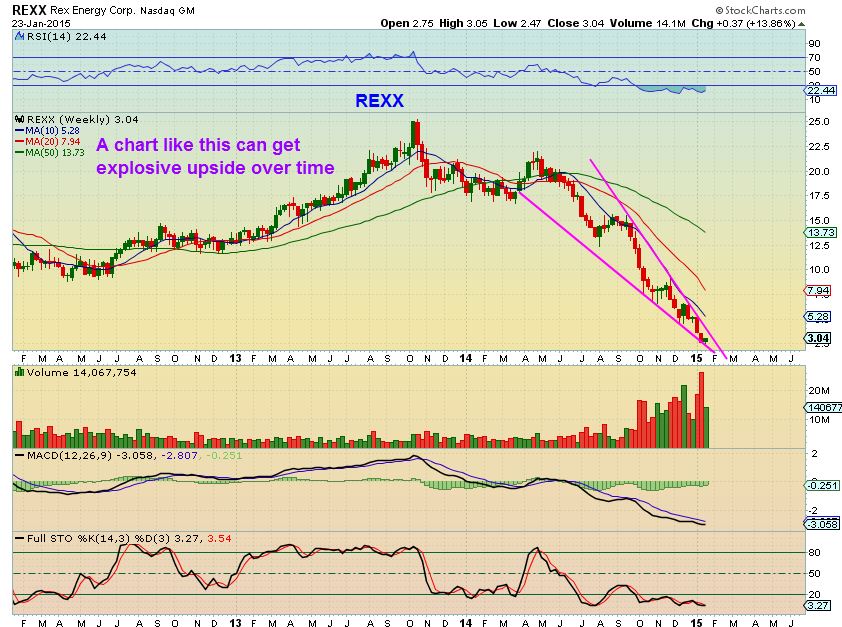
I recommended these energy stocks on  JAN 23 , knowing they were crushed to ridiculous levels and could explode higher.   Reasons were pointed out in my reports.  Many  have since moved up 50 -100 + % or more.  (Its not easy buying at lows, but my reports detailed the many reasons why)

REXX JAN 23 –  1 of 3 REXX charts I posted then.

REXX

REXX NOW-  that was the lows.

REXX


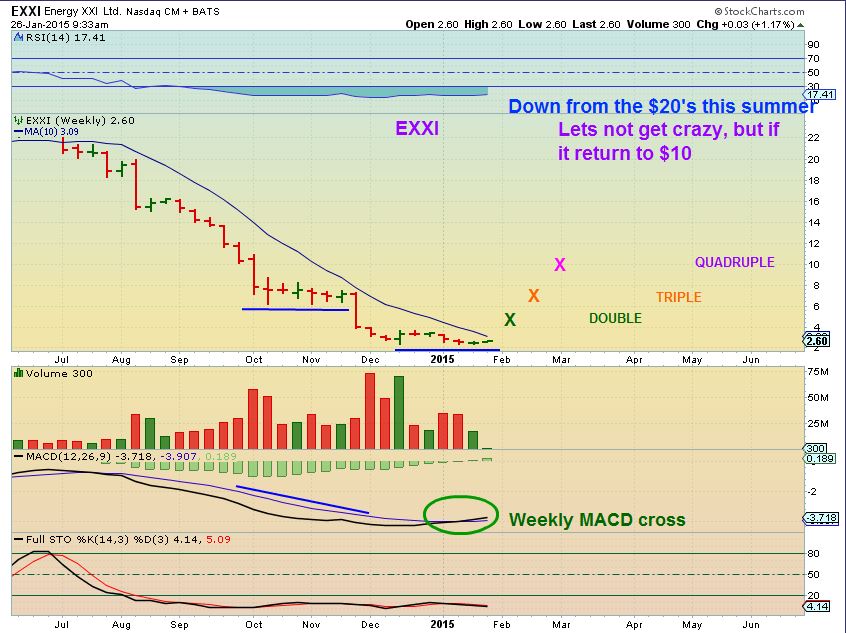
EXXI–   Jan 26,  at $2.60 .  Double bottom lows .   1 of 3 charts that I posted on EXXI –  I thought we were looking at a great opportunity if one could be brave and then be patient. 100%  300%  Gains over time?

EXXI DAILY DOUBLE


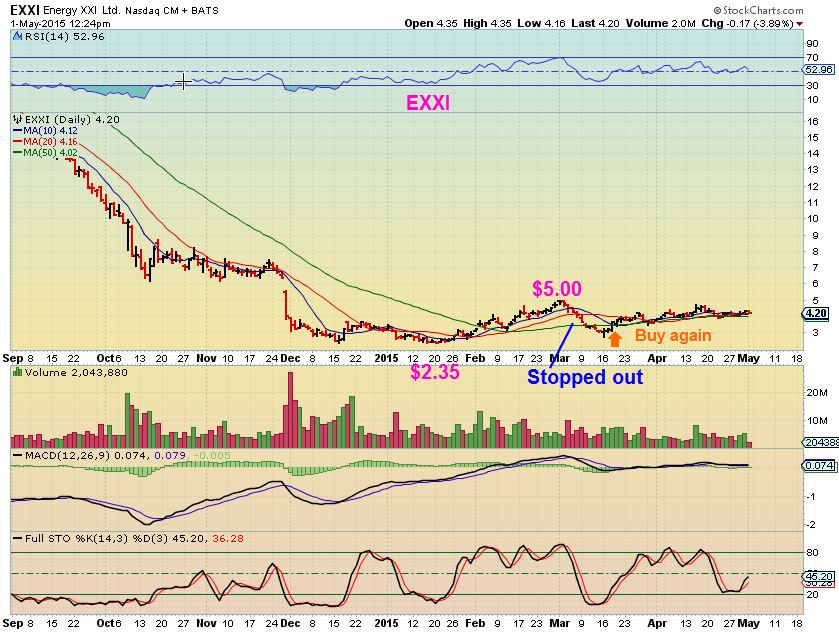
EXXI – ran to $5  ( 100%) and dropped in March.  This week was back well above $4, almost hitting $5 again so far , on April 15.   I think there is more upside for the patient investor.  I personally traded this one in & out  with stops.

EXXI 2

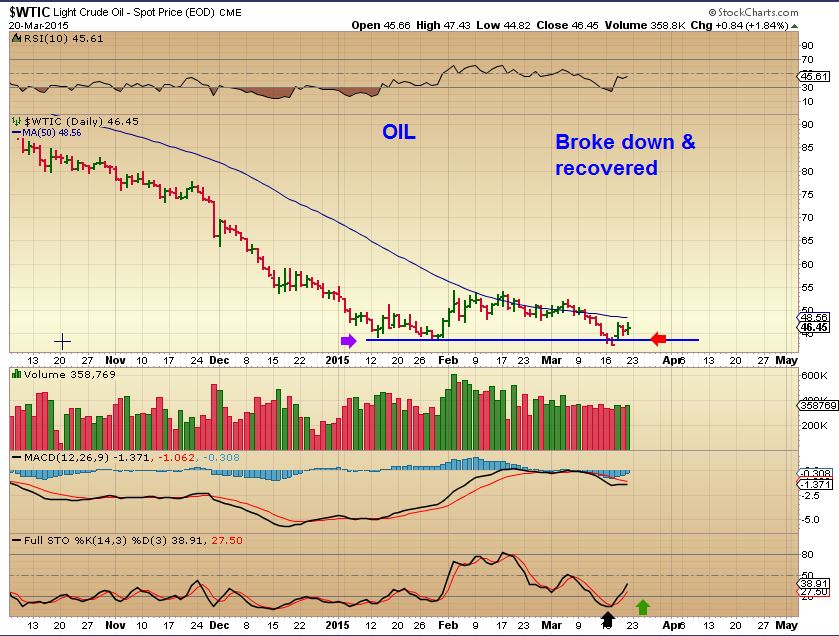
  Again, many called to go short OIL on the MARCH DIP.   There was fear of that break down to $30’s or $20’s everywhere.  I declared it a shake out in real time and  BUY!  I pointed out the many reasons why and what I was looking at .  This chart days later was to encourage readers that what we saw was indeed that shake out,   NOT a break down.

OIL 3-20


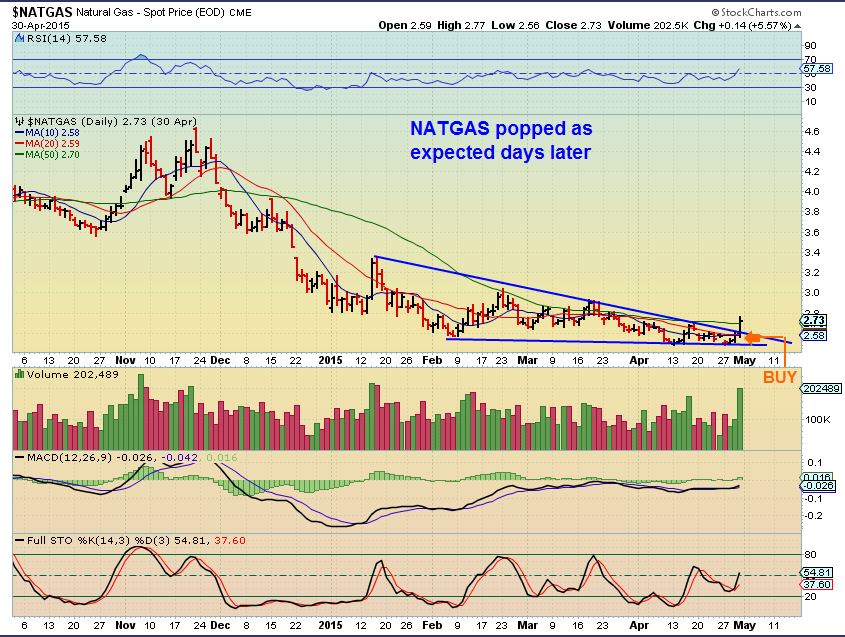
2.   Recently I was focused on NATGAS,  also looking for a Double bottom low  (Not a break down as I’ve been hearing .  Many are in fear of the surplus , etc,  but my charts called for a low).

I mentioned  CHK, XCO and a few other stocks to take advantage of this ahead of time.  As NATGAS broke down below recent lows, I was more bullish and I was looking for this break out too.

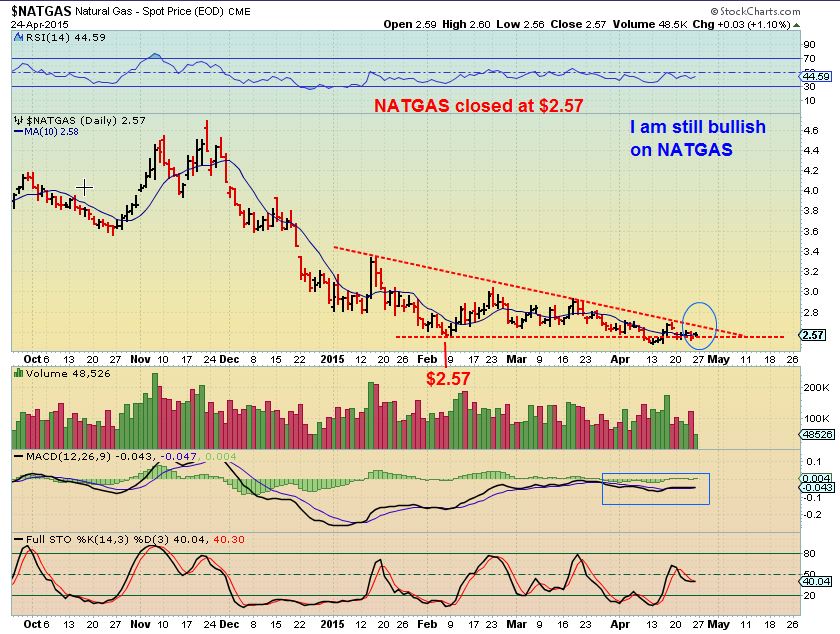
NATGAS Posted APRIL 27 –  double low in place.  Buy or wait for this break out to be safe/ conservative .

$NATGAS 4-24

NATGAS 4-30  (2 days later)   Some trader took UGAZ @ $1.80.  It is now $2.43 , up 35% in 2 days.  ( See also CHK)

NATGAS 4-30

We’ve  also looked at trades in the equity markets , Commodities like STEEL, Uranium  ( Honestly, I didnt want to chase & I missed most of that first move up in Uraniums and Rare Earth),  SOLARS, etc  VALE, CLF, FCX, were mentioned.  The markets have been quite volatile lately , so some work out and some havent in the equity markets.  The commodities, Energy , and Solars  have been a bit more reliable.

.

3.  What are we focused on at CHARTFREAK NOW?    The moves in the GOLD/SILVER / MINERS Sector have had my attention again since March.

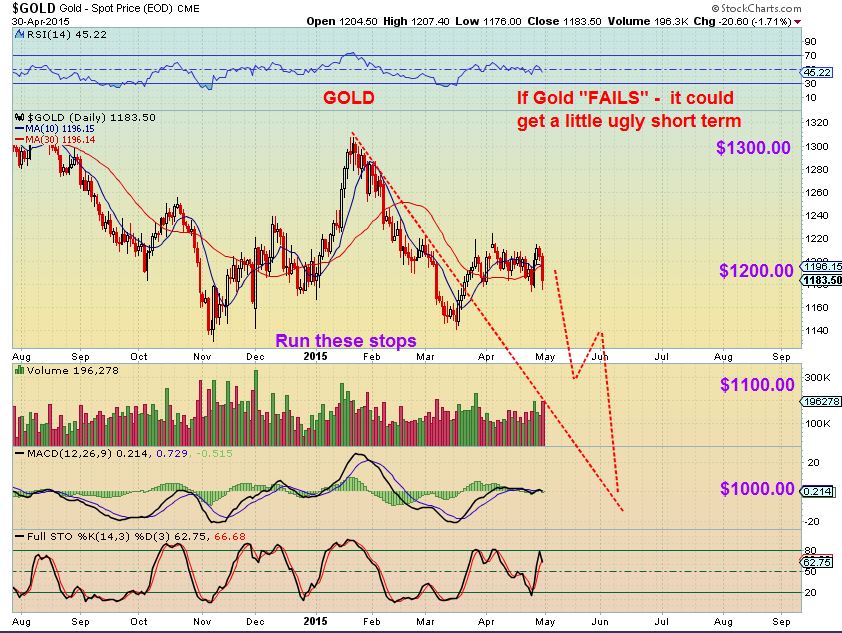
Today I hear many say ,  “GOLD is breaking April support, thus  it will break March lows soon.  The plunge in GOLD yesterday & Today is just the start, and todays follow through will plunge us down to $1000.”   Yes, that could happen,  it could look like this …

$GOLD 4-30 3


At this point I am looking at things differently again.  ANYTHING is possible, but what am I seeing?  I had reports this week discussing Precious Metals, and I posted an important update this morning too.  My weekend report will likely be very much devoted to trying to see through the hazy guess work and find a solid understanding  of where we are in this GOLD/SILVER sector.

 So for less than the cost of a cup of coffee per day at Starbux or Dunkin’s       you can read any past report, including my thinking in this mornings important Gold/SILVER/MINERS update. Your next trade may make that money back for you quickly.

  You can cancel anytime ( no refund for the 1st month)  if you aren’t satisfied.    I will elaborate on my thinking about the precious metals in this weekends report that comes out by Monday morning.  If you cannot join us at this time, please feel free to sign up for the email alerts to these public posts, which I send out from time to time.


Happy Trading and have a great weekend!

~ALEX

EDIT: I just finished my weekend report Sunday evening , it has  about 40 Charts . Mostly focused on GOLD/SILVER/MINERS.

Sitting Tight – Jesse Livermore

Men who can both be right and sit tight are uncommon.  I found it one of the hardest things to learn.  But it is only after a stock operator has firmly grasped this that he can make big money. -  JESSE LIVERMORE

Jesse was a legendary trader in his lifetime.   His experiences taught him that even though he was able to made good money trading, he also lost good amounts of money by over-trading.   After decades of trading & investing, he offered the above advice, showing that patience can be rare, but also patience can be more rewarding if you know you are correct about a certain set up and patiently wait for it to unfold.

 As a  trader,  I like to find & buy good set ups and sell them in a few days as they play out,  but I also have tried to find proper set ups and allow them to play out until they are longer term rewarding. Let me give you a couple of examples of how  "Sitting Tight when you know you're right" can pay off.

Read More

Market Observations

I wanted to take this time and just share a few charts that I have presented to my premium members in various premium reports last week.   Of course as time moves forward , charts can morph and change , so we keep our eyes on things as they unfold.    Currently, however, things are still playing out as expected. 

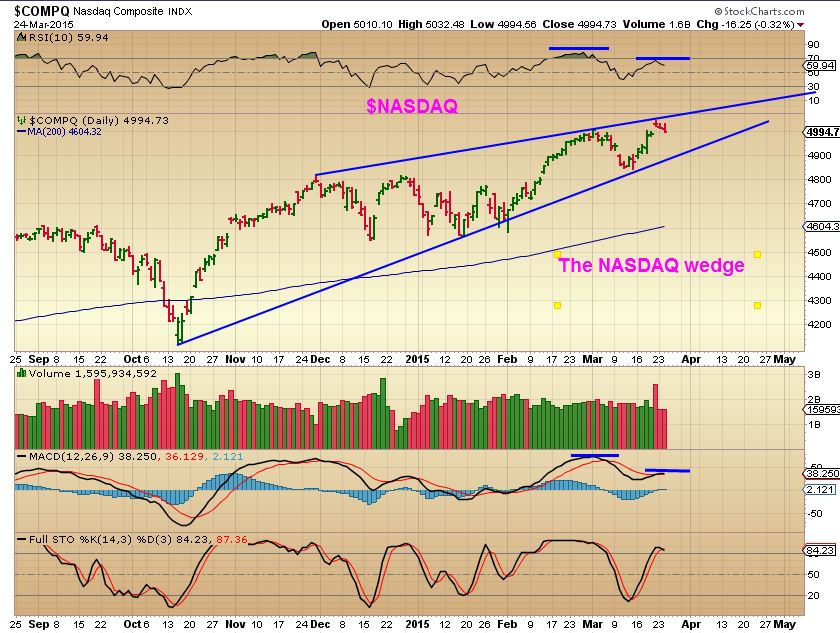
March 24  NASDAQ -  I was pointing out a wedge pattern.  They are bearish if they dont surge higher and break the pattern before reaching the apex.

NASDAQ 3-24

Click to read more of this report

Read More

Could Energy Still Be In A Bottoming Process?

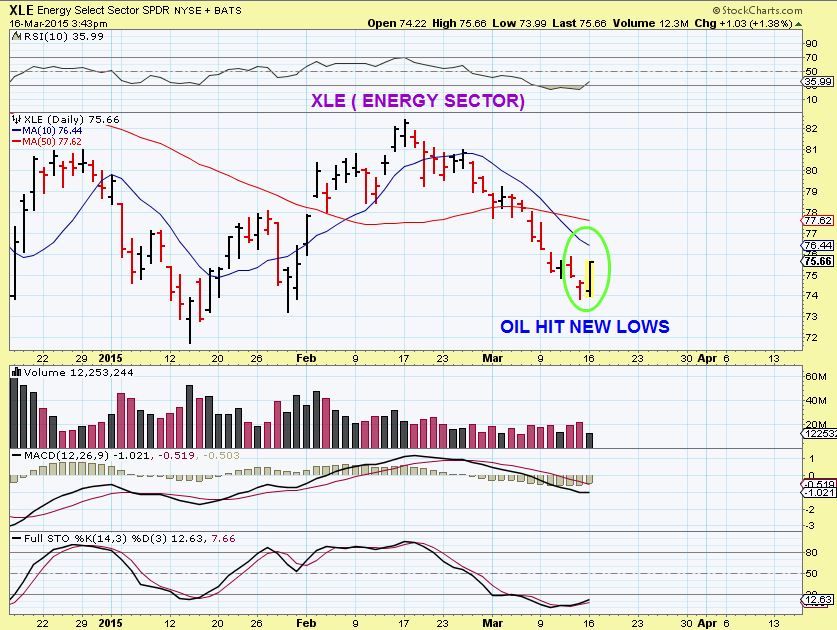
In this past weekends premium report & again on Monday March 16th,  I  posted developments that we had been watching In OIL/ENERGY /METALS.  I am going to share a small part of those reports here with you , and let you draw your own conclusions.

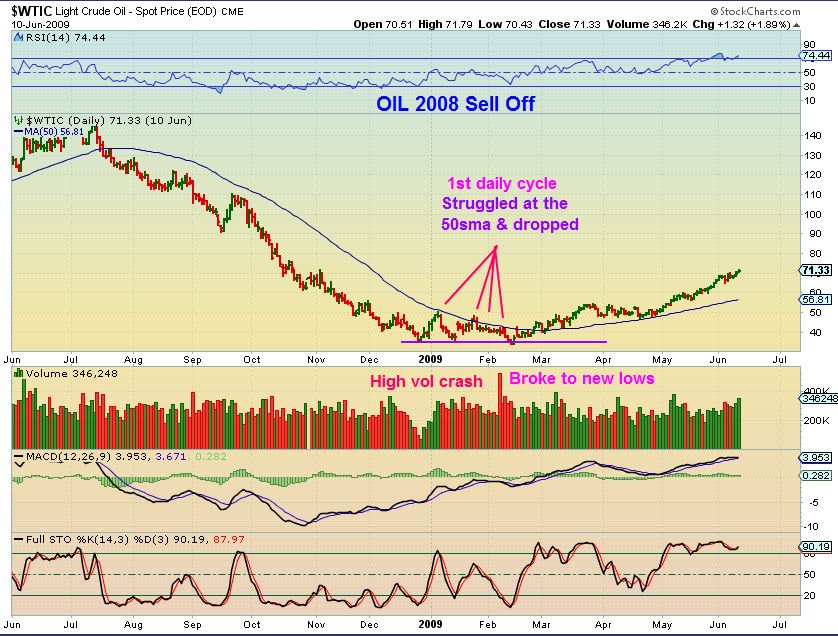
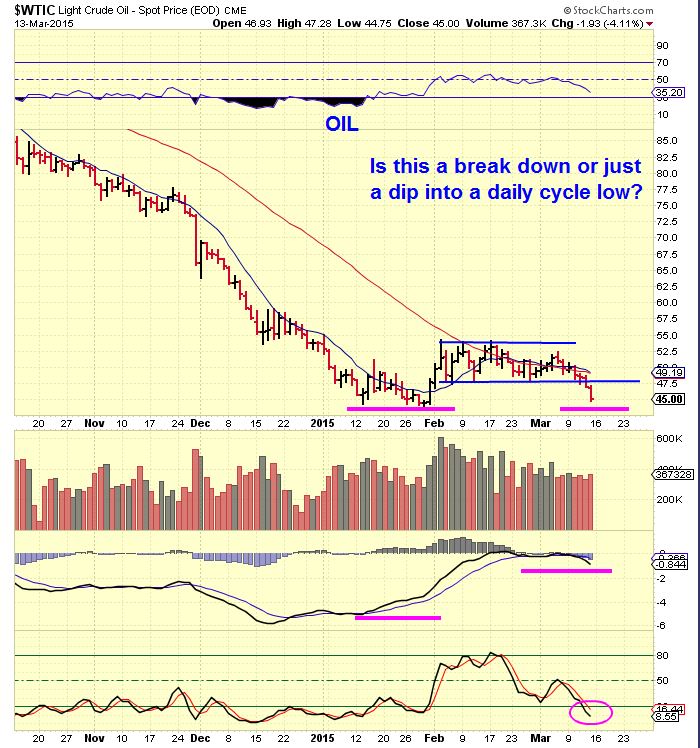
MANY went short OIL this week .  The Wall Street Journal , CNBC, and several other letter writers warned of  an imminent breaking down of OIL to the low $30’s.  So when People saw OIL break to new lows- they got very bearish & shorted it.  I like to check the charts and see if they can tell me something about what I am seeing.  I noticed that in 2008 when OIL was attempting to bottom, something similar happened, so I posted this chart for my readers.

$WTIC 2008  –  Notice how OIL struggle under the 50sma, then made a false break down to new lows. How many went short then?

OIL 2008 low

$WTIC  Friday March 13- Struggled under the 50sma and then it gave up. ( It now has  dropped to new lows this week). Many went short.

OIL 3-13


.

.

 Going one step further I asked myself, 

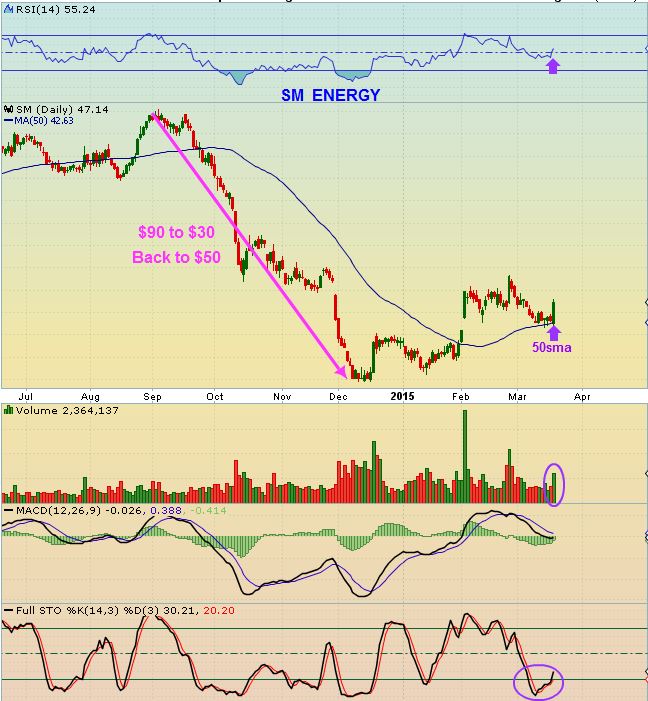
“Are ENERGY stocks breaking down to new lows too?  Do you see any reversals in ENERGY STOCKS?” 

 Check out  SM –  no new lows, it just ran from $30 to $50

SM

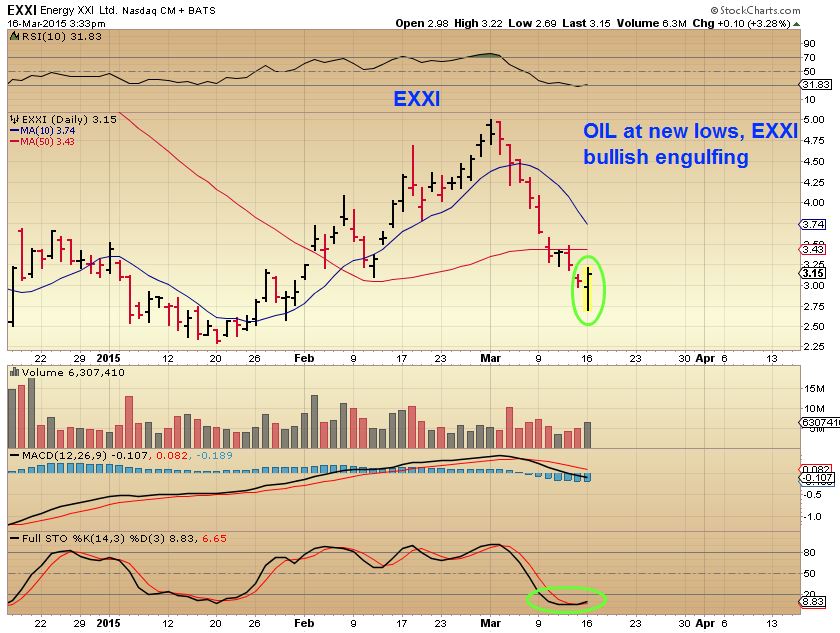
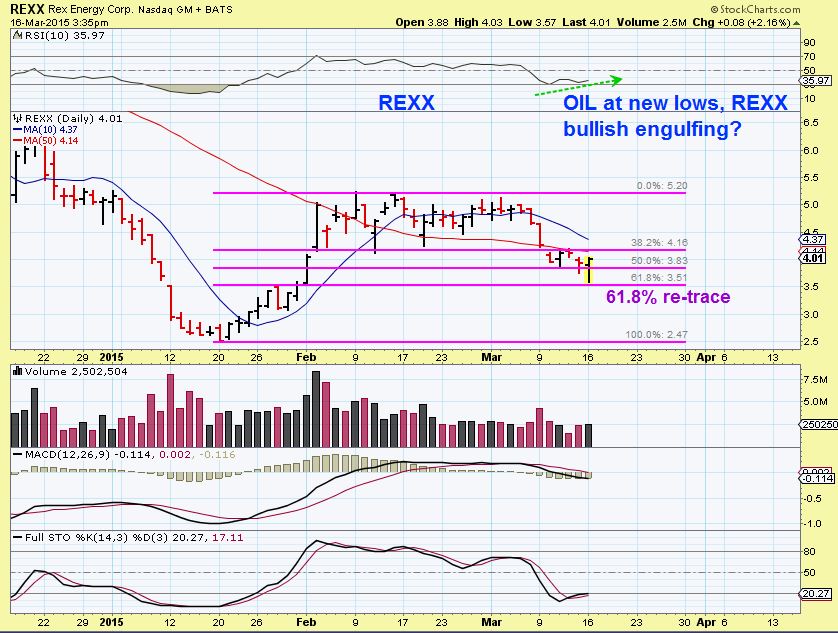
From Mondays Update: Look at REXX, EXXI,  ( And I pointed out others) I wrote…

  I may be early, but  I took a couple smaller positions in EXXI, REXX , because I can place a stop below todays lows and they are bullish engulfing with OIL at new lows.


EXXI

REXX


I concluded by also mentioning that with OIL at new lows, the XLE was looking rather bullish.

 Reversing while OIL is at lows is also the  XLE.

XLE

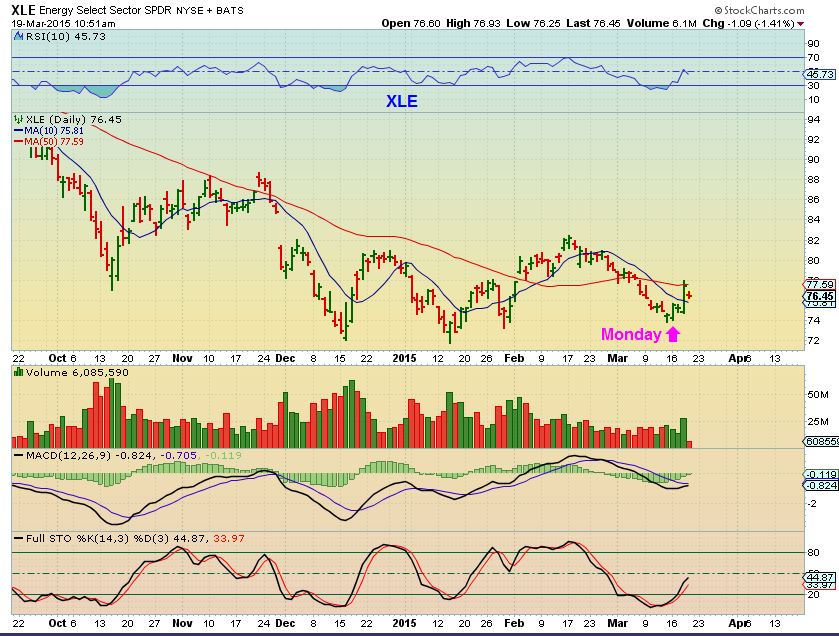
This is the XLE today as I write this  (March 19)

XLE MARCH 19

But wait. In that above XLE chart, I see ENERGY bouncing , and then dropping, bouncing and then dropping.  Is there any safe way to trade this?  Will this be a lasting type rally this time, or will it roll over again and again as it has in the past?   I will be covering that in this weekends premium report.


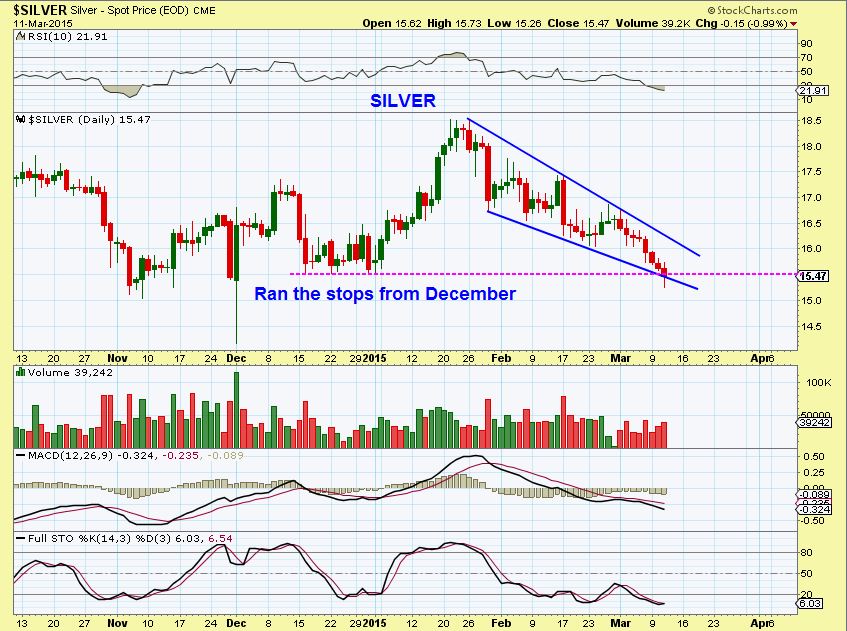
GOLD/SILVER and the MINERS were also due to bottom. It was a tough one to read. They also  Popped with the FED WED release.   I had posted this bullish set up March 11 in Silver ,  but again will it pop, run , and last? Or roll over?

$Silver – Ran the stops and this was the low.

$SILVER

I’m watching a variety of sectors and seeing what looks to be an  interesting development taking place right now.  Stay tuned for more information as these developments unfold.   Thank you for reading along, I hope this article gives you a few new ideas to think about,  and best wishes in all of your future trades!


~ALEX

I Love Bases

A Lesson On Long Strong Base:

I did a report in the  past about how much I love being able to trade a well formed base.  The report was highlighting LONG tight bases, they can be explosive. They stand out to me because in the past I have had such huge %-Gainers when stocks broke out of them.   Do they always work? No.   To be honest, I have entered some that also just bounced around and bored me to death, and some have even broken down due to bad earnings or an FDA rejection of their testing, etc .    The Idea is that you buy near the supporting lows, so if  it drops you get stopped out with small losses,.  If it breaks out higher, the upside has huge potential.


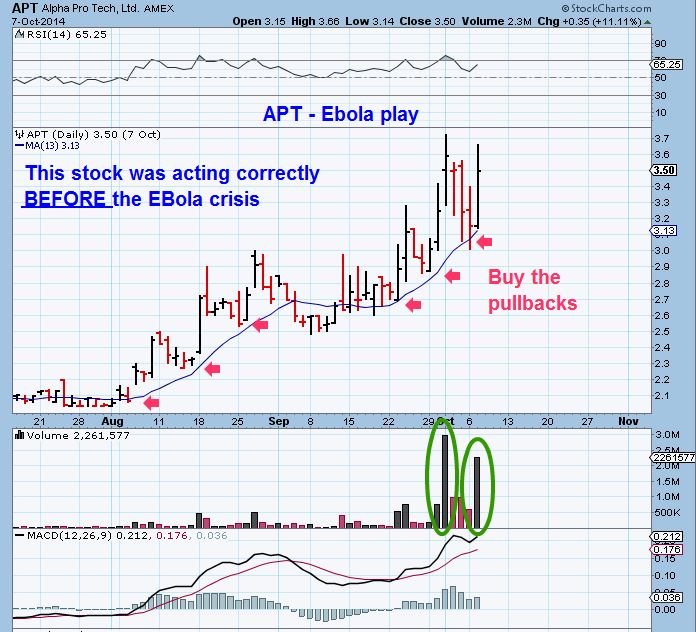
Let me show you some examples of trades that I worked on this site before it became a premium site.   With the Ebola scare, I noticed that many of the Ebola play stocks had formed good bases.  APT, LAKE were 2 that I bought at support in the bases.

APT 1 BUY  

APT was stair-stepping higher and the pullbacks were being accumulated.  Suddenly ...

Read More

What’s On The Radar?

If you've been reading my posts here for a while, then you know that we caught some large Moves in Miners Dec through Jan rising out of their bases.  When that move topped out, we switched to Energy from the end of Jan through Feb. While OIL sold off relentlessly, many of the energy stocks were forming sweet looking bases ( please see prior reports if you are new here.   ).  With both of those sectors,  I have also kept an eye on  the SPX, NASDAQ, NATGAS, etc.    So what has caught my attention lately?

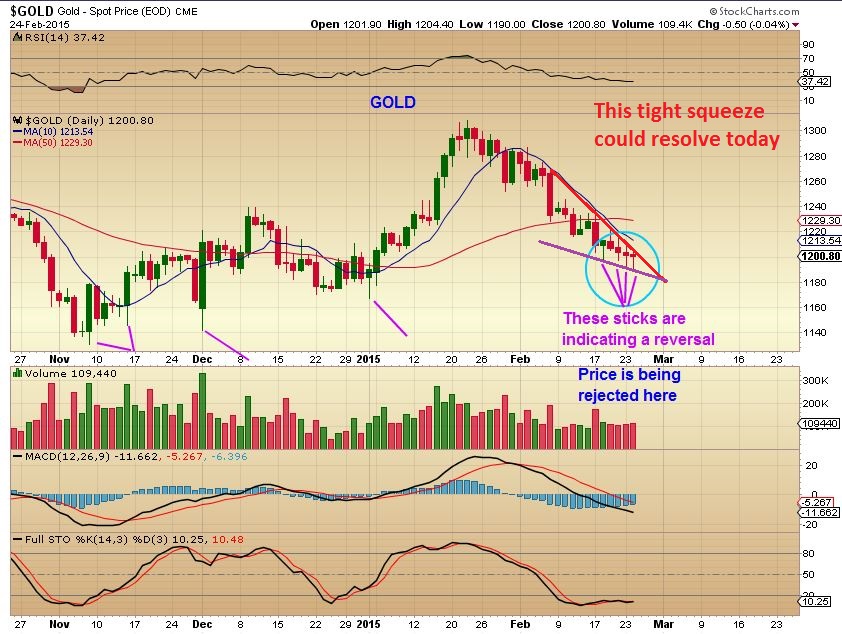
On Feb 24 -  I called a likely temporary bottom in Gold using the charts below.

GOLD is in a squeeze with spikes along the bottom. This is a bullish set up

GOLD FEB 24 2

This next chart showed that  GOLD was  on a supporting trend line...

  Read More

WHY ENERGY?

After any extreme sell off takes place and people finish  discussing all the reasons why there can be no recovery, it's often a good time to go shopping.  Why?  When it gets overdone, the bargains can be great %-Wise.  Recently while OIL  & NATGAS   sold off beyond expectations , I noticed that the equities stopped selling off and began building constructive bases. Temporary bottoms or permanent? Its too early to say for sure , but trade-able?  Most certainly.

 Here at Chartfreak, we have been buying & trading  them for weeks now.  I want to share some of the charts and ideas that we are again looking at , since I am expecting another leg higher.
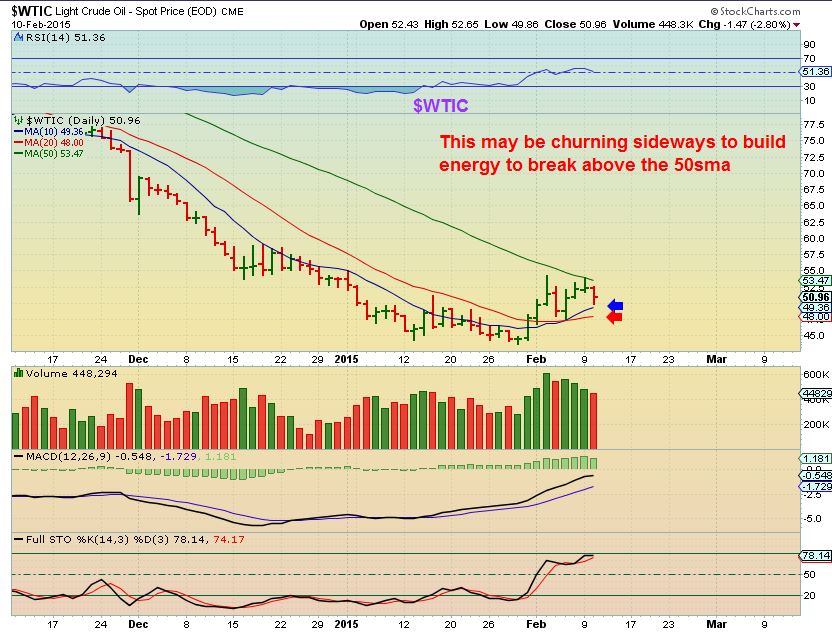
OIL Feb 10- Some said "Bear flag"  We had been trading energy stocks , and I  saw signs that OIL wanted to go higher.

$WTIC FEB 10

Feb 18 - consolidation/ base building. I posted this chart  , I wanted a drop to $49 actually...

  Read More