The Markets In Review
I wanted to open up my weekend report to the public. Enjoy!
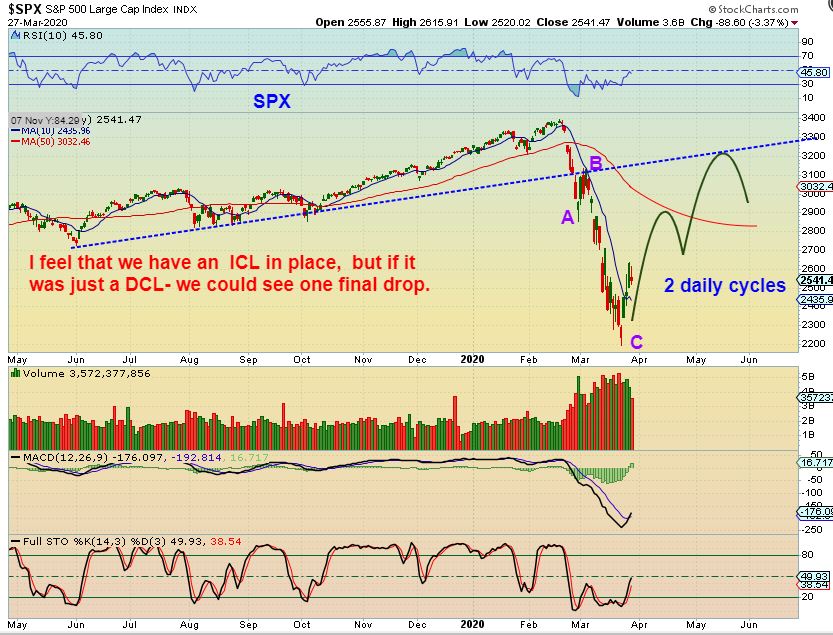
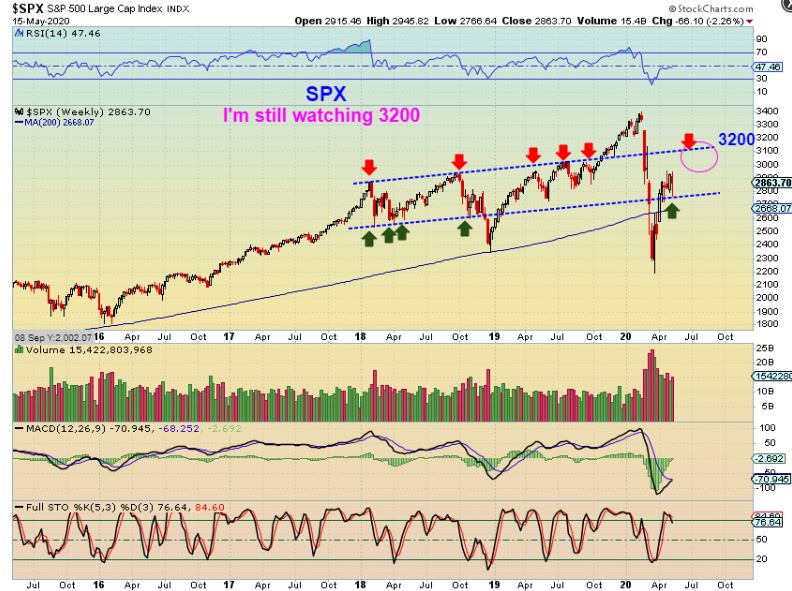
SPX MARCH REMINDER – I’ve been saying since March that I am expecting 2 strong daily cycles to possibly run to 3200, and then we need to be alert for the Bull to return, or a bear market to start. At that time I favored a bear market with this Covid Pandemic stifling the economy.
.
SPX – That first daily cycle was strong, believable, and yet fits my above chart exactly. It ran to about 2900+ and I think we just did a quick dip to the dcl, so now I will watch the next daily cycle unfold ( should be bullish also).
,
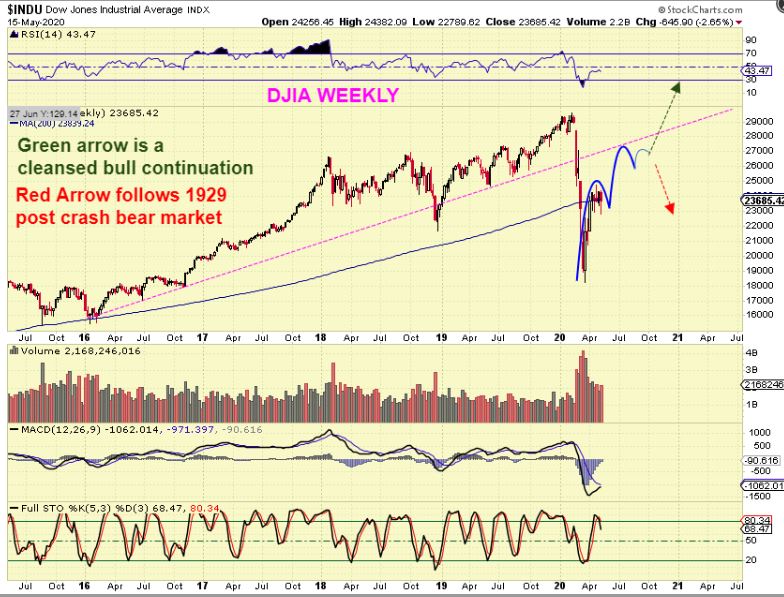
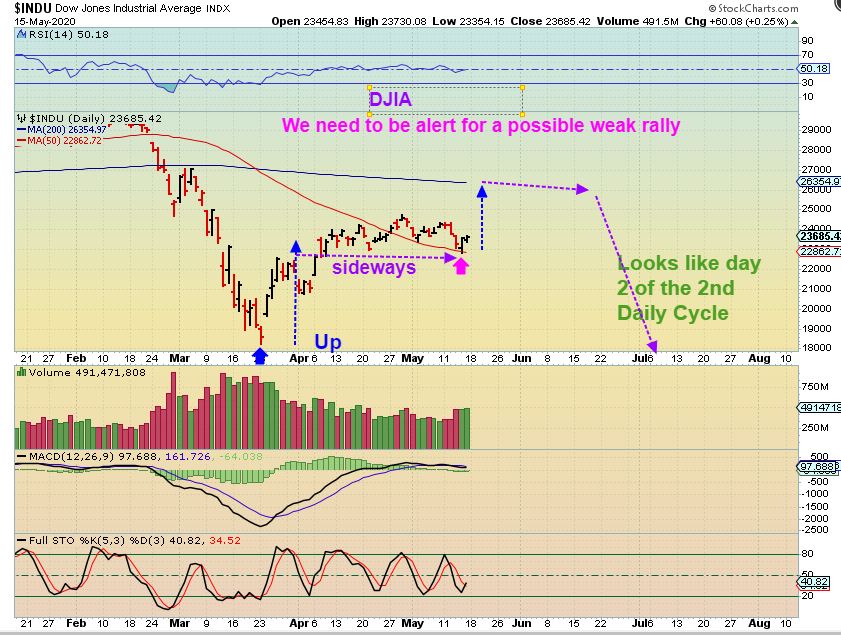
DJIA – I want to show you that the Industrials had a similar rally. Please read the chart now. The reason that I want to follow the DOW also, is because …
.
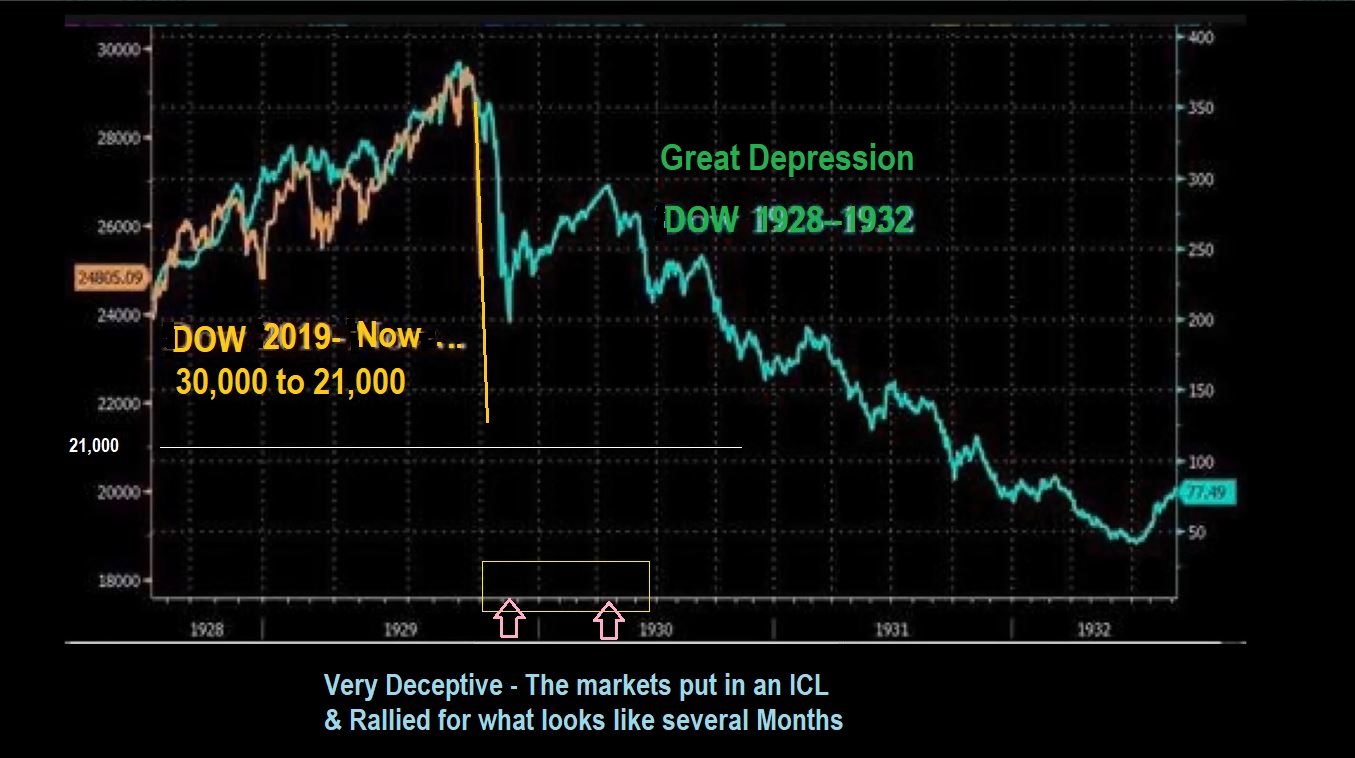
DJIA 1929 crash , bounce bear: This is the ‘template’ or model that I am looking at, since we had a very similar crash and then a ‘believable rally’ for months in 1929. That 5-6 month RALLY turned into a H&S and a bear market began. Now when I look at this…
.
SAME CHART: Now when I look at this, I would say that this was 3 daily cycles higher to form the H&S, so I’ll keep an open mind, but my thinking in March was ” SELL IN MAY AND GO AWAY”, an old wall street expression indicating weaker markets in the summer months.
.
DJIA – The first daily cycle for the DOW was up and choppy sideways, so I’m also going to see if we go ‘Up’ to the 200 sma, and then chop sideways again, or will this 2nd leg up be stronger? I could see this as a 1-2-3-4-5 wave up. I could see this also as an a-b-c and then drop, so again, I want to keep an open mind and just let this play out. So far, it is playing out exactly as expected, so it has been successfully traded.
,
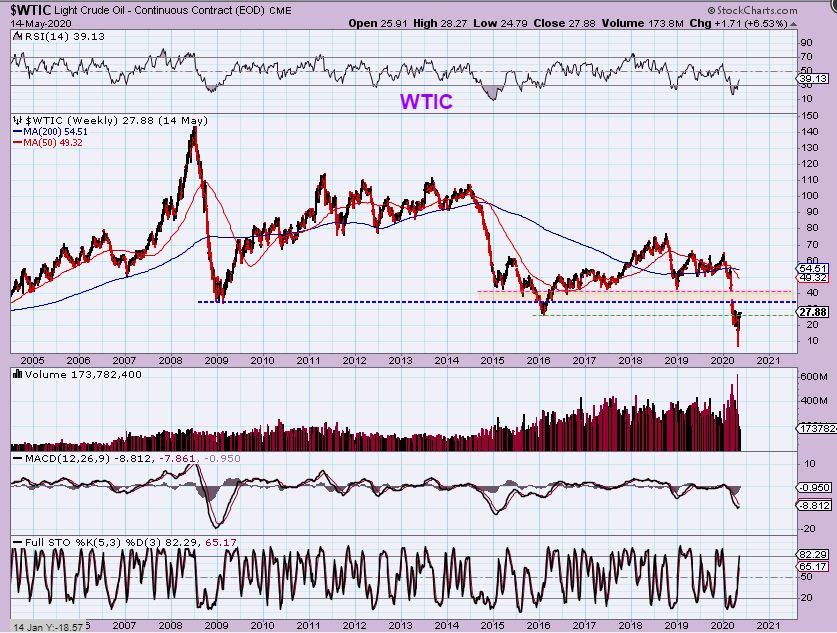
WTIC – Oil also continues to act as expected after bottoming. It could become a vicious ‘shake out & recovery’.
.
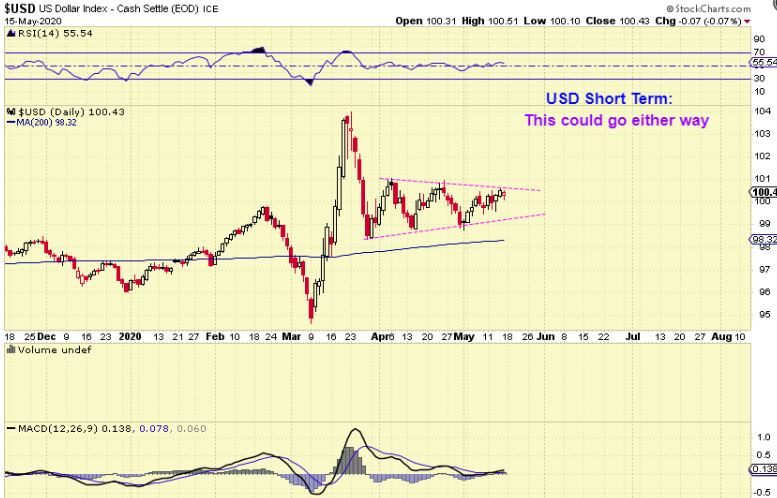
USD DAILY – I stopped covering the USD when it stopped affecting our trading. I don’t feel that the USD is really affecting GOLD right now, but it has chopped sideways after a strong rally when the Markets crashed. This could chop & drop from here as Gold continues higher though.
.
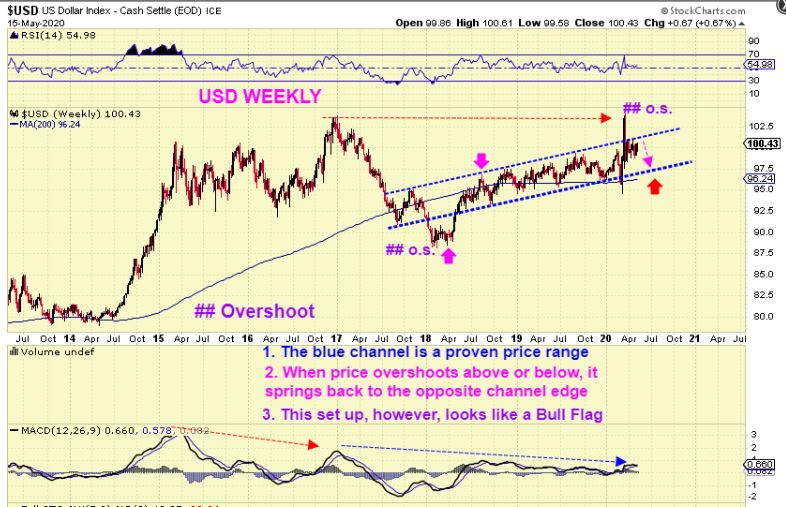
USD WEEKLY – The Weekly Chart shows a rising channel. Often when price overshoots in one direction or the other, it will snap back inside the channel and head for the opposite side. IF THAT HAPPENS HERE, that would be a USD Drop. That said, this chop does look a bit like a bull flag but either way, I’m not really concerned, just watching it play out for possible future monitoring.
.
HOW IS GOLD LOOKING THESE DAYS? A picture is worth 1000 words.
.
.
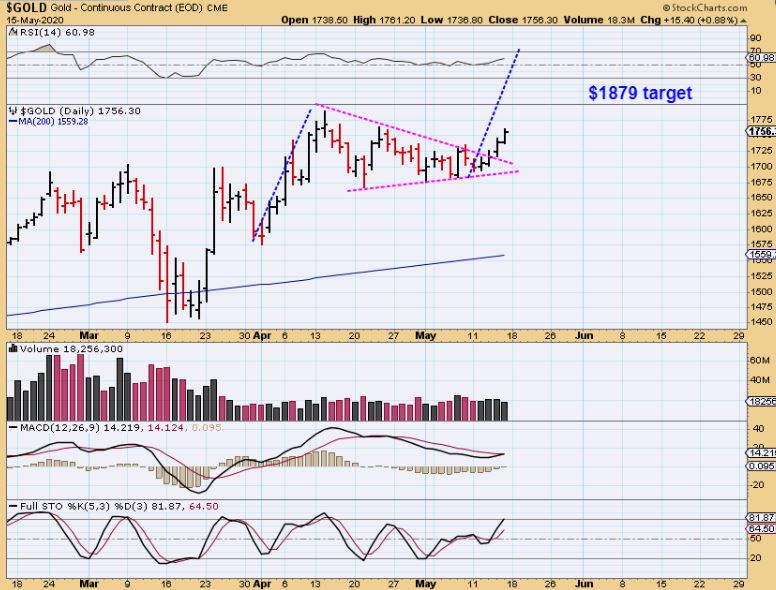
GOLD DAILY – We have been discussing this Bull Flag/Triangle and expecting a break higher, and this week was very rewarding. With a conservative short term target of $1879 or $1900, this can run to the $1900+ area very quickly if it doesn’t pause and do a ‘back test.’ This is NOT overbought and the MACD is about to cross bullishly. so…
,
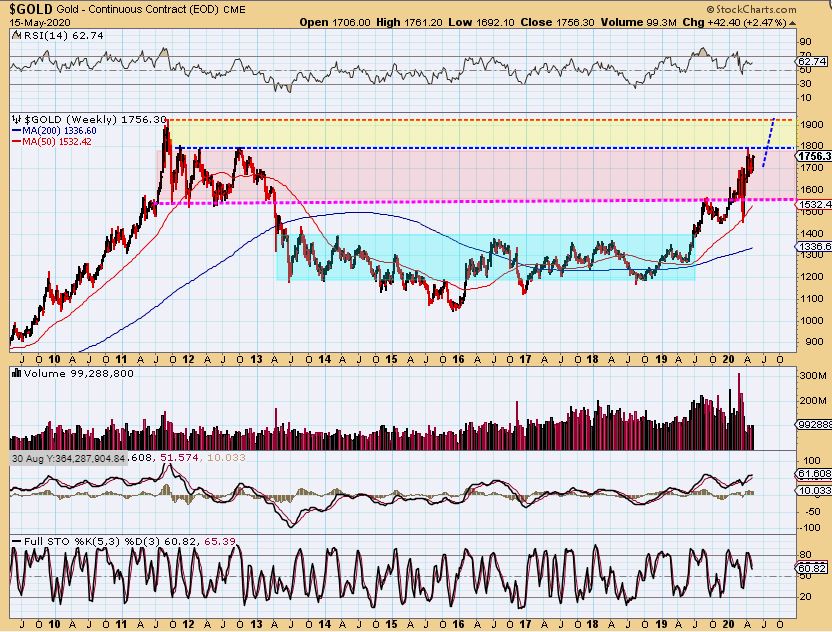
GOLD WEEKLY – We have chewed through the resistance areas that I have been pointing out and this final run has little resistance above $1800 -$1900 really. I do not expect Gold to double-top near 1900, the long term targets are onward and upward, and I expect this sector to start trending higher.
With GOLD near all time highs, I get very excited when I see Silver …
,
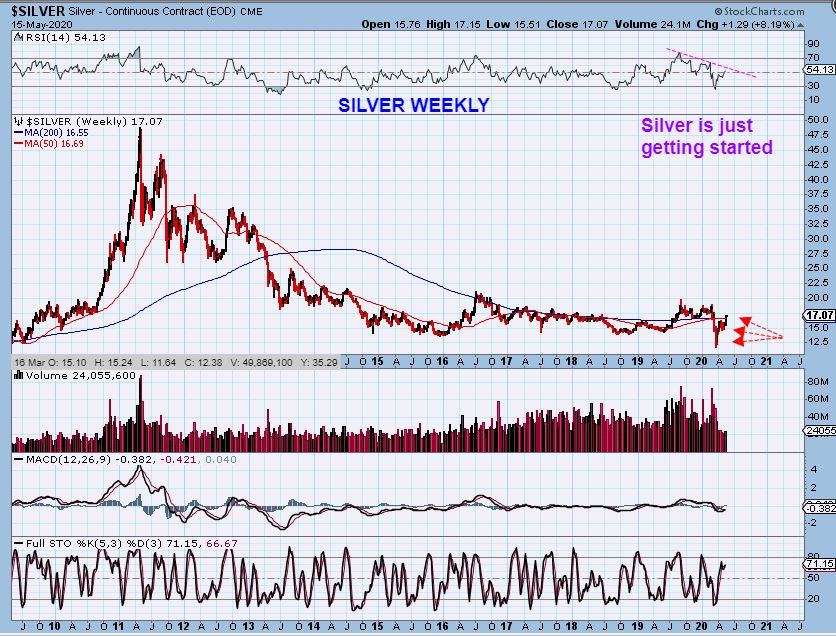
SILVER is still near the lows / base! We had a big move in Silver & Silver stocks this week, but do you see the potential here? That move this week looks tiny compared to the upside potential. And this was a Bullish development this week, because when we zoom in…
.
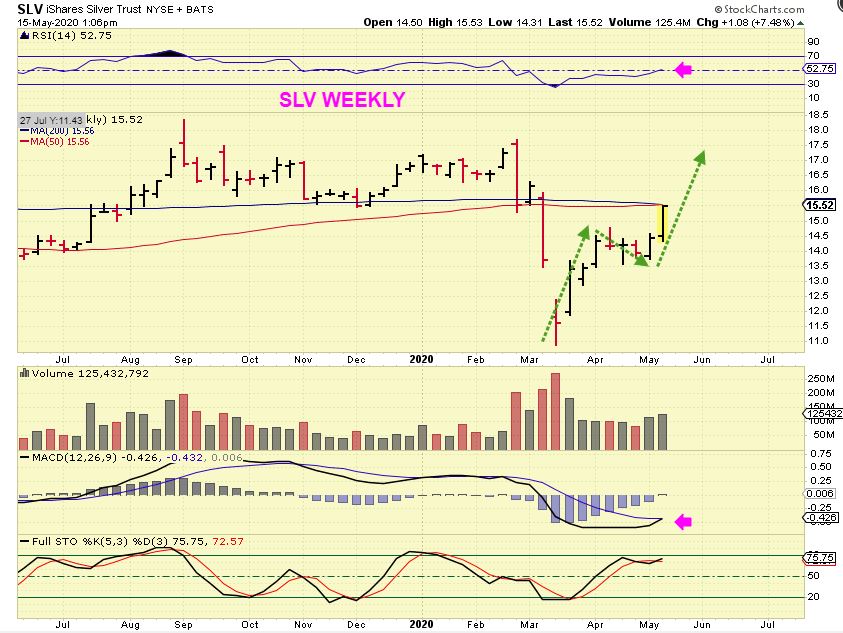
SILVER WEEKLY – On the daily I have pointed out Silvers break & ride above the 50sma, but on the weekly chart?
1. Notice that former resistance has now been broken and a run to the $20 area is within reach.
3. This is NOT overbought, The RSI is just now crossing 50%, so …
3. DO NOT SELL your silver stocks yet. ( I had someone ask me if I sold anything to lock in Gains Friday. No, I expect more upside, and honestly the daily reports have actually reflected that).
.
LET ME REVIEW SOMETHING IMPORTANT WITH YOU, ESPECIALLY IF YOU ARE NEW HERE AT CHARTFREAK.
.
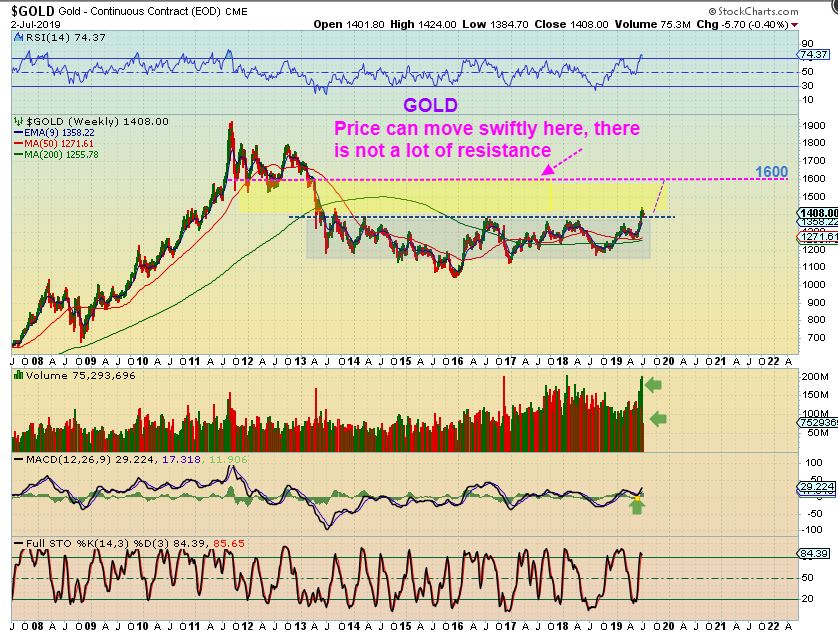
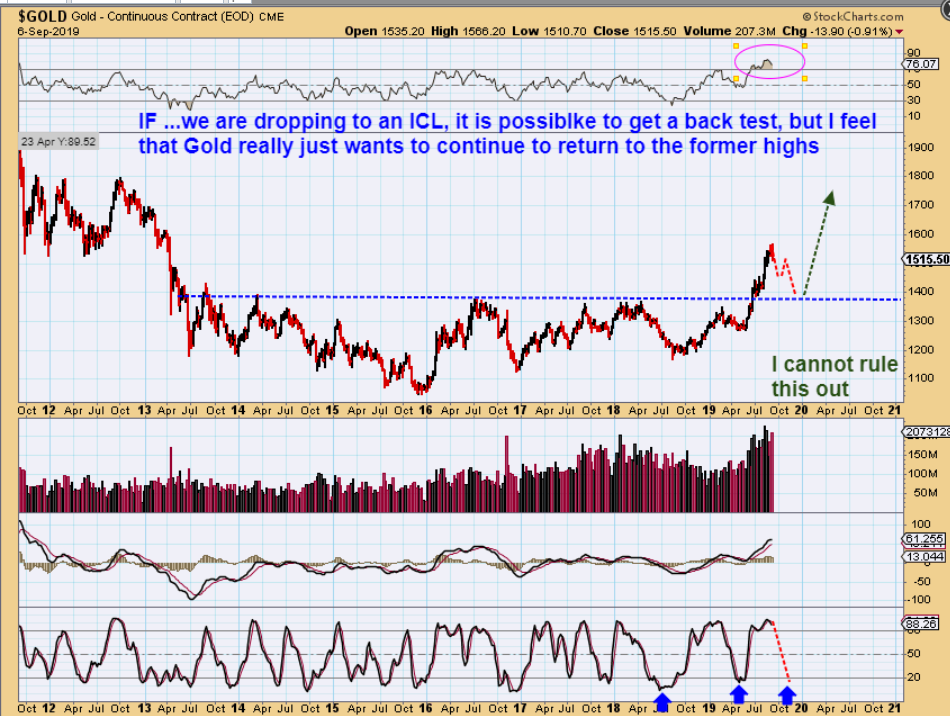
#1 . GOLD 2019. Last year I told my readers in the 2019 Summer rally , “DO NOT SELL MINERS HERE, because if we break this base, we may pause (dcl) and then swiftly run to the solid resistance above.” READ THE CHART FROM JULY 2019.
,
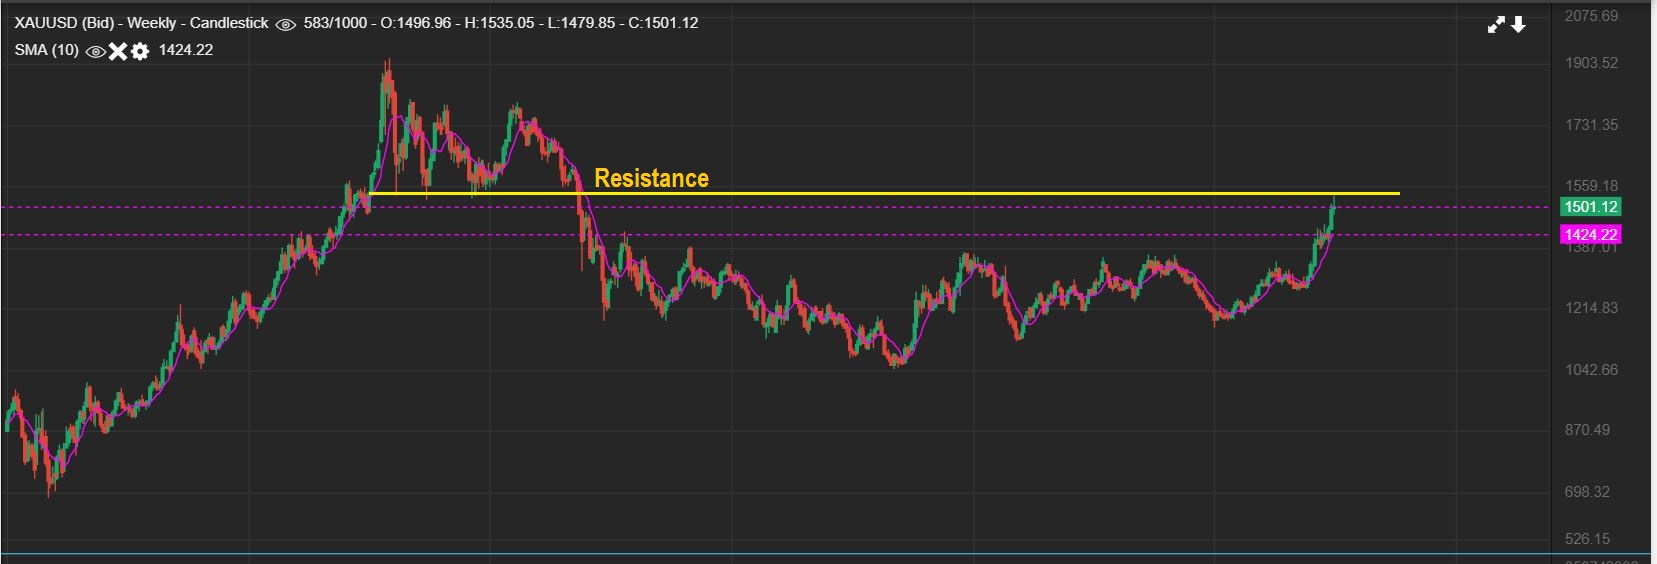
#2 GOLD . Then it broke the base & ran. The run from that base was extremely swift and it ran right to resistance of 2012 . Some of our Miners doubled and tripled last year.
.
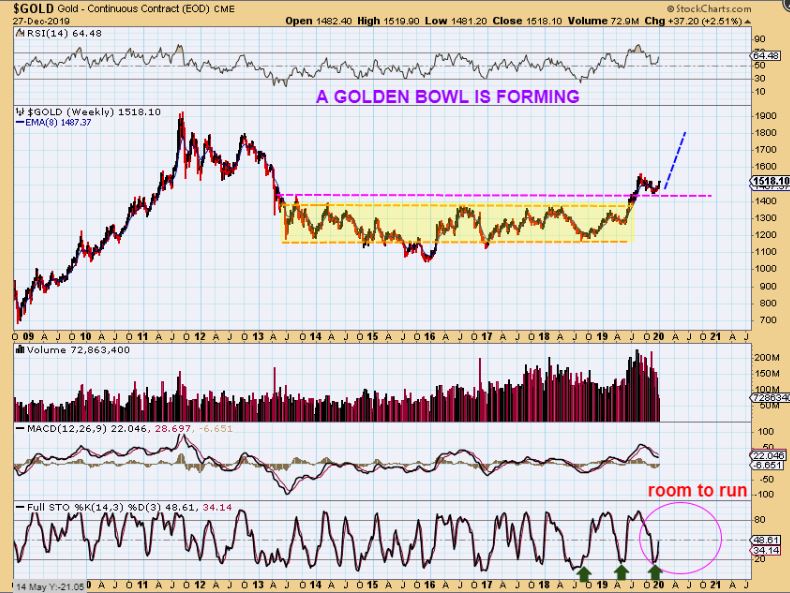
#3 GOLD 2019. After the run to 2012 resistance, I sold my Leverage , but continued to ride Miners in case we go higher, but I recommended using a stop, because this could also now drop and back test that base. LOOK AT THIS CHART…
,
#4 . After running to the resistance area, Gold did drop & back tested that base. This was playing out exactly as hoped for as GOLD began to build the giant golden bowl. And off Gold went from our ICL to the next resistance, as shown. WHY AM I REVIEWING THIS STEP BY STEP ? Because of the next chart …
.
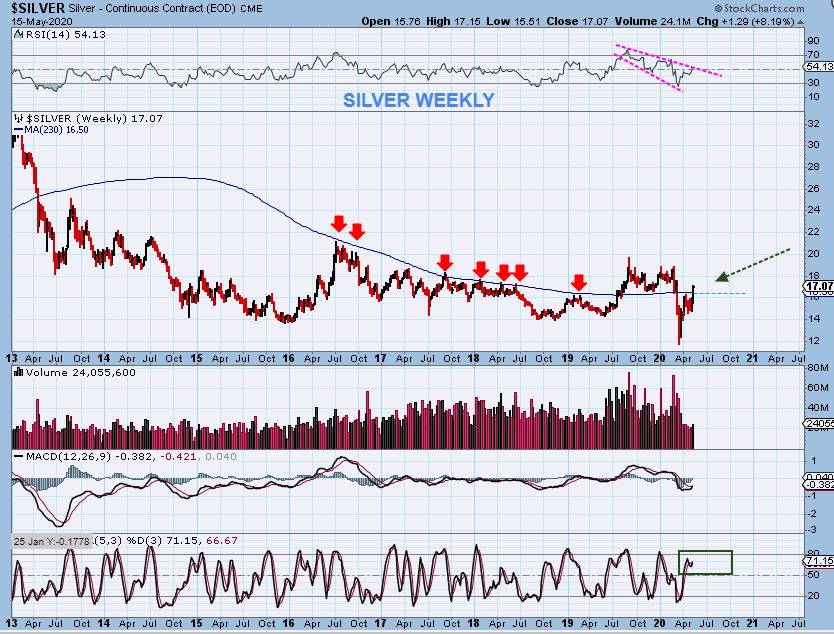
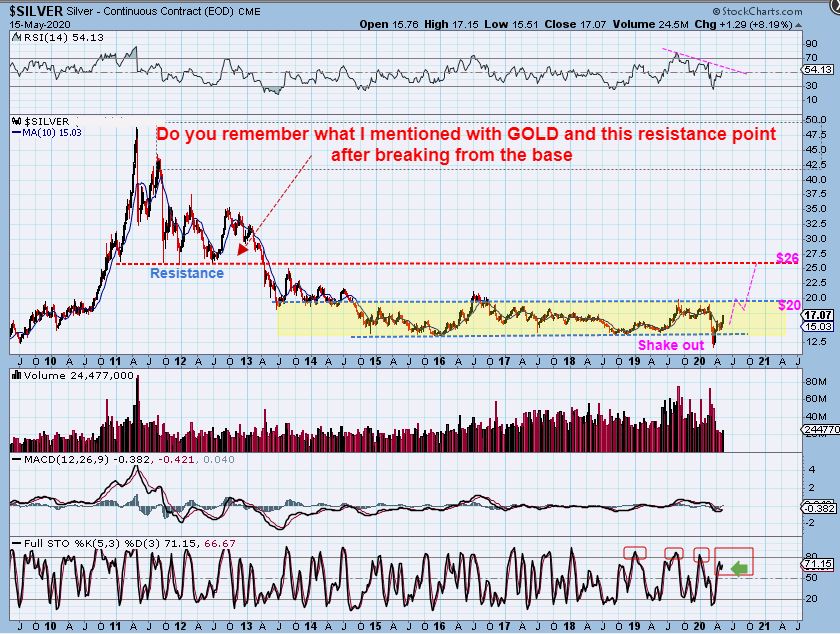
SILVER WEEKLY – DO YOU SEE WHAT I AM GETTING AT? Silver is still at the Base and The 2012 Resistance is ahead. The move can be swift when it comes, so we will continue to monitor Silver very closely going forward, with our Cycle timing guiding us along the way. Right now I have SILVER toward $20 as my next target, but $26 could shortly follow.
.
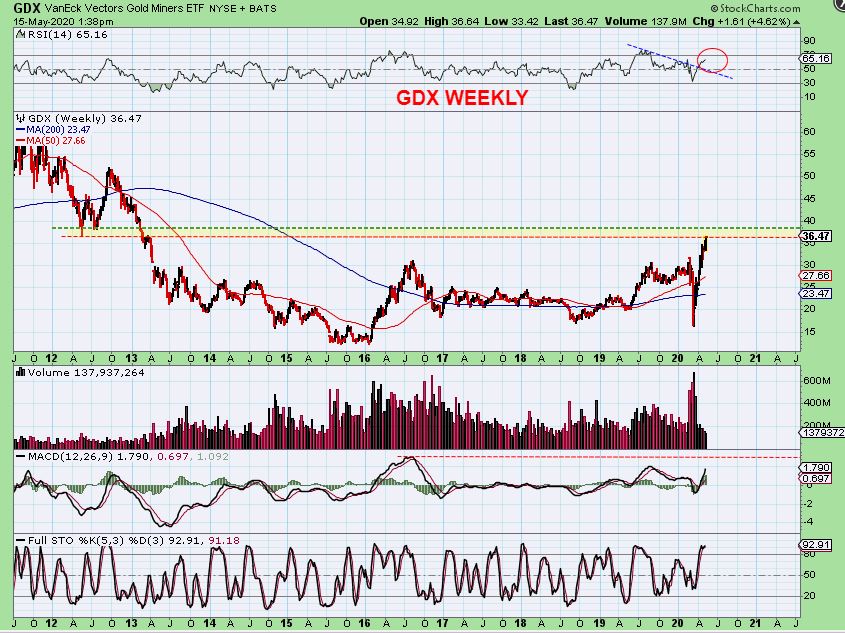
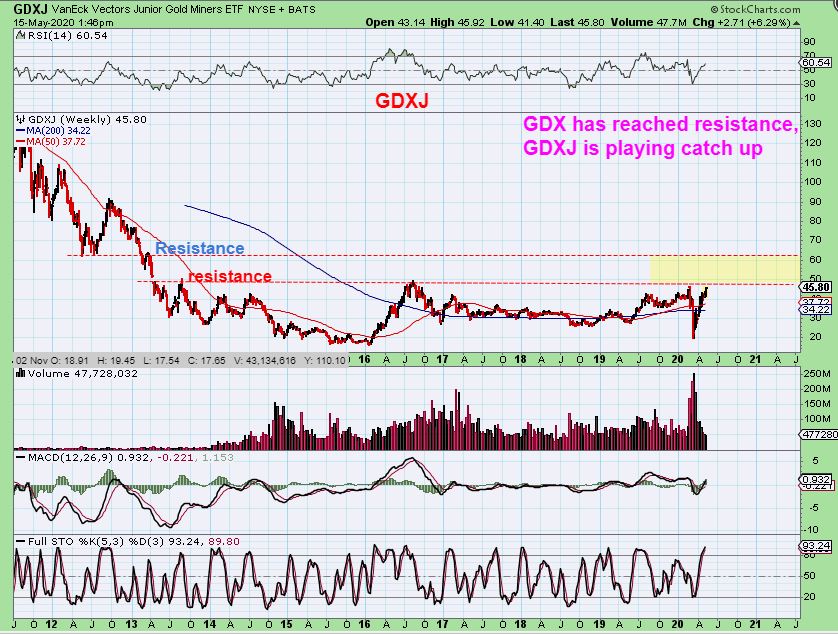
Now we get to GDX and even though we chopped sideways for the last 2-3 weeks, this looks straight up from the ICL and is also heading toward its resistance point from 2012. So again, we see how swiftly the move can be from that base to the resistance of 2012. Well guess what? …
.
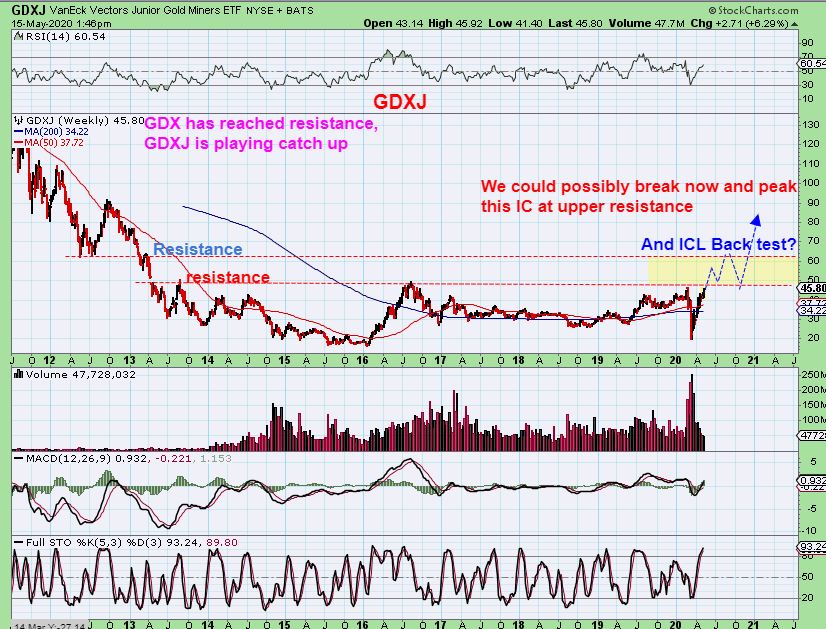
#1 GDXJ was lagging and is still in its’ base. It might be ready to play catch up in a big way. It is not at the 2012 Resistance area yet, like GDX, and you know how FAST these Juniors can run, right? …
.
GDXJ #2 – So I am expecting a strong run in the Juniors, as seen here, Whether that run takes place right now or in the very near future after a pause, it is a very bullish set up.
.
We have been doing a lot of trading lately. We trading Tech stocks ( AMD, TSEM, SQ, WORK, CRWD, UBER, etc etc ) , and Corona-Virus candidates ( like NVAX, MRNA, VIR, INO, IBIO, etc etc ) and even Energy stocks well before Oil bottomed ( APA, MRO, TUSK, OAS, DNR, PVAC, etc etc).
We also have been Very Focused on Miners since that ICL bottom was identified in March. Last week was a great week for the Precious Metals enthusiasts too. After patiently waiting for the recent 2-3 week consolidation or choppiness to end, we saw some Miners up 10% Thursday and then up another 15-20% again Friday. I don’t think that the run stops here, so lets enjoy the ride. I’ll be discussing this more in the daily morning weekday reports.
.
Be safe, and enjoy the rest of your weekend, we can look forward to next week with high hopes! 🙂
.
~ALEX
.
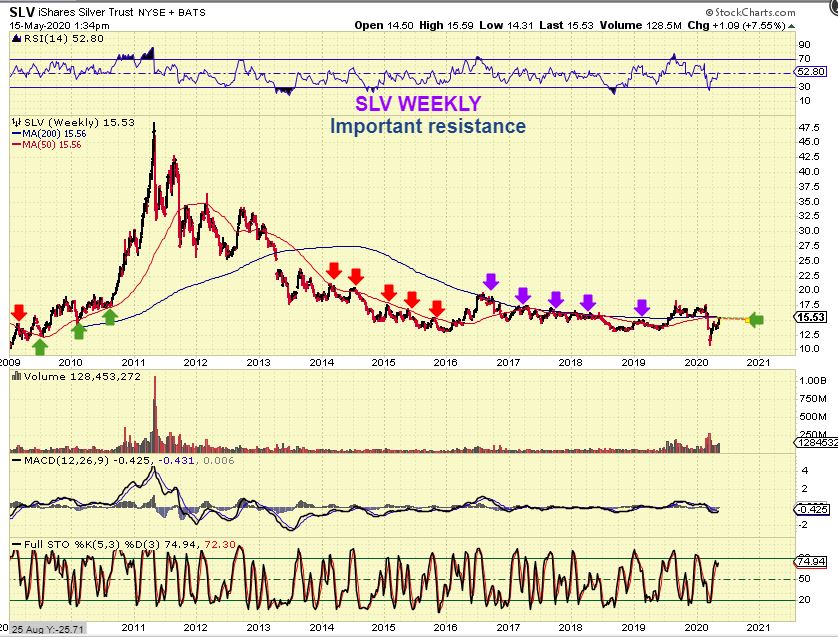
SLV WEEKLY – Many followed me into USLV a while back, so I wanted to point out that even though it is at resistance, I still expect higher price sooner than later. And…
.
SLV is at an important double resistance area . I do expect Silver to run higher, so when Silver runs and pushes this above this 50 & 200 week ma, it should be viewed as a nice bullish development.
.
Trades from THURSDAYS report. If you were a subscriber, these are some of the set ups that you would have been looking at / buying.
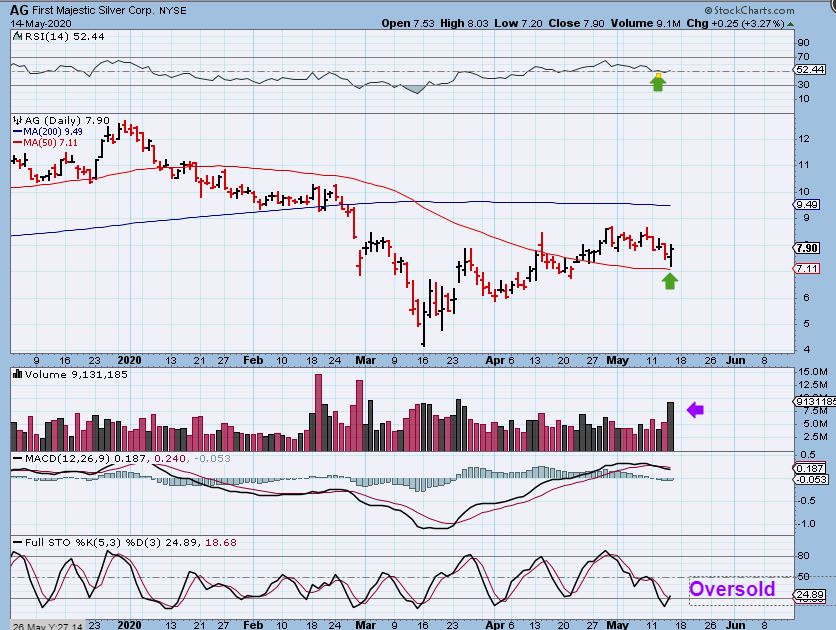
AG – Perfect entry here with a high volume reversal at support. AG is oversold.
.
AUMN – So I bought AUMN because often I see Volume precede price. High volume could lead to a good solid move and MORE IMPORTANTLY …
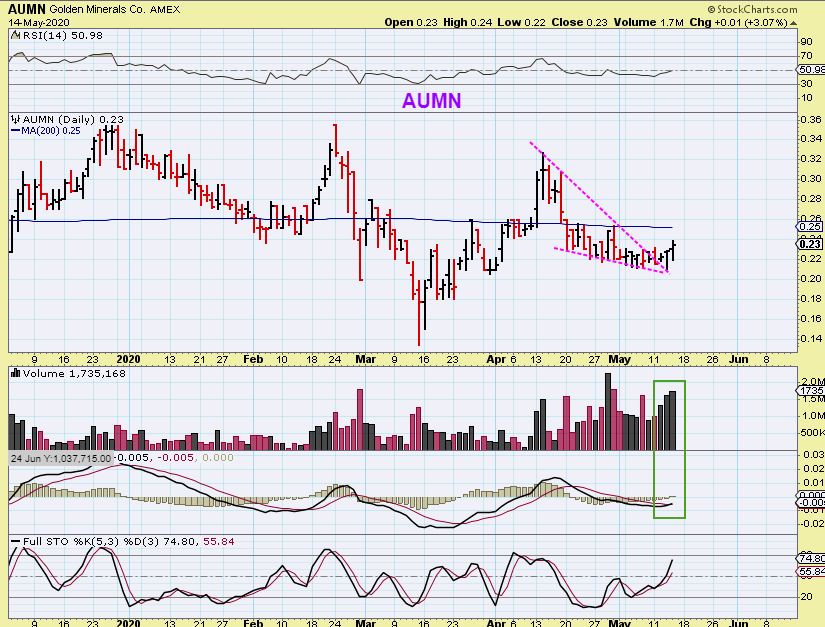
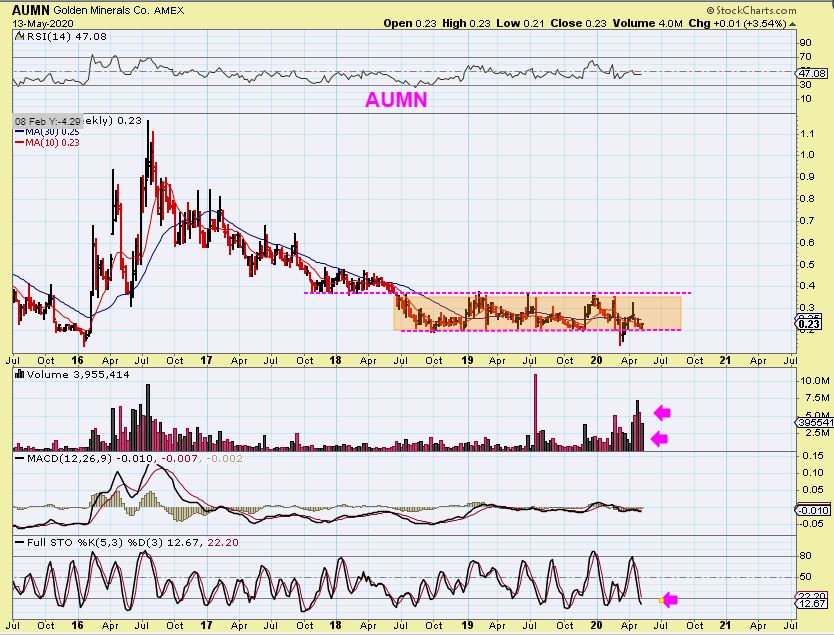
AUMN WEEKLY – I see a weekly base shake out. This is more of a ‘lottery ticket’ buy & hold for me. This is extremely Bullish strictly based on chart technical analysis, and that has worked out very well for me in the past. Start with a small position, hope that it gets running, and I will add to position if it acts correctly. 2016 saw this run from roughly 12 cents to $1.12. Almost a 1000% gainer 🙂 That was the roughest ride out there though, look at 2016.
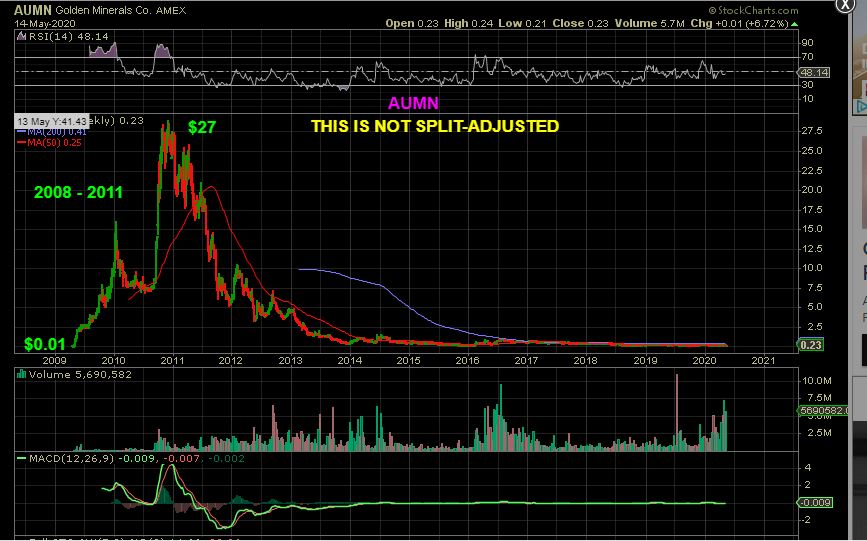
AUMN WEEKLY: O.K., Let’s not get silly here, but obviously AUMN has done miraculous moves in the past. This is not a split adjusted chart, this stock ran crazy in 2009-2011. So for me, with that base shown in my last chart above, I’m going to start a position, buy and hold, and see what I get. If we start a Gold Bull run, this could pay off over time.
.
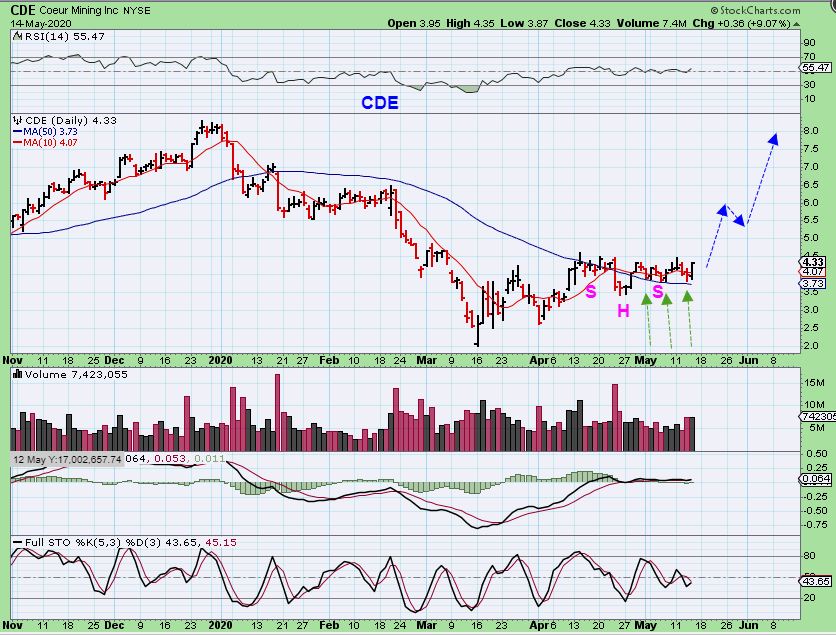
CDE – I’ve been showing this chart for weeks now, as it bounces above the 50sma as a BUY. It is finally lifting off, up 9% yesterday.
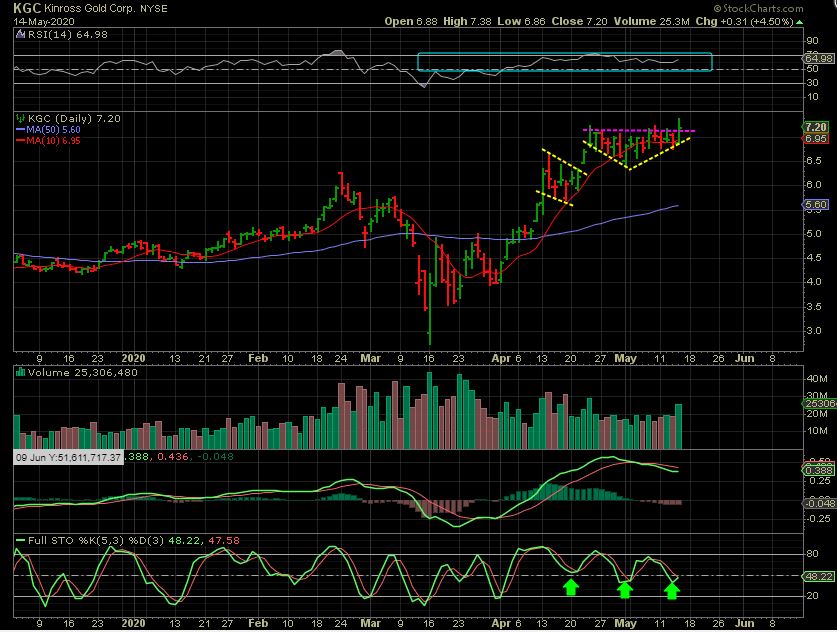
KGC has had a nice consolidation here, popped to new highs, and should continue higher. This is what Bullish sticks do as they trend higher, and AEM, NEM, GOLD, RGLD, etc are similar set ups and beautiful charts.
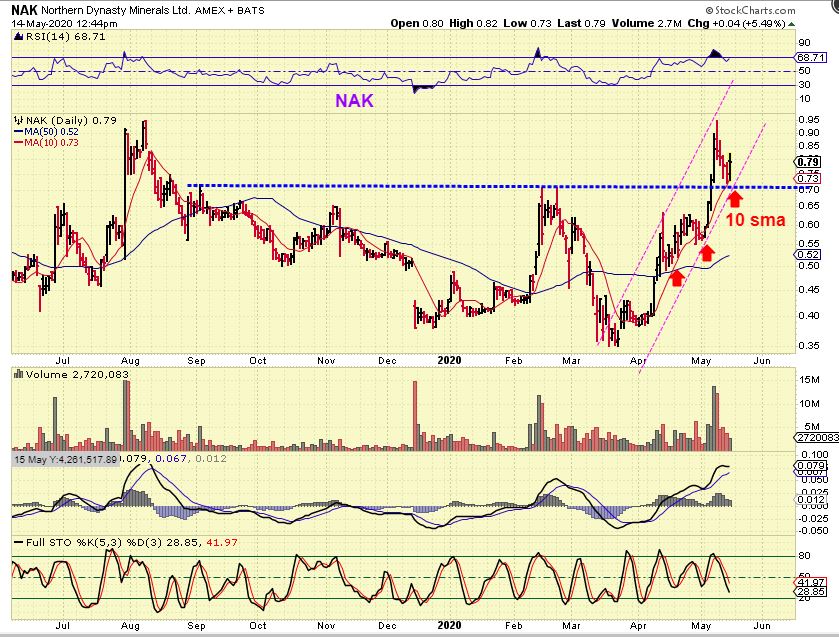
NAK back tested and reversed.
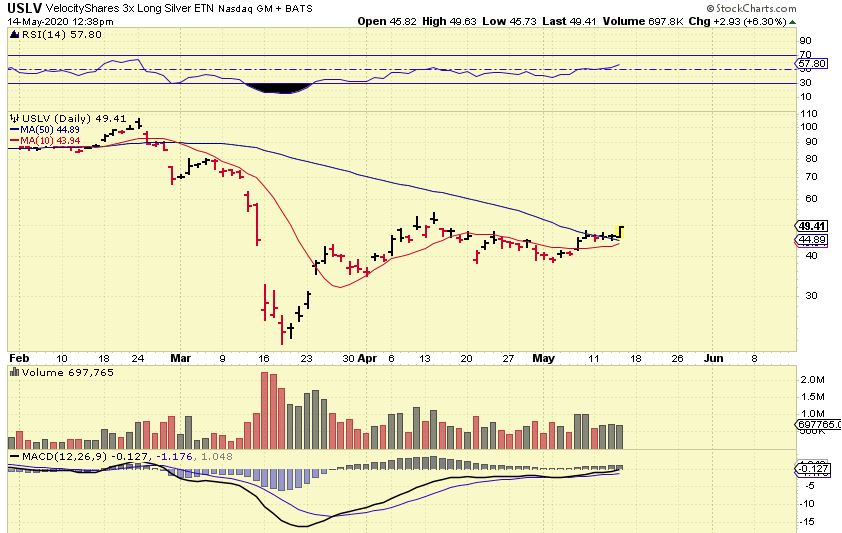
USLV – I have mentioned that I’ve owned this one for a while and expect it to run with Silver. It is not unreasonable to expect it to run to $100+ . At this point, Silver is pushing higher and can also just run swiftly from here.
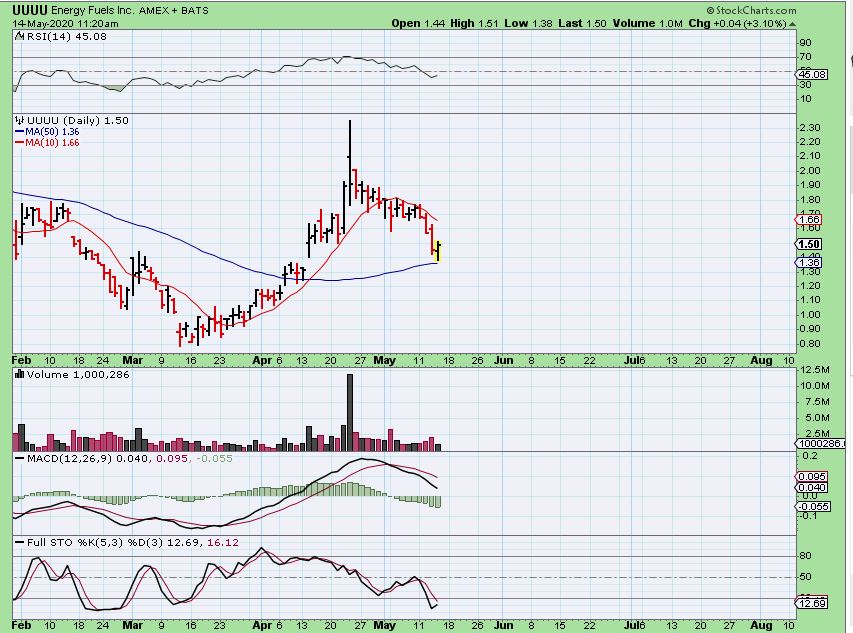
UUUU – After a strong run, Uranium Stocks are finally at a point where I would be comfortable entering. They run similar to Miners, with a dcl likely coming in for their first daily cycle.
.
Do you think that this kind of analysis, in addition to your own trading style, would be helpful? This is a great time to join us at Chartfreak. Things have been playing out as expected here all year, and there are some great opportunities ahead too. I have been discussing this in the daily reports, why not try a month and see if these reports can help you in your trading . 🙂
For more information on signing up, you can click on the link below. Thanks for checking out Chartfreak!
.

