WEEKEND REPORT MARCH 12th
I have decided to post the weekend report to the public section of the website. Here at Chartfreak we have been mainly long Miners for several weeks weeks and shorting the bounces in the General Markets using SQQQ and SOXS. Using cycle timing, I have been expecting a pullback in the Precious Metals sector for the week of the Fed, so this is the weekend report leading us into that Fed Mtg on Wednesday March 16th. Enjoy!
.
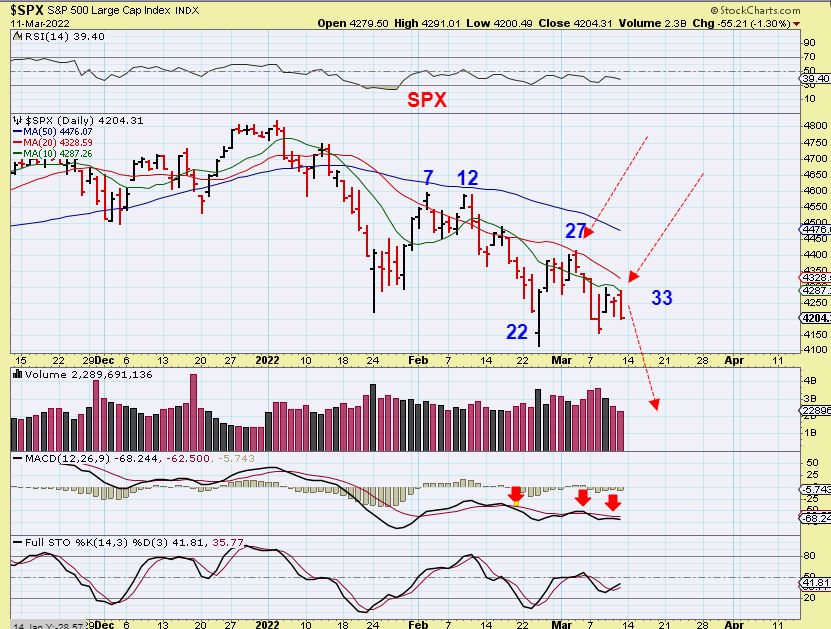
SPX DAILY – Friday was day 33 and after a gap open higher, price was rejected at the 10sma and sold off and closed near the day 33 lows. I have been expecting the day 22 lows to be broken and that should happen next week. These daily cycles can last for more than 40 days. Next week is a Fed Week.
SPX WEEKLY – We have seen a very strong bull market, but at this time we expected this market to break down and now we see the strong support of the weekly charts has been broken and price sold off below it. The General markets are dropping down into an ICL over time.
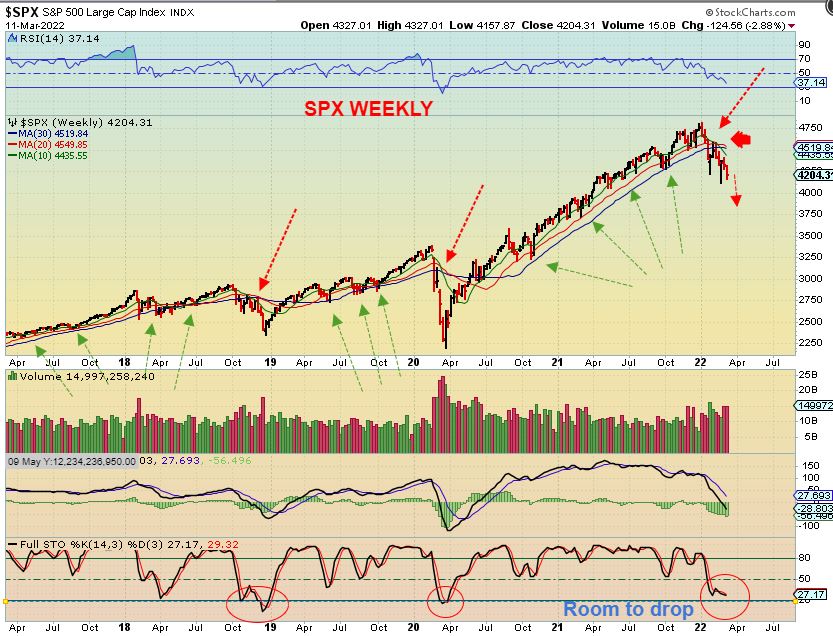
The General Markets had failed daily cycles , as pointed out in past reports, so they are dropping lower over time until they find their ICL. Is the next swing low going to be just a DCL or will it also be the next ICL? We’ll know only after it forms. For now I expect a market drop into the next Daily Cycle Low.
LAST WEEK I USED THE FOLLOWING 3 CHARTS AFTER MARCH 9 TO EXPLAIN OILS SET UP:
.
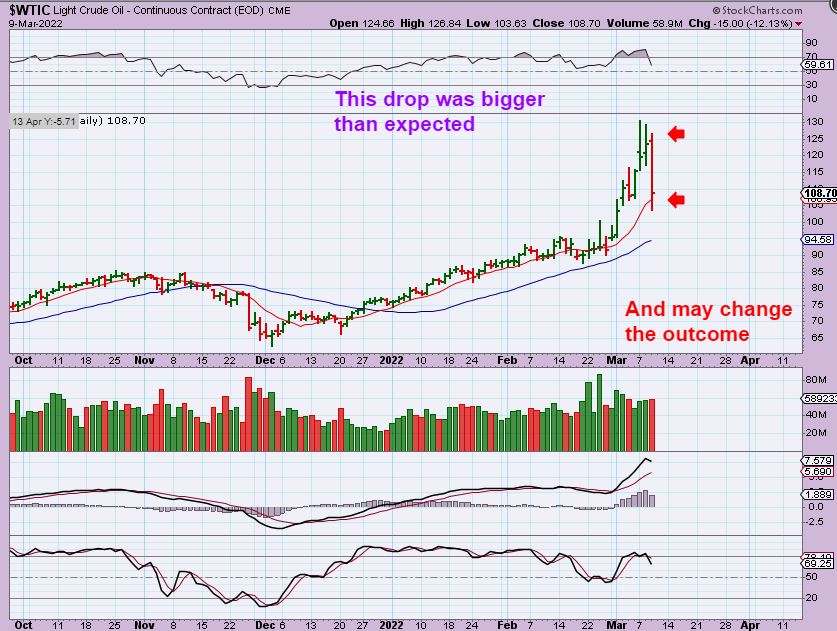
WTIC DAILY – Oil had an usually Sharp 1 day drop on March 9th and that MIGHT be putting in place a day 10 top for this daily cycle. If so this would become a left translated daily cycle.
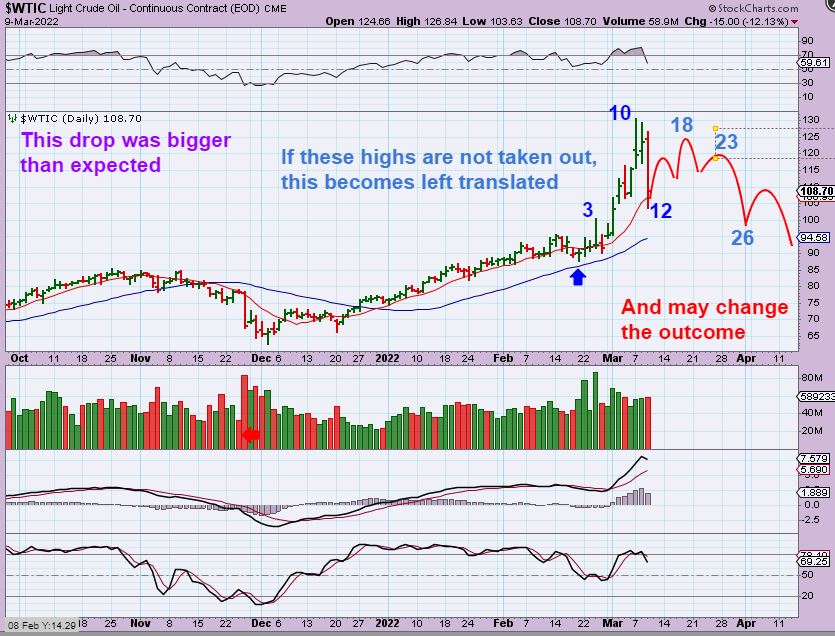
WTIC DAILY – So we will be watching Oils path from here to see if a bounce can make new highs or to see if this is possibly topping with a lower high. Previously I had been looking at a $140+ Price target before that sudden surge and drop, but this might mean that the top is in for now. Price dropped from $130+ to $103 in 2 days.
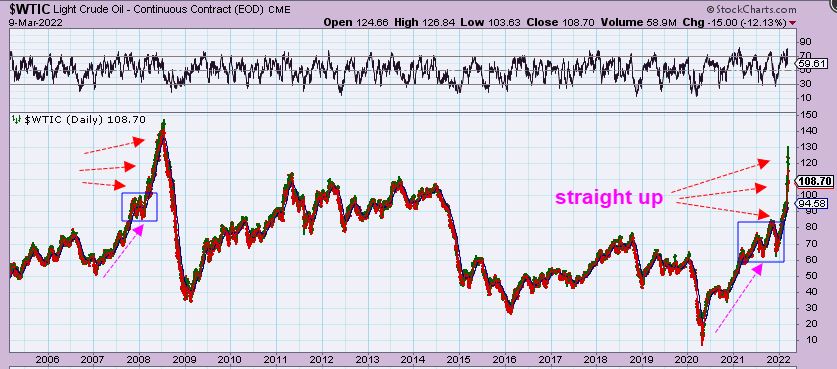
WTIC DAILY -I pointed out the speed and straight up move as a possible parabolic blow off top. If day 10 is not exceeded, this is indicating that Oil has exhausted the move, but we’ll need time to see how this plays out. You can be long Oil with a stop, since it is still early in Oils daily cycle, but it may get choppy.
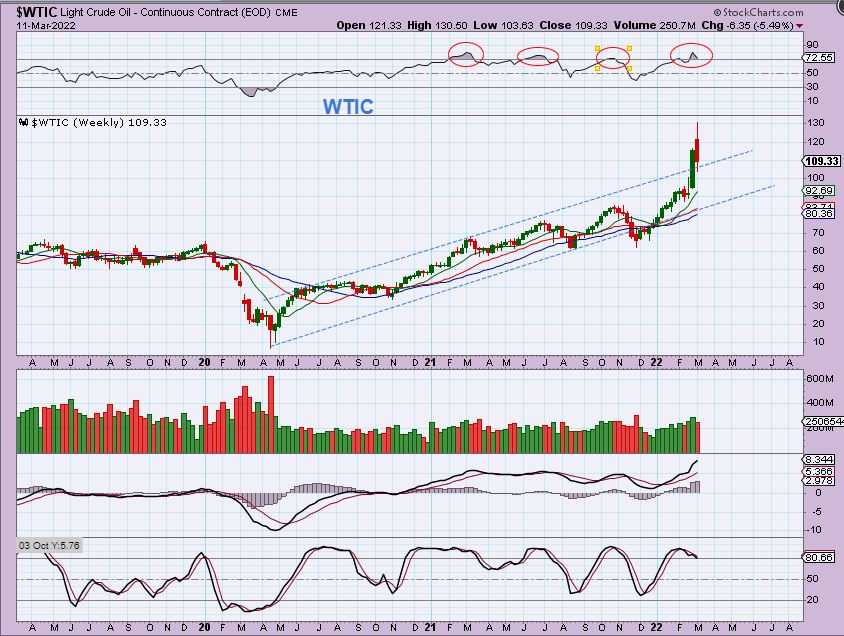
WTIC WEEKLY – 2 trading days later we got a large weekly doji (Indecision), but that was really expected, since it is only day 14 and Oil can trade for 40+ days. We just have to see what happens over the next few weeks ( and I think that more volatility can be expected with the war going on). Passing time may reveal that this is a false break out.
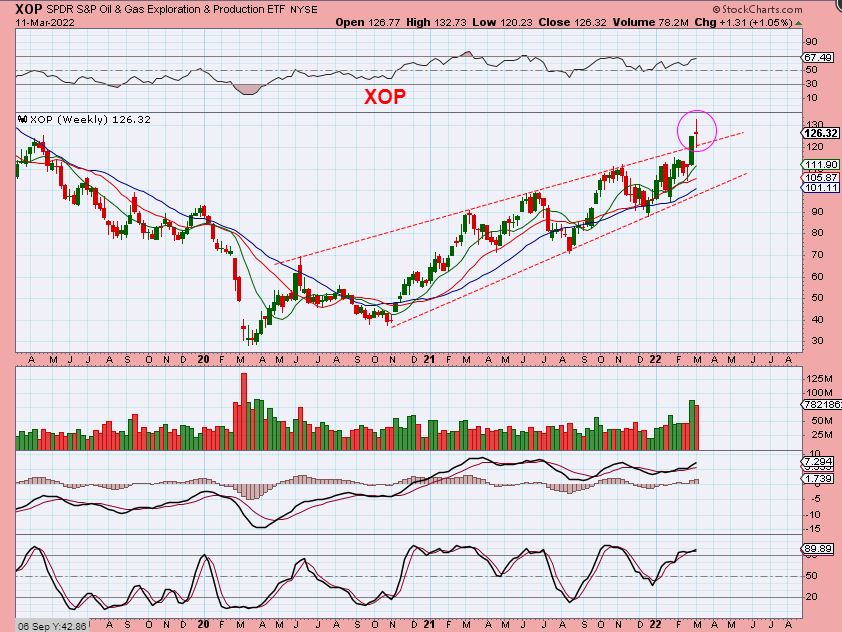
XOP WEEKLY – The XOP also broke out, but Oil stocks did not get as extended as Oil and even if Oil just chops around in the $100-$130 area, Oil stocks may still rise.
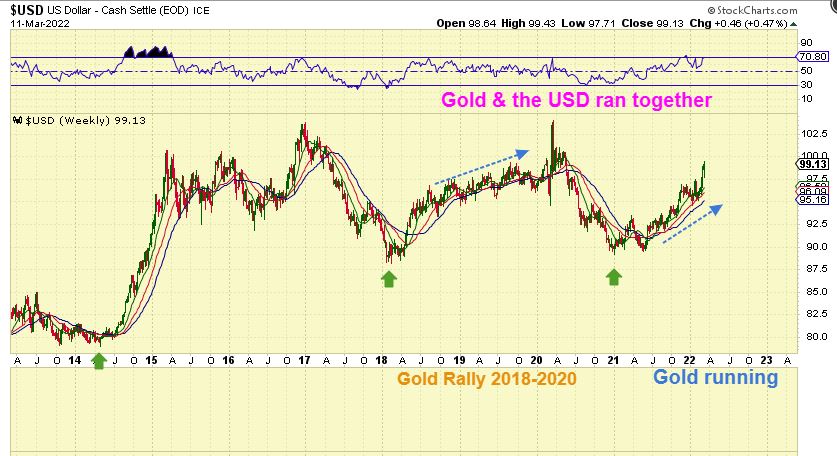
USD WEEKLY – The only thing that I want to point out here is that what I had been saying for a year is playing out. I was pointing out that in 2018-2020, The USD & GOLD both ran higher together, so I said that if it happened then, it can happen again. It has been happening again. With this run in the USD late 2021-now, Gold ran from the lows of that large Cups ‘handle’, back up to the highs.
.
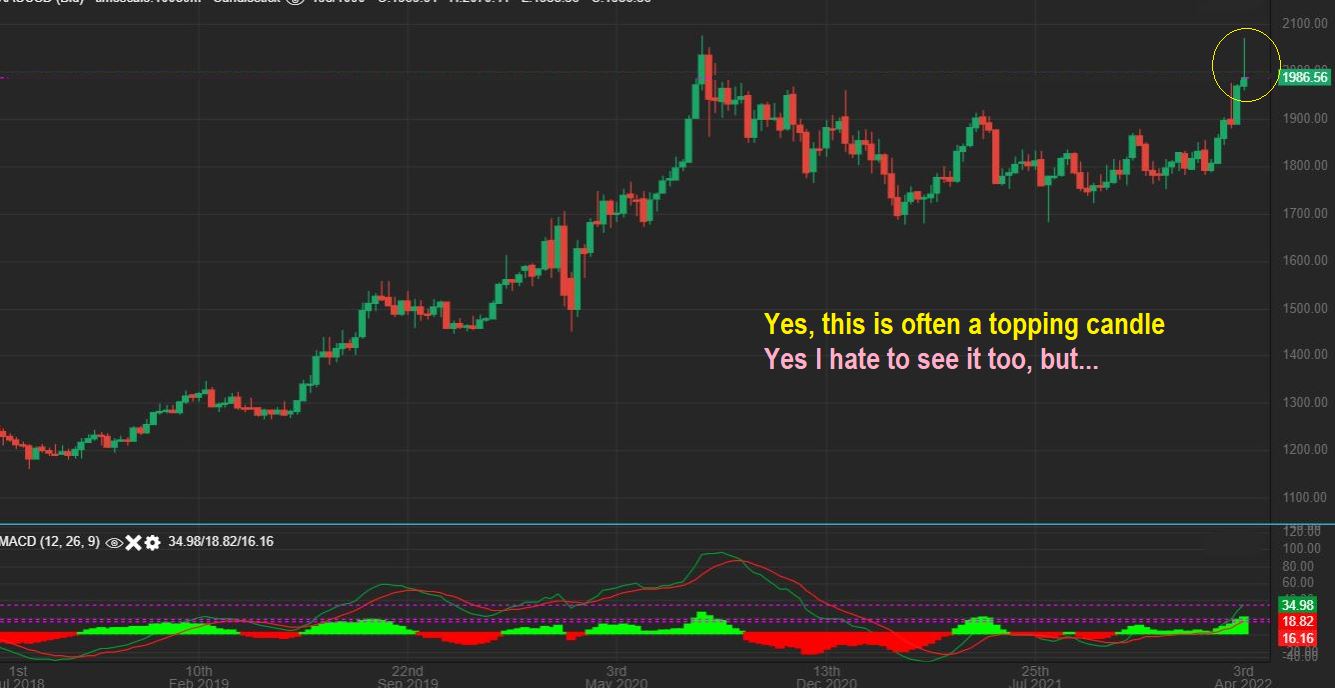
In the past I have shown this topping candle – ‘The Shooting Star‘.

.
GOLD WEEKLY – I hate to see what is usually a “topping Candle”. These usually do come at the top of a run as an exhaustion of buying & profit taking, but let’s discuss this just a little more.
.
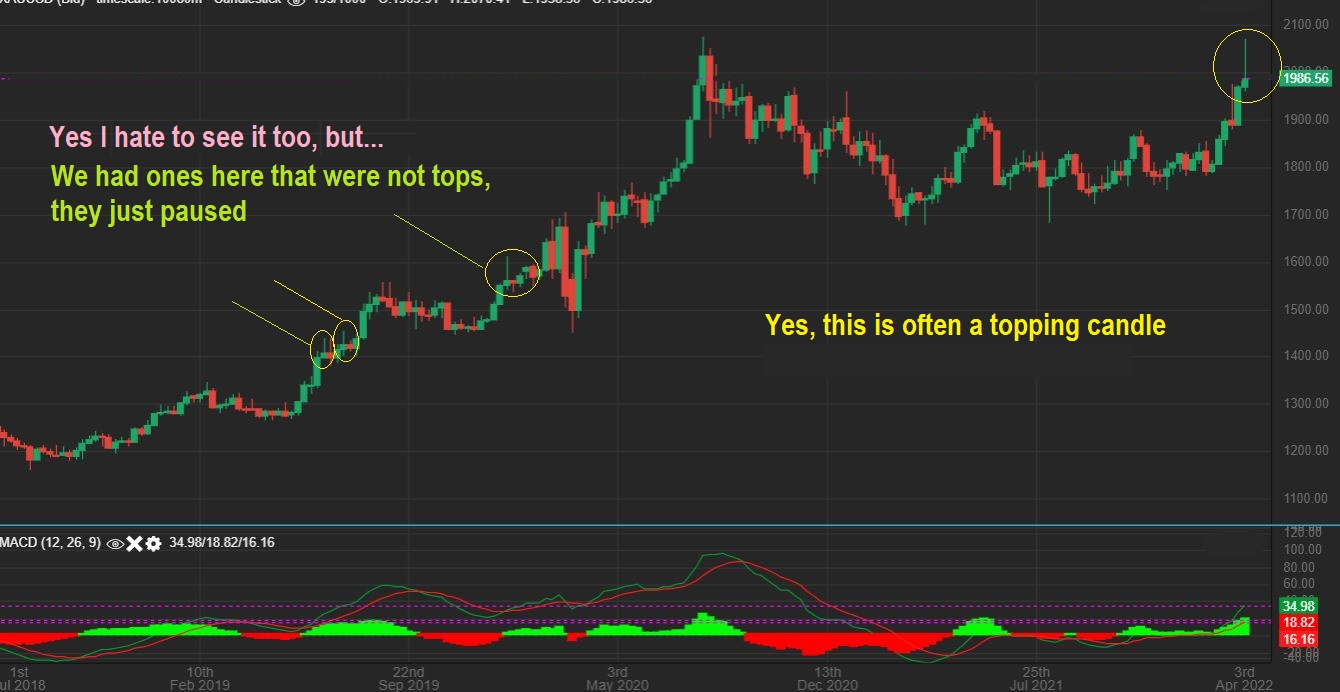
GOLD WEEKLY – I have seen in the past when these shooting stars did show up after profit taking, as seen on this chart, but then paused and continued higher. This is how I am looking at this chart…
1. Each of these circled shooting stars had 1 red week that followed and then they went higher.
2. The current daily cycle is on day 30, so a dip into a dcl is due next week.
2. Next week is a Fed week. Please be mentally ready for a dip, I have been calling for that for weeks.
SILVER WEEKLY – This was a the strong break out from the downtrend that I was hoping for, but now we have a shooting star here too. My discussion about this with Gold applies here too.
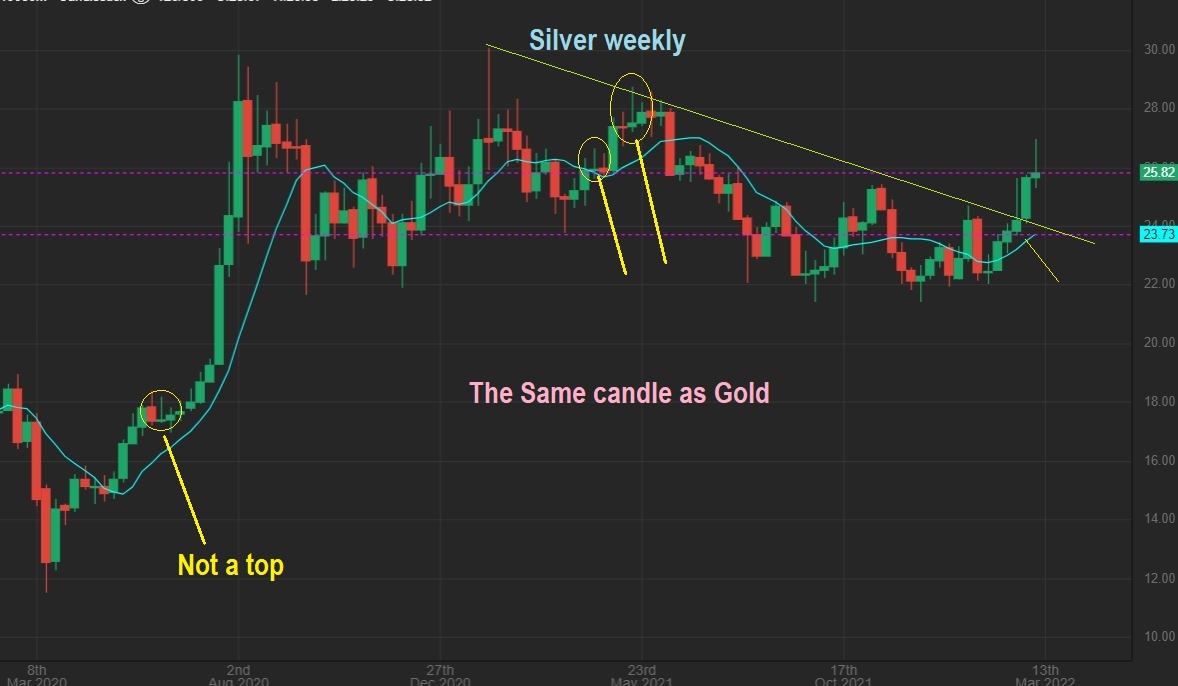
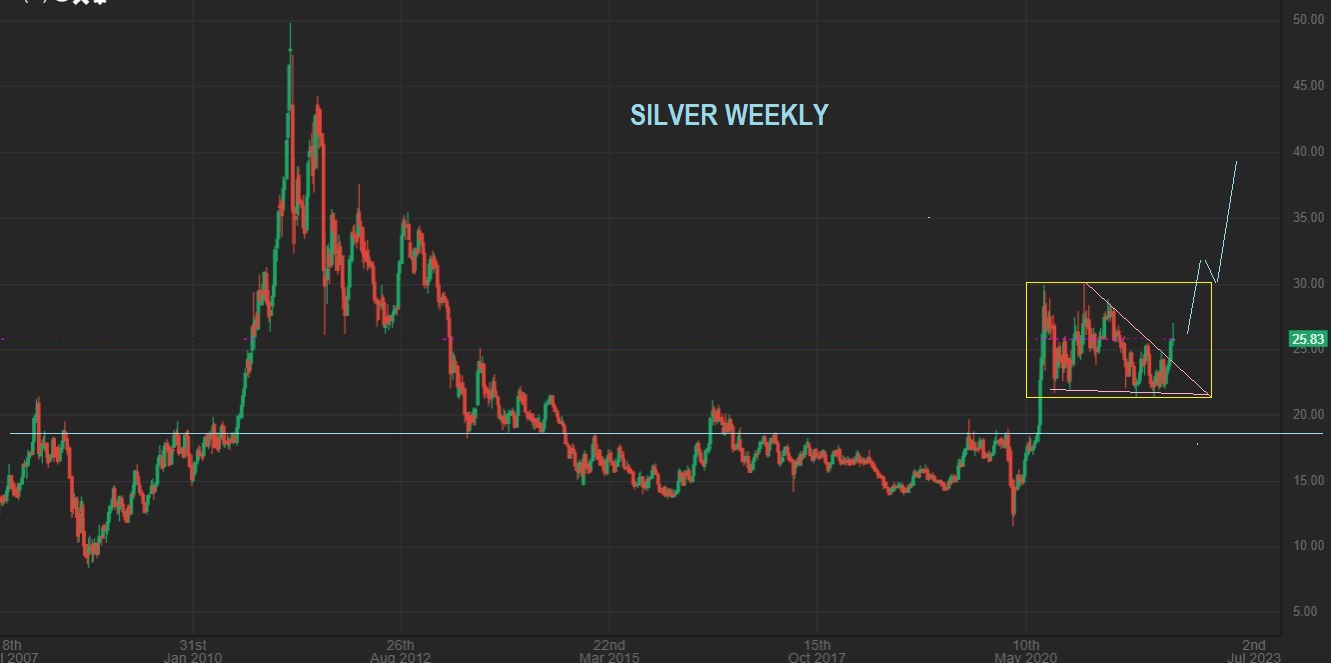
IN THE BIG PICTURE SILVER WEEKLY, I was pointing out that we needed a break out from that downtrend and then price could rocket higher, since Silver often moves very quickly. I think Silver will continue higher after we get a dip next week.
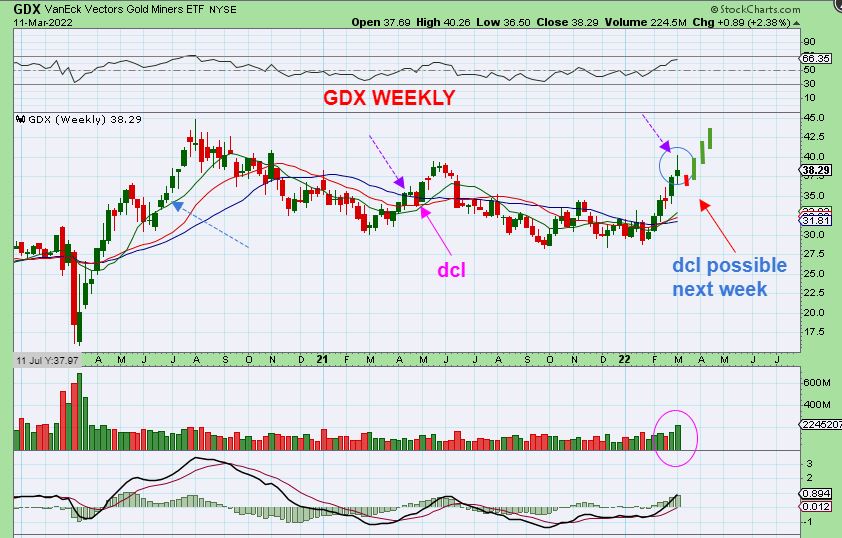
GDX WEEKLY– Miners have raced higher over the past few weeks as expected too. For the past few weeks all were admonished to buy and hold a basket of Miners ( or ETF) and ride this blast higher. We did this in past strong rallies like 2016, 2019, 2020, and I mentioned that those who were afraid to buy got left behind. Next chart please…
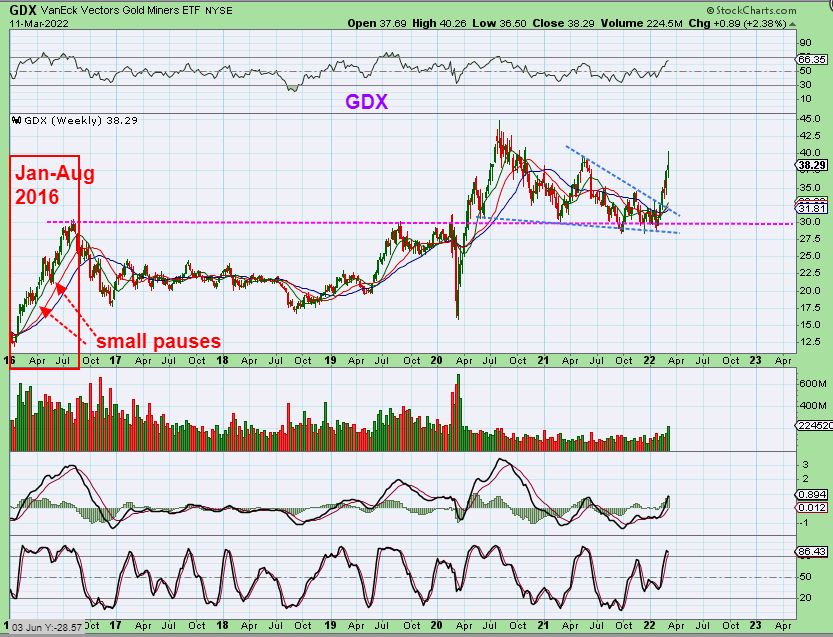
Here I am pointing out in 2016 that there were ‘Pauses’ at daily cycle lows along the way then too. I expect this current run to continue higher, but we may have ‘pauses’ along the way first. Next week is a Fed Week and we are within the ‘cycle timing’ for a DCL, so we must expect a pullback on this coming week.
.
SO THE GDX WEEKLY CHART has that ‘topping’ candle too. I am cautious when I see that, but I have also seen those before and price continued higher too (blue arrows). Here I am pointing out ( where I wrote ‘top?’) an example of that where we had one of those candles about 1/2 way up. It dropped for 1 week and then shot up higher. In the coming week a dcl (Daily Cycle Low) is due and the Fed meeting is scheduled. We have to at least expect a dip.
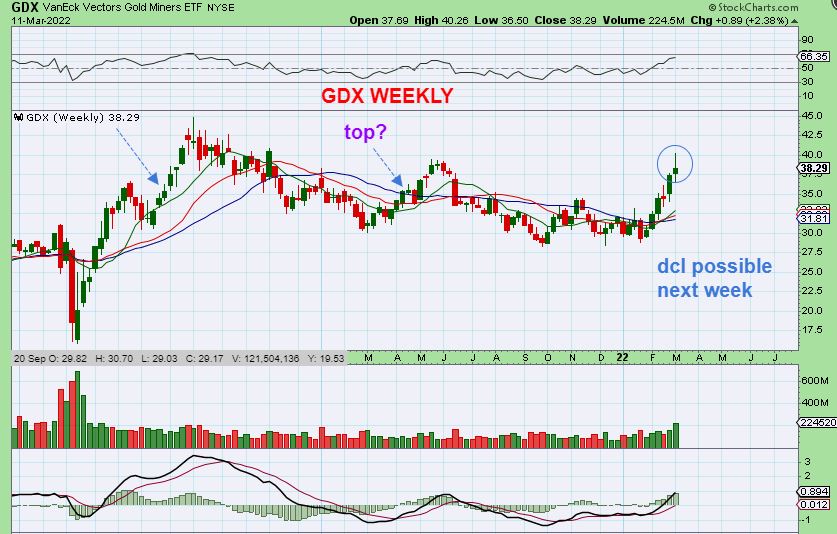
GDX WEEKLY – This is the same view, but I drew in a possible 1 week drop on Fed Week next week, and then that continuation higher. I would love to see this chart play out this way even though we have to endure a dip on Fed Week. Many miners are still giving us surprises to the upside, so a basket of miners might not pull back all that much.
.
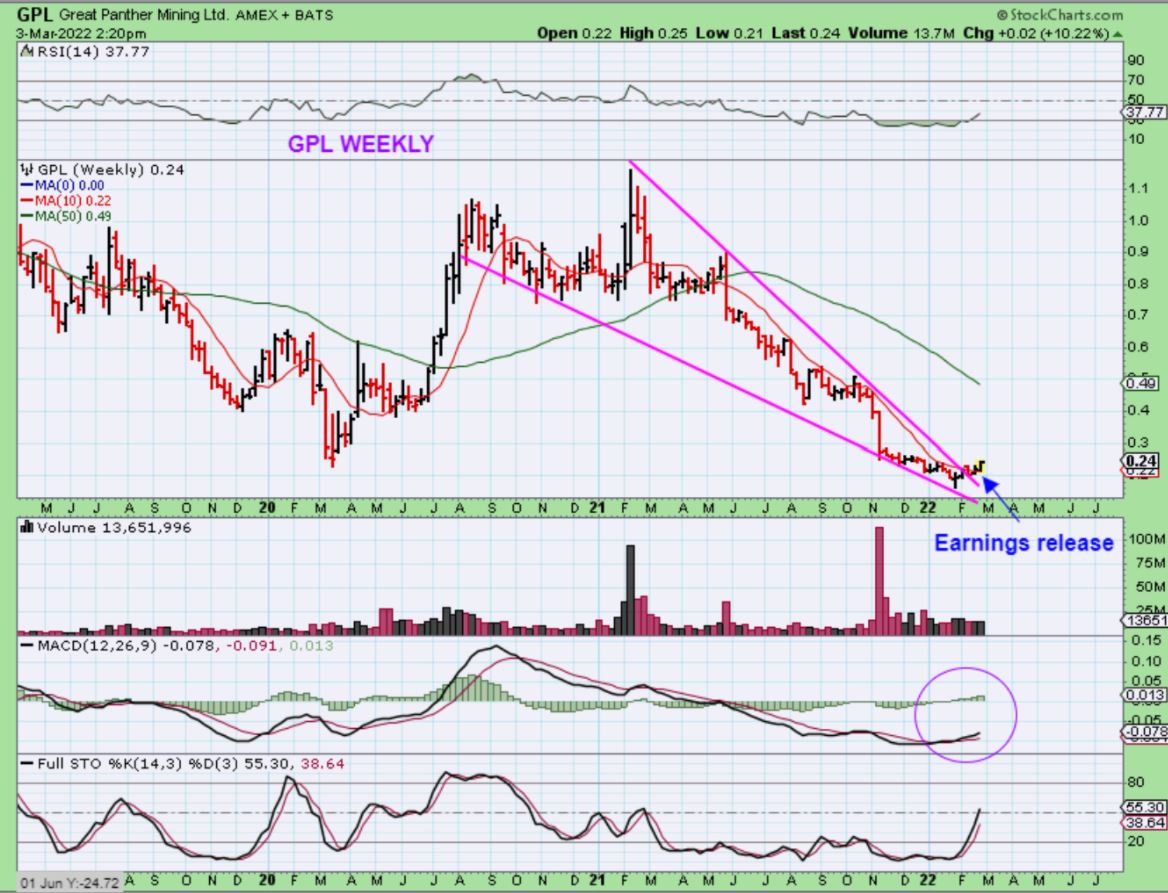
If you get a chance, check out WEEKLY Charts of SSRM, NEM, GPL, VGZ, TRX, PVG, AUMN, and more. I think you’ll be surprised at how good these all look. It does look like the Juniors are starting to play catch up too.
.
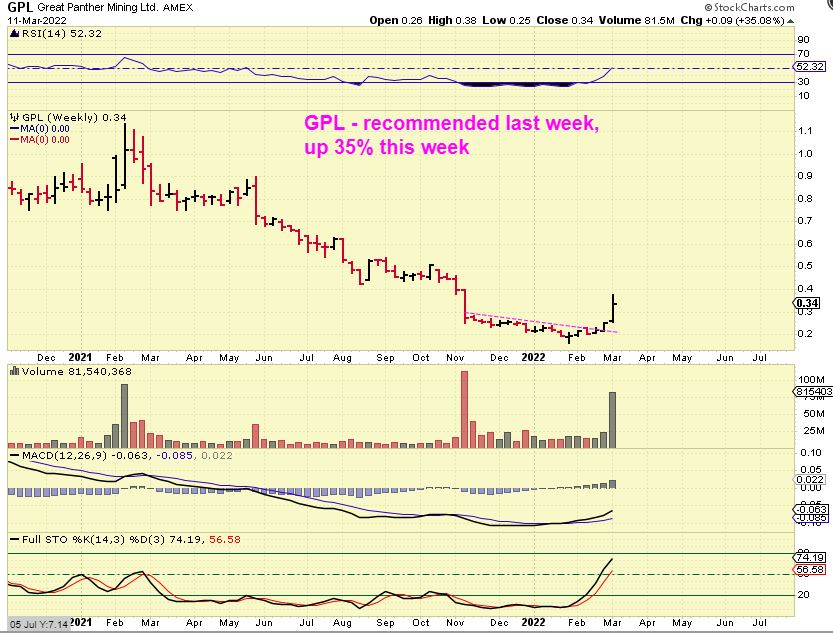
For example, GPL was recommended on March 4th with these 2 charts…
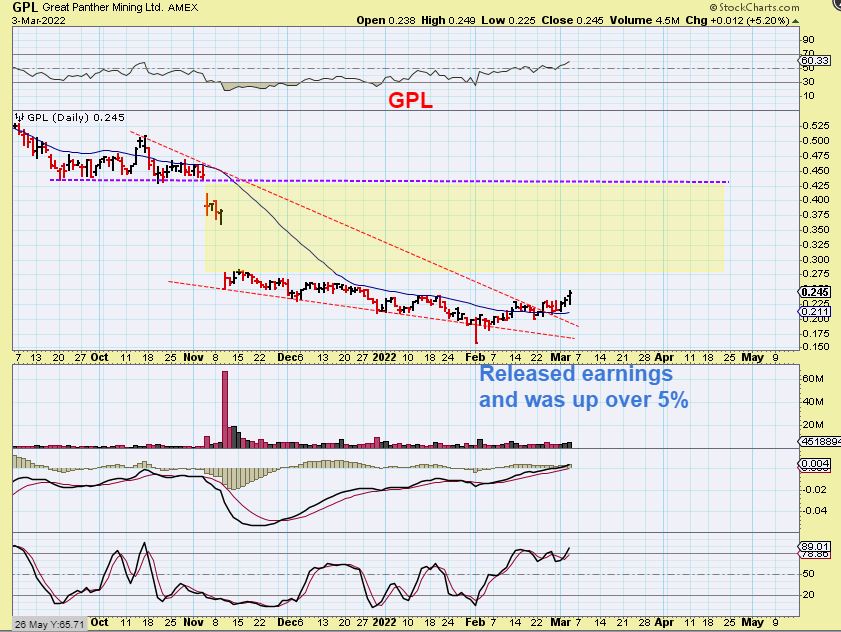
GPL was up 35% last week. Take a look at those others on a 2 yr weekly chart ( GSV, AUMN, PZG, etc). These may be set up to run next.
.
Things have actually been playing out very much as expected over the past few weeks, with the General Markets struggling and pushing lower (we have shorted the bounces) and the Precious Metals running higher. Now we are at that point where the Fed Meeting has arrived and both of those sectors are ready to dip into a dcl. Once we get through the F.O.M.C. Meeting and we get the anticipated dip into a dcl for the Precious Metals, that should be a buy signal for any that want to add. With the timing for Gold currently being day 31 Monday and day 33 Fed Wednesday, it is possible that the DCL COULD even come the day before Fed Wednesday, the day of Fed Wednesday, or the days after. We just have to watch how things play out, but things have really lined up well with our expectations!
.
I hope that you’ve enjoyed the Weekend Review, thanks for being here at Chartfreak with me!/
~ALEX
.
EDIT: These Weekend reports mainly cover the big picture and use weekly charts, but the day to day analysis can be found in the premium section Tuesday through Friday morning. I still cover the Markets as seen here, but when the set ups develop for trading or going long, I also include trade set ups in the daily weekday reports. If you think that this kind of analysis would compliment your trading, why not click on the ‘Sign up’ tab at the top of the page and try it out for a month. I have been expecting this pull back in the precious metals and we are looking forward to buying opportunities and bullish set ups that should present themselves when the dust settles, possibly right after the Fed meeting. Thanks for checking out the weekend report.
.
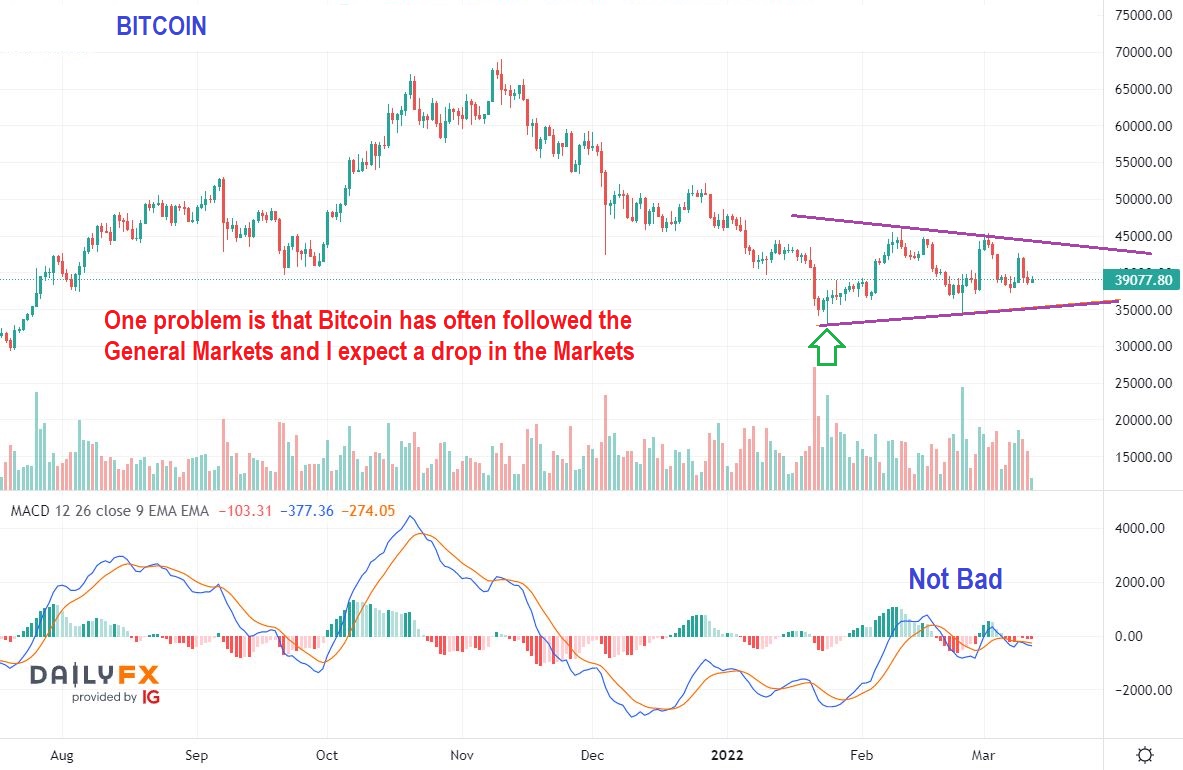
BITCOIN – This is not a bad set up ‘as is’, but the problem is that I expect lower price with the General Markets and Bitcoin often follows the General Markets . If it does NOT follow the General Markets lower and actually makes a higher low around day 60 in this triangle, this could be a bullish triangle for the next daily cycle to launch higher. The problem is that it hasn’t had follow through buying and we are on day 47.
1. We are running out of time for an upside rally to take place before a day 60 lows would be due.
2. Chopping sideways and putting in a higher low near day 60 is Bullish.
3. The problem is that Bitcoin also has too much time left if it breaks down with the markets or Fed Mtg. It could break below the lows and head for a deeper 60 day low.
4. Conclusion: Caution is recommended, and I am on the sidelines watching for a break out up or down. .