You are here: Home1 / Public
Lets review a couple of ideas that we discussed in the weekend report in our premium section.
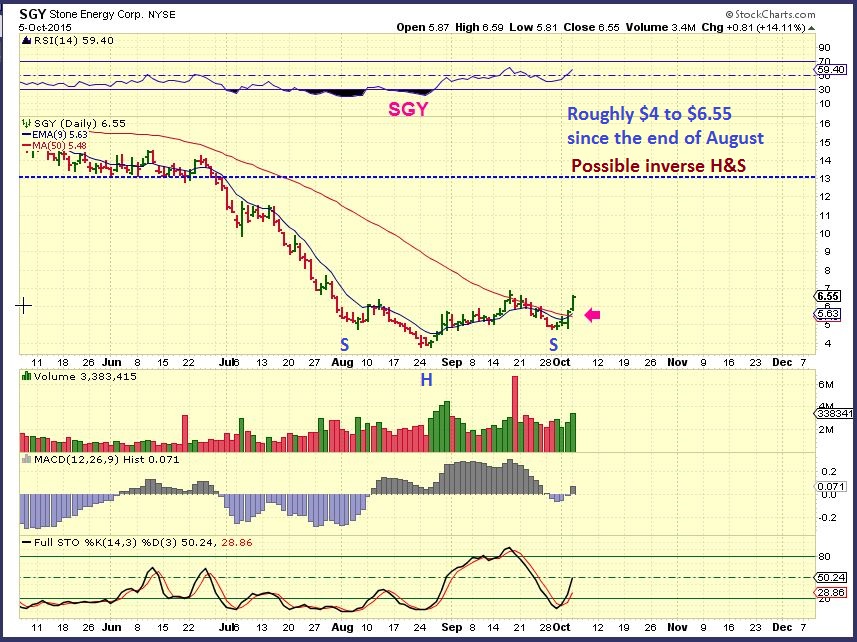
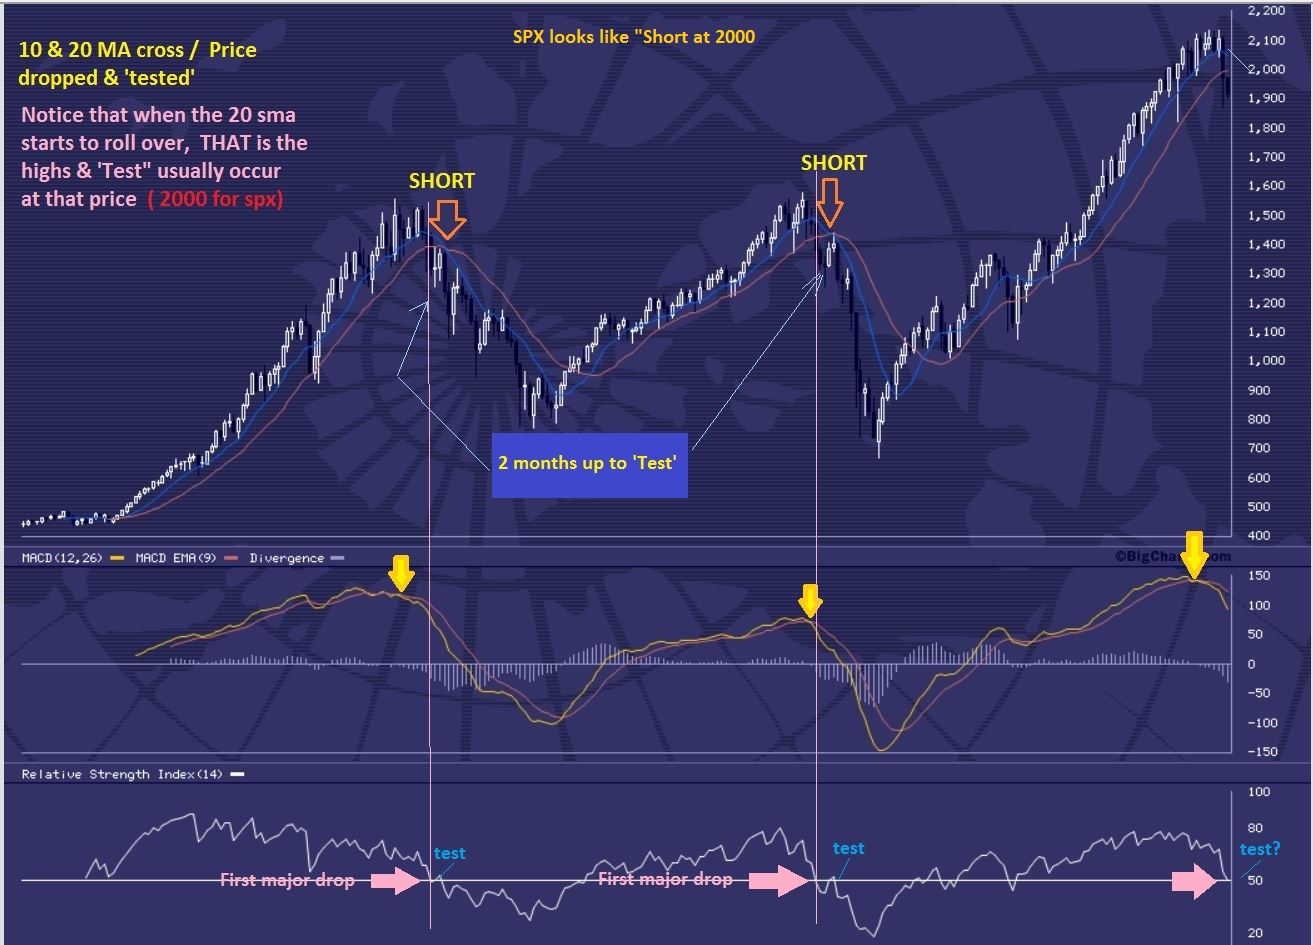
$USD - legitimate break out. This could have major implications for Gold, Commodities, and the markets.
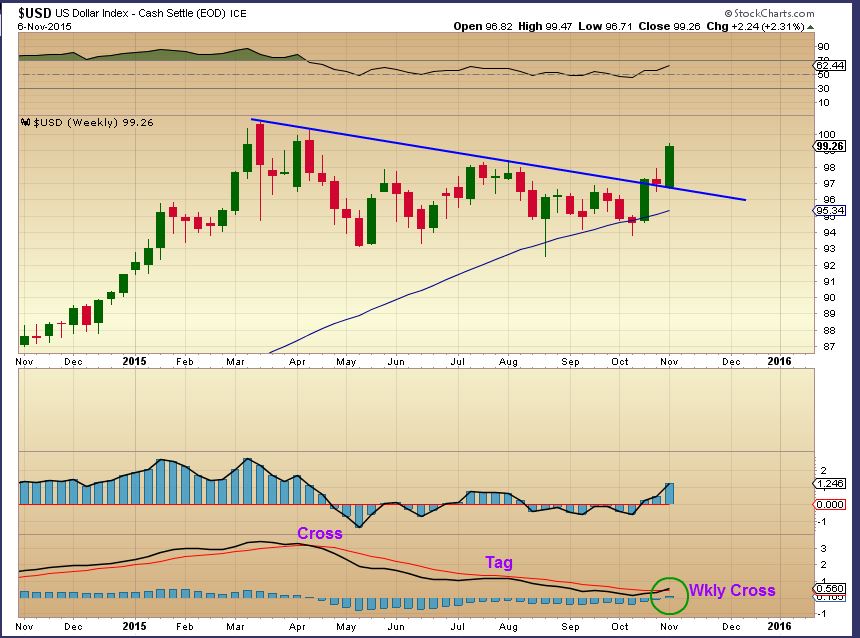
Lets look at the Dollar on a daily basis...
Read MoreI’ve been hearing a lot of talk about the NATGAS plunge. It has dropped roughly from $3.00 to $2.00 since May! It’s bouncing today , so I wanted to take a look at a couple of charts and point out to members in the premium report this morning what we have before us technically. I will share 3 of those charts here.
.
Starting with a close up. ( Note: This volume was erroneous and later adjusted at stockcharts).
NATGAS has basically finished a measured move. It also broke well below the Bollinger Band, so a bounce was to be expected. A buy for a trade maybe, but will the bounce put in a higher low or could it roll over like prior bounces? It would be good to know.
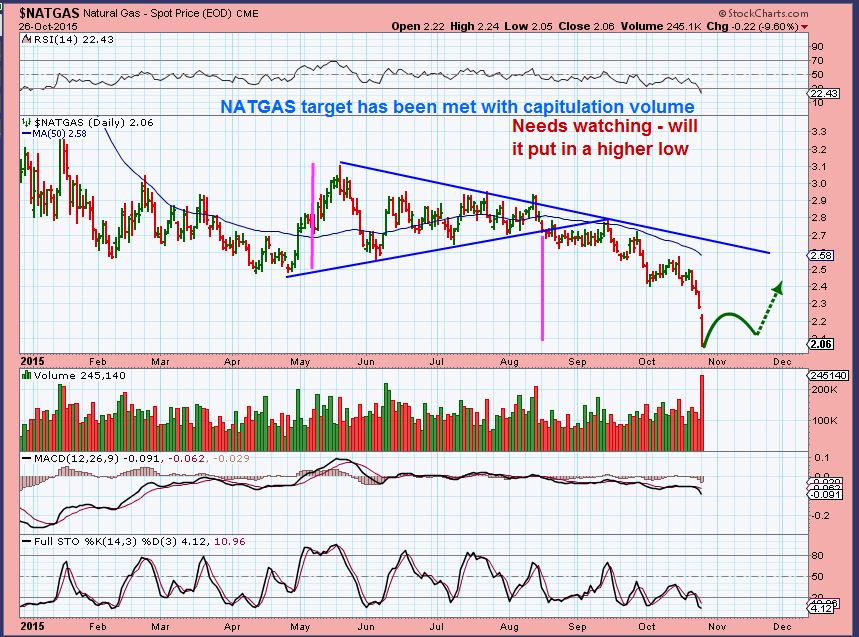
So stepping back, I see that a bounce to the wedge and another drop wouldn’t be out of the question. If I was trading this bounce, I would keep this chart in mind. Prior lows in 2012 were at $1.90. and the lower wedge trend line is around that area. Lets zoom back one more time.
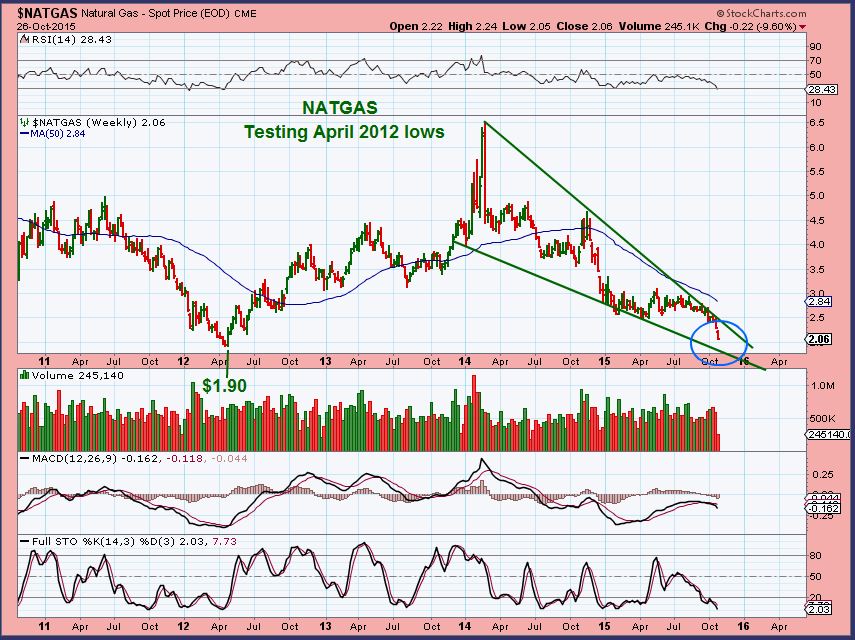
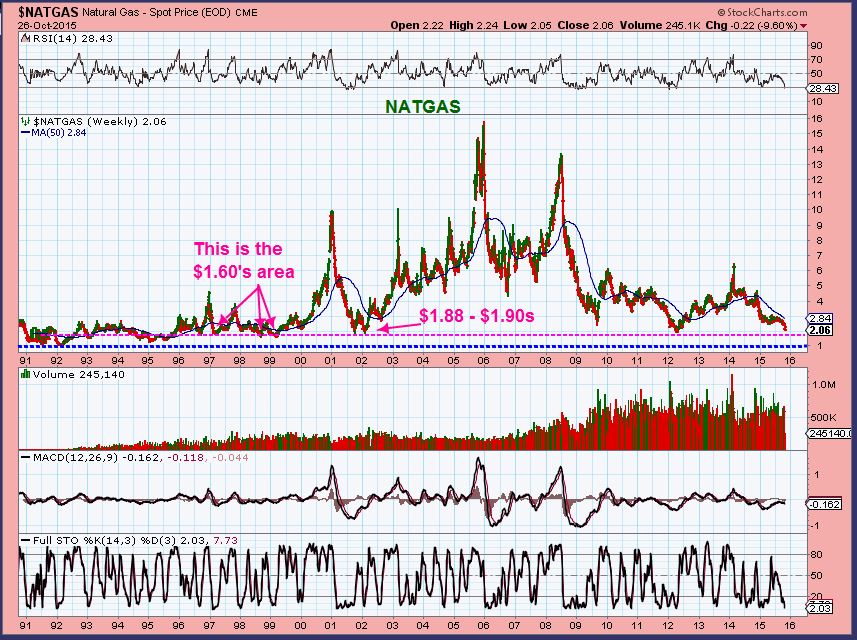
This chart shows that a prior Double Bottom Low in 2002 in the $1.88 area. That 2nd low on that double bottom was an undercut of $1.85, so we may see support in the $1.80’s and lower $1.90’s. $1.90’s since the 2012 lows were $1.90 shown in the chart above.
I am not trading NATGAS right now, but the bollinger band crash on Mondays daily chart was indicating that a bounce should follow shortly. Stepping back and looking at a couple of longer-term charts, we see that we either made higher lows here or there could be better support a little bit lower near $1.90. Double bottoms are common and sometimes they undercut recent lows with divergence.
I will be looking for that in the future and we may see another entry point if Natgas returns to its recent lows. If I was trading this bounce, and maybe you are, I would just keep the long term charts in mind and use a trailing stop or take profits with Fib Bounce #’s or whatever method you use to cash in on a trade. I would also keep in mind the crazy market activity that is often seen around FED WEDNESDAY and stay alert.
Happy trading 
~ALEX
Many sectors of the market look ready to break one way or the other. Can we gain an edge as to which way they will go, or is it just a coin toss? Lets take a closer look.
This was the NASDAQ at the close on Monday. It was pushing against resistance in various forms.
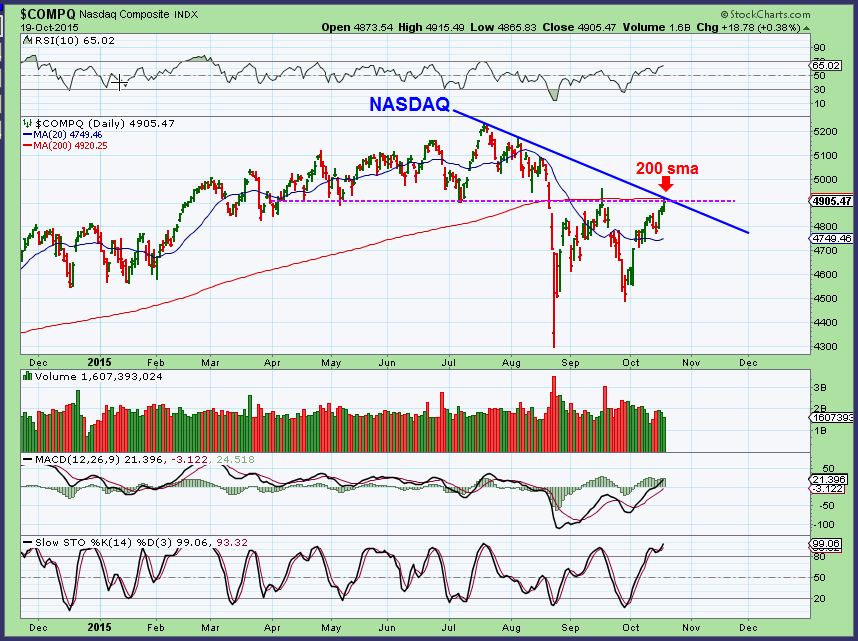
Notice what seems to have showed up by the close today...
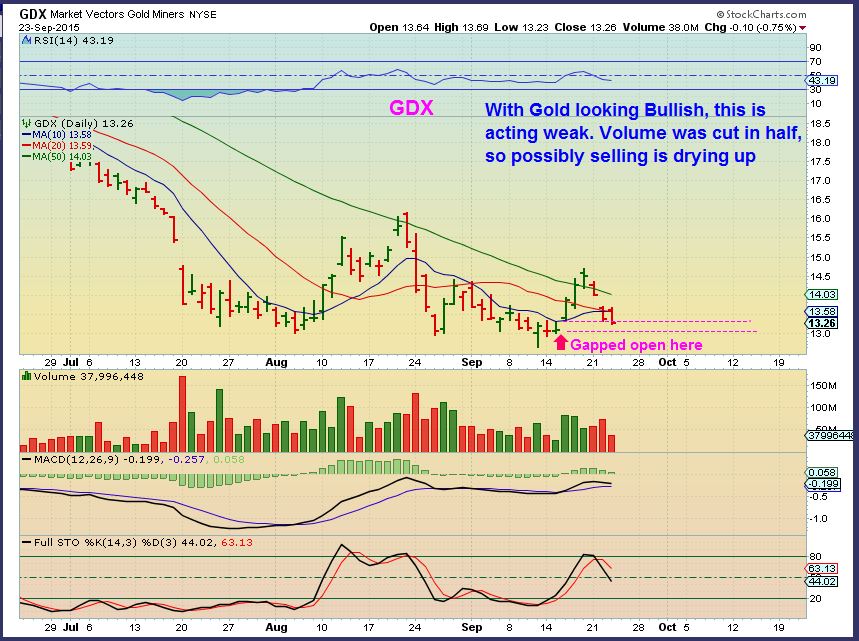
Read MoreHave you been trading Gold, Silver, or maybe some of the Miners recently? They have been quite volatile lately, with many good traders being stopped out and frustrated. I was recently stopped out last week, when some miners did a false break higher above their 50sma, only to turn down and close below the 50sma again.
That may cause some to wonder, “Is this a trap?” and “Why does this keep happening?” Others outright scream, “Bear market rally is over, down we go and soon! Go short!” Since anything could happen, I wanted to look at some charts.
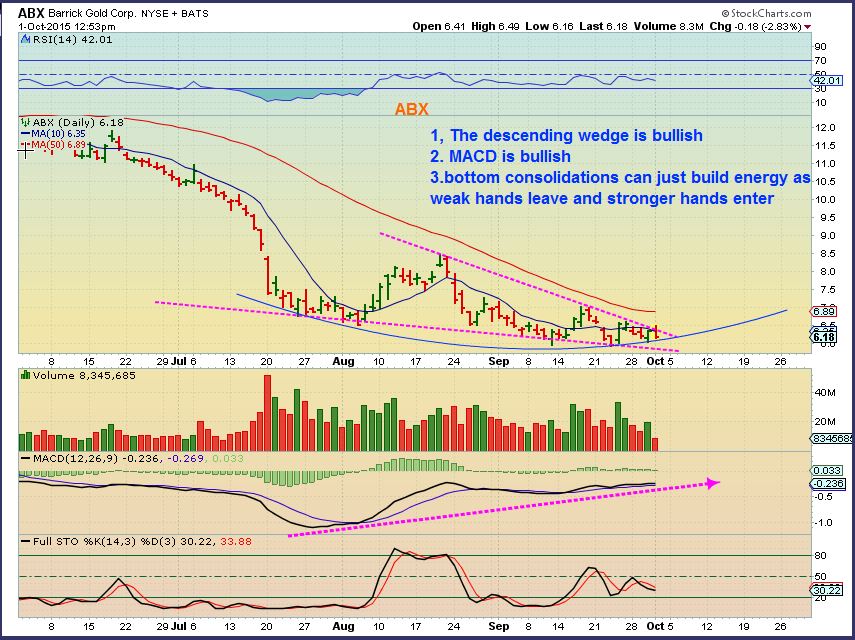
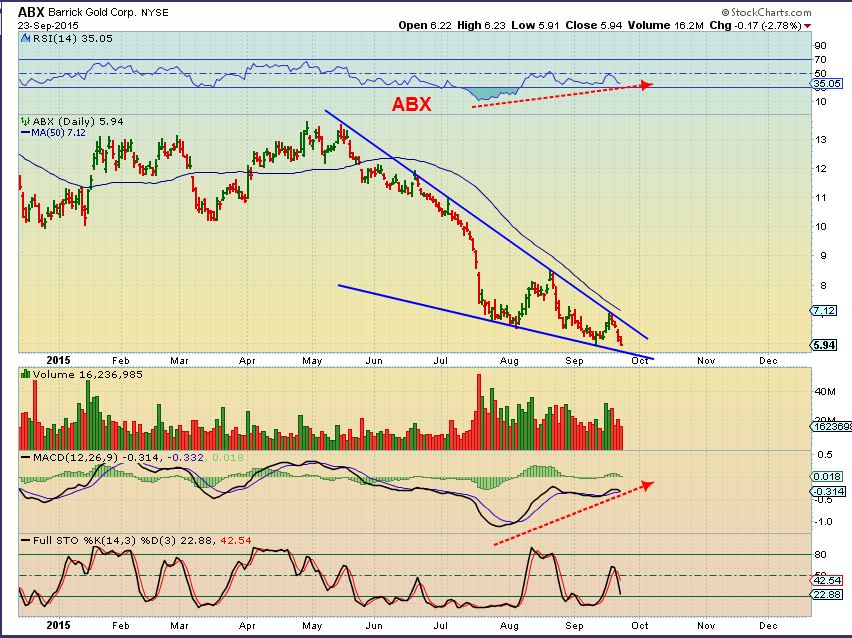
ABX – Sure this could break down, but its actually sporting a bullish descending wedge, a rising MACD, and isnt it possible that we are just looking at a bottoming process?
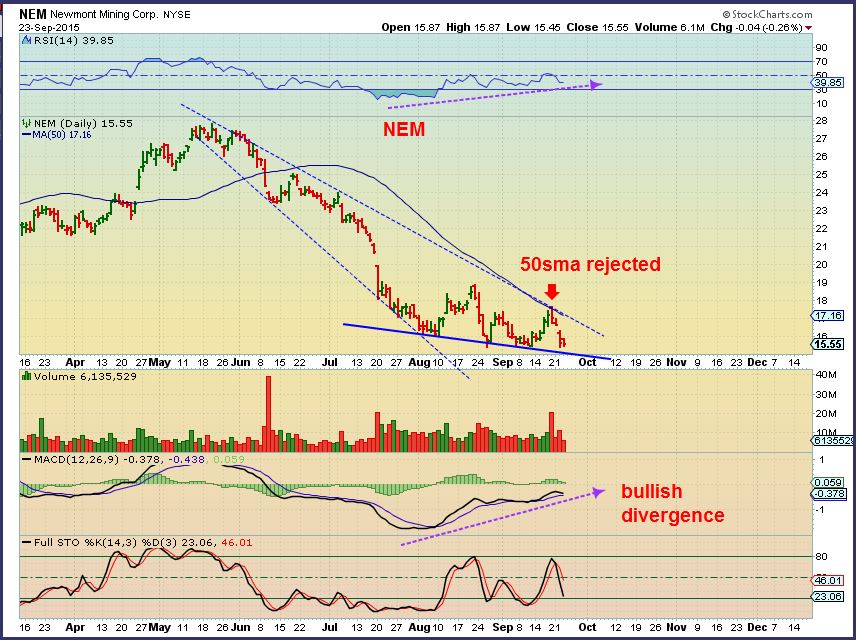
NEM – It is struggling for sure, but is it basing out or ready to break down? It actually looks like a base is building with that divergence in the MACD & RSI. This could be building energy for a break above the 50sma.
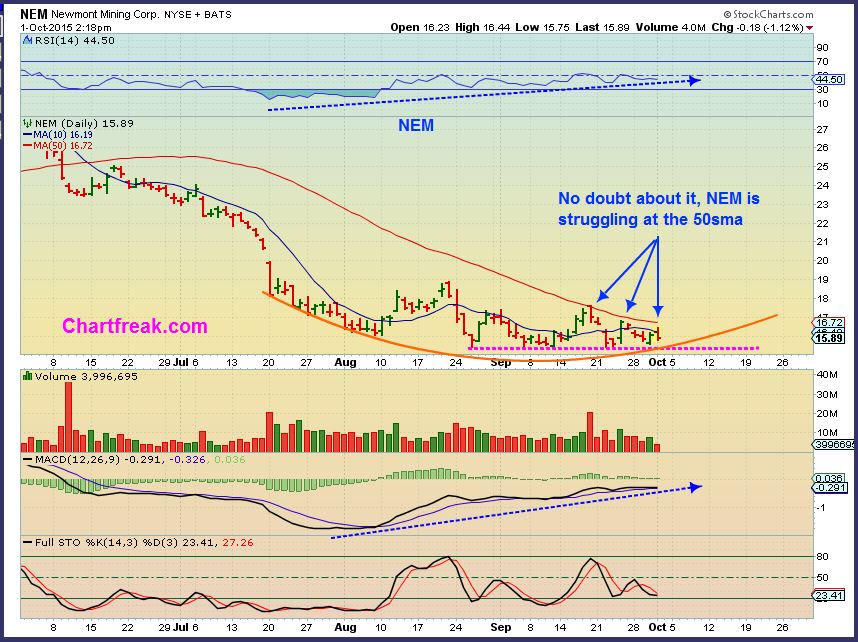
I am writing because I do hear many people saying to short the miners for a big drop coming. At this point, I look at ABX and NEM and I see the possibility of an upside pop soon. ABX and NEM are major components of GDX, so if you were thinking of going short , I would say to stay away from JDST and DUST until the true direction of the Metals and Miners presents itself clearly.
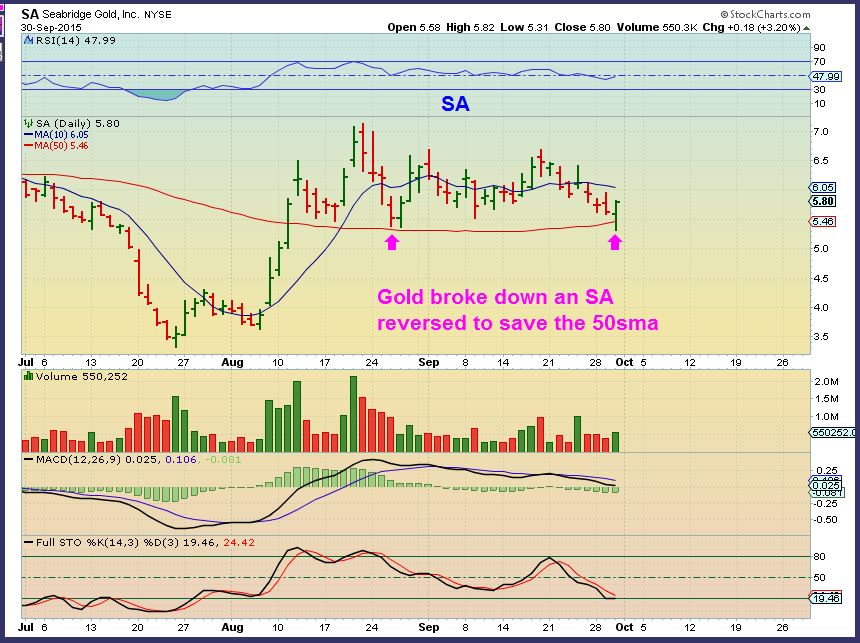
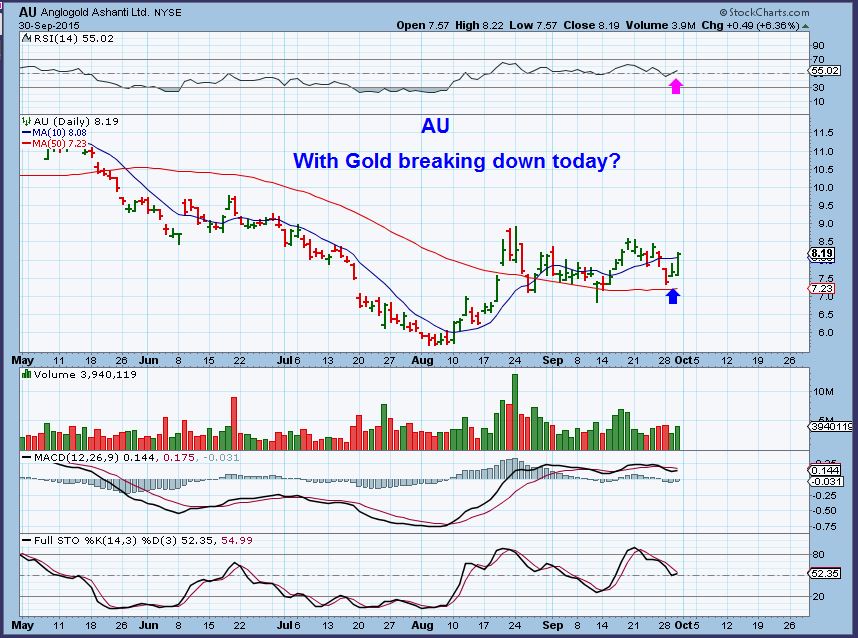
Consider this: Not all Miners are at recent lows and ready to fall apart. Take a look at the following charts. These had their lows back in July and are currently holding onto gains. Was this reversal just a stop run?
This was yesterday when Gold was down $15
SO I am watching a number of things , including cycles and other clues to shape my view of what may be going on in the precious metals markets. I will also cover more in the premium report Friday morning. Care to join u for a month? Thanks for being here.
~ALEX
Consider a membership at the Chartfreak…it’s just $95 for three months.
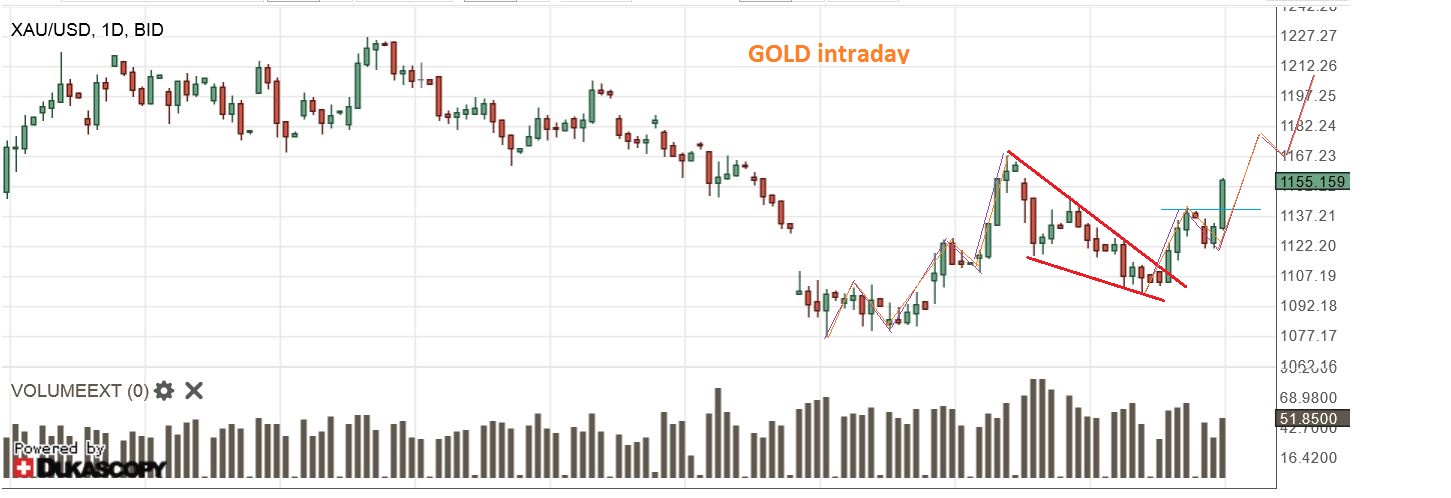
Yes, Gold is jumping, but we’ve seen that before, right? The question is , ” Will it make it to it’s intended target, or land flat and flounder around like a (gold) Fish out of water?” Here at Chartfreak, we have been waiting for this next leg higher. Lets review some of the charts from recent premium reports…
GOLD,SILVER,& MINERS
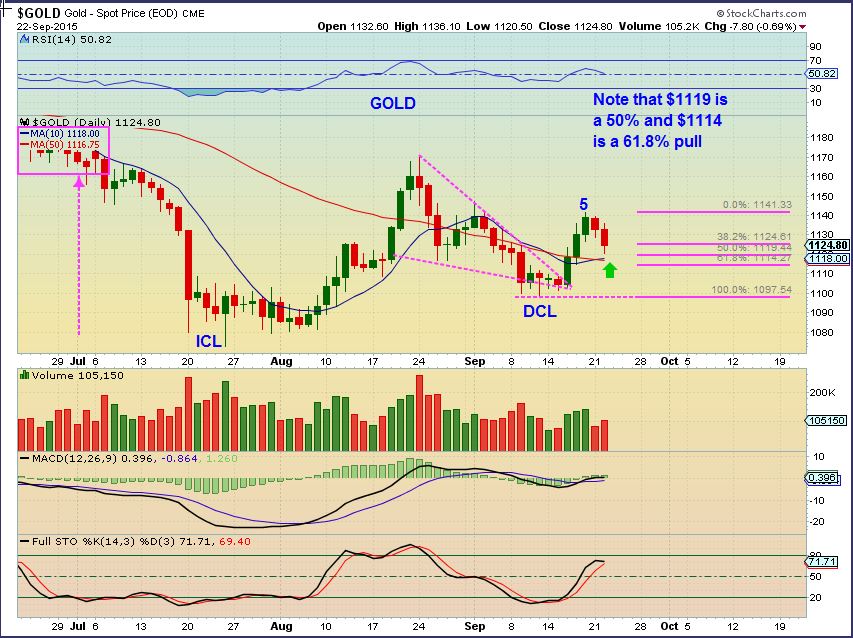
GOLD SEPT 22 – Looks great on day 7. The first run up went from $1072 to $1169. It could pull back even further and still look very Bullish, but it doesn’t have to. We are in our second daily cycle and I expect that Gold could run to at least $1200. We will monitor it along the way.
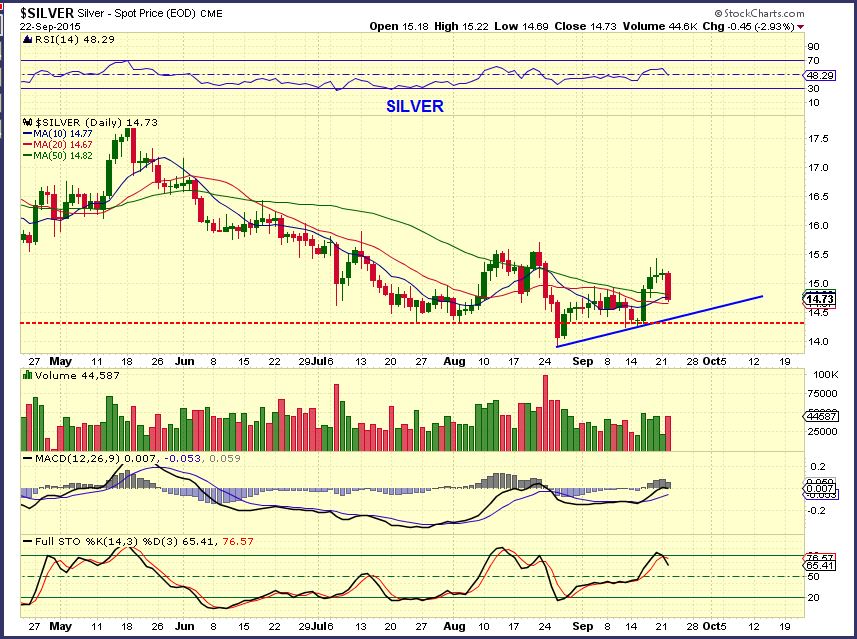
Silver – pretty big 1 day drop, but it has not moved down with Gold on the last 2 days, so it is not a broken chart by any means. Notice similar 1 day drops in July and August that had no follow through. I wanted to see those moving averages hold, and I am also watching the trend lines drawn.
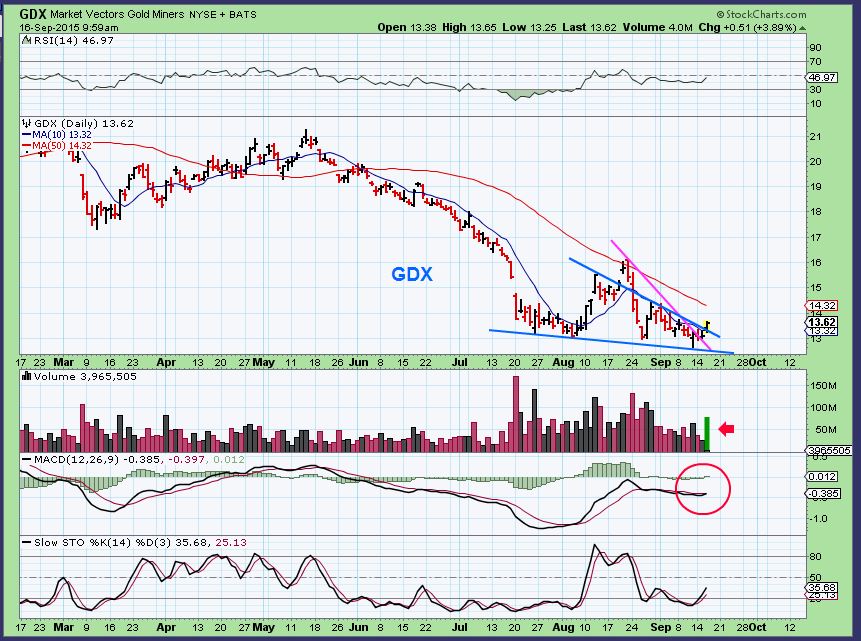
GDX – Yes, GDX fell more than I expected. I was looking for the 10 SMA to possibly hold as support. The chart is not broken and I’ll show you why…
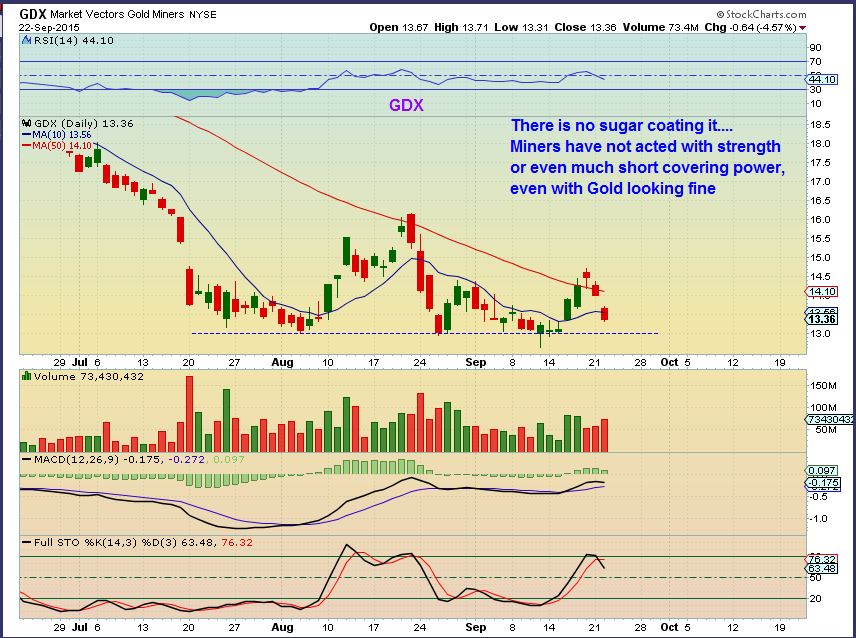
GDX (2)– Looking back at last Nov-Dec when we were dropping into a 2nd daily cycle (RED ARROW) . We took off and curled back down to the lows again ( 2nd red arrow) before a nice blast off higher into January. We could be seeing that here, thats why I say the chart is not broken.
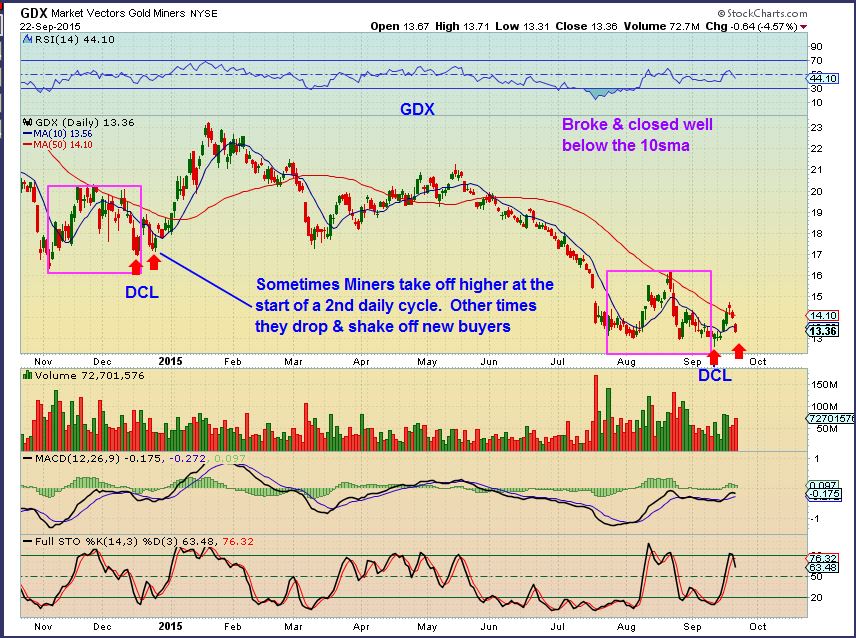
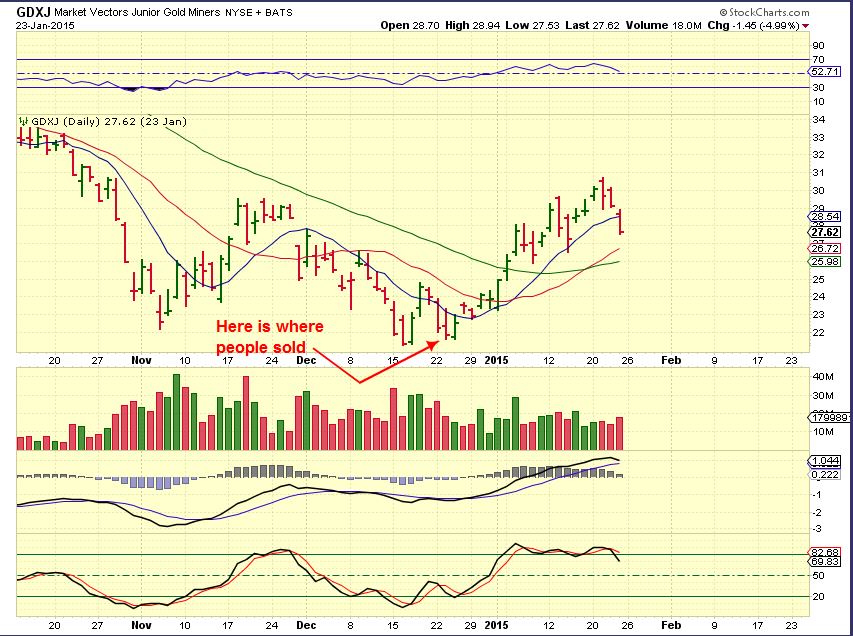
Some were not happy with the action in GDX (understandably) , so As a reminder , I posted this in last nights premium report.
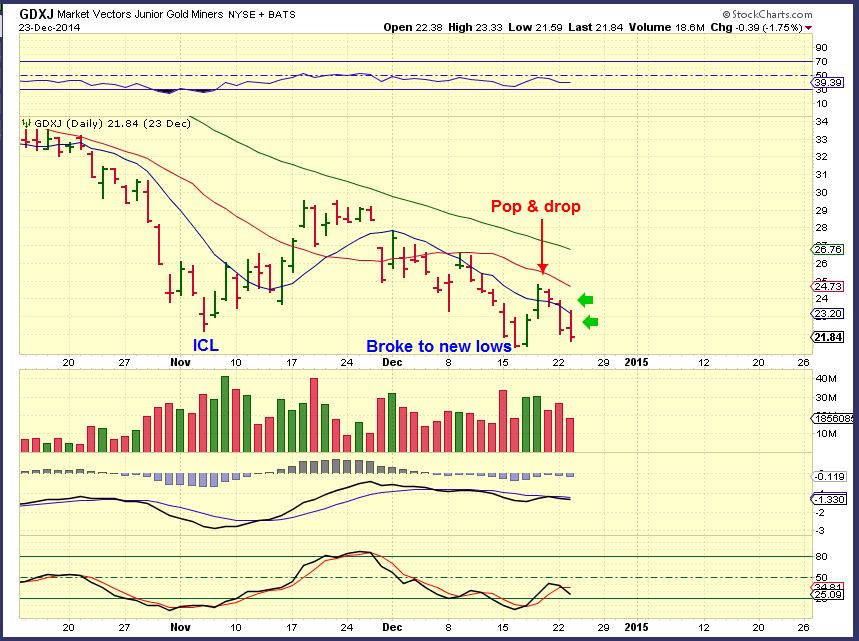
Here is a close up of that period last Dec 2014. GDXJ popped and dropped to shake out weak hands. This looked exactly like what we were seeing now. Compare these 2 charts below together. The 1st is last Dec and the 2nd is today. Twins.
. 
What happened next? This is the same chart of last December as the anticipated run started. The red arrow points to where the first chart above ended.
Conclusion: We were in the 2nd daily cycle and a rally should begin soon unless something is very wrong. I also looked at the 2 charts below and declared them bullish, to further the case for a bullish move in the near future. They are larger components of GDX. Bullish descending wedges.
Today we have this (Click to isolate)
GDX 2 hrs into trading
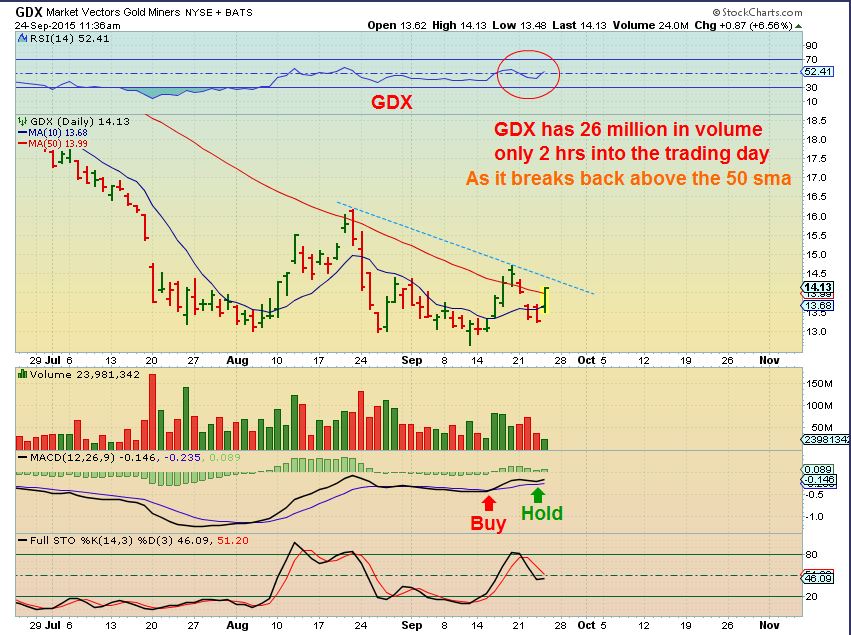
I have been calling for another leg up, but many were growing weary (understandable with that GDX drop) . The above analysis was designed to help my readers to see the possibility and likelihood of the coming move higher. We saw dips like that before, right before a rally. It’s time to go shopping friends. Find your favorite Miners and gather a basket, start small if you have your doubts. Were you confidently expecting a move higher in Gold? Do you still have doubts? Though we saw weakness in Miners, we were still expecting a move higher in Gold , and we were watching for the Miners to get on board. Today we are seeing positive follow through.
I will be covering some set ups in future premium reports, and also navigating this move forward, since I believe we have started the next leg higher. Why not try a 1 month sign up? Thanks for being here!
~ALEX
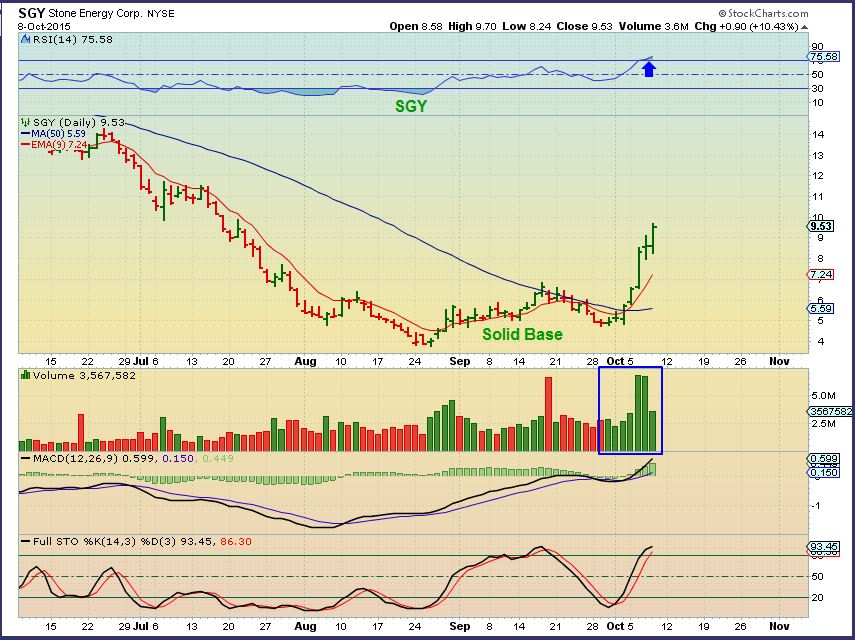
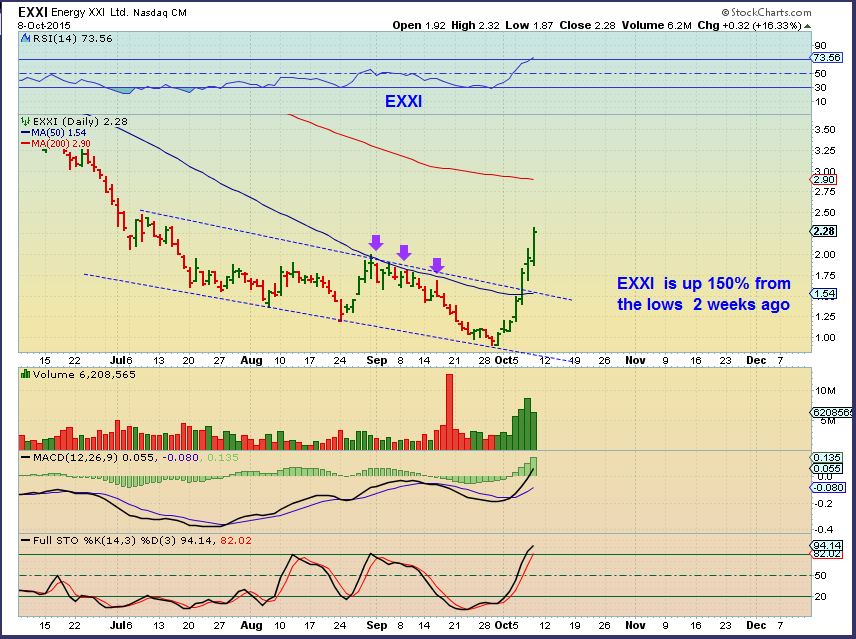
Earlier this week I certainly thought that the markets were waiting for the Fed Decision on Thursday before making any big moves. Yesterday, Oil, Energy, and Precious Metals jumped the gun and were off and running!
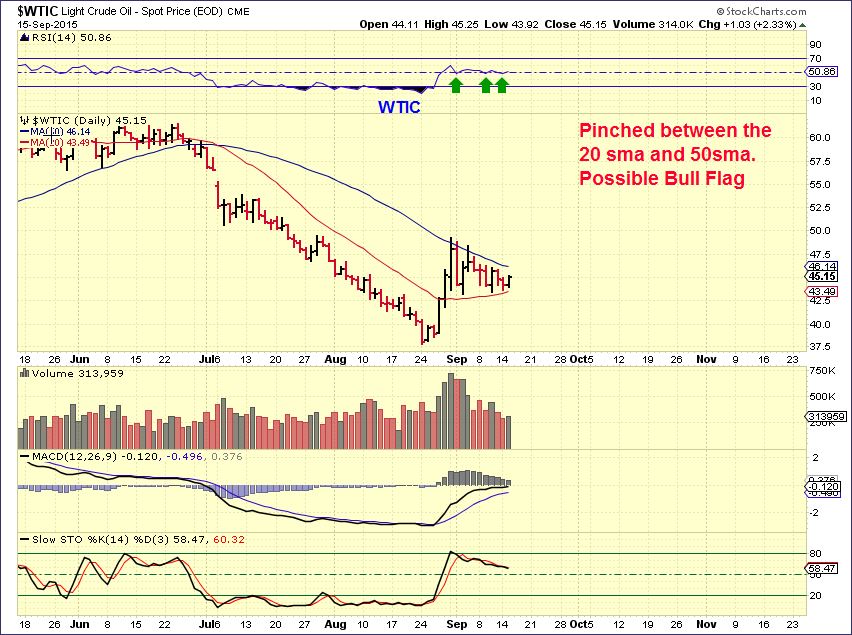
WTIC – The set up was a Bull Flag pinched between support & resistance.
Oil is not waiting for the Fed Mtg. Many energy stocks were up over 10% and some were 15-25% today alone.
I mentioned in a premium weekly report when the markets first crashed that in the past, bear markets dropped and rallied and dropped and rallied. A back test would be likely, as shown. Honestly – we are not quite at that level yet.
I want to point out a weekly chart of the 2000 Top. There were drops and rallies drops and rallies. We have dropped and rallied in the past 2 months too.
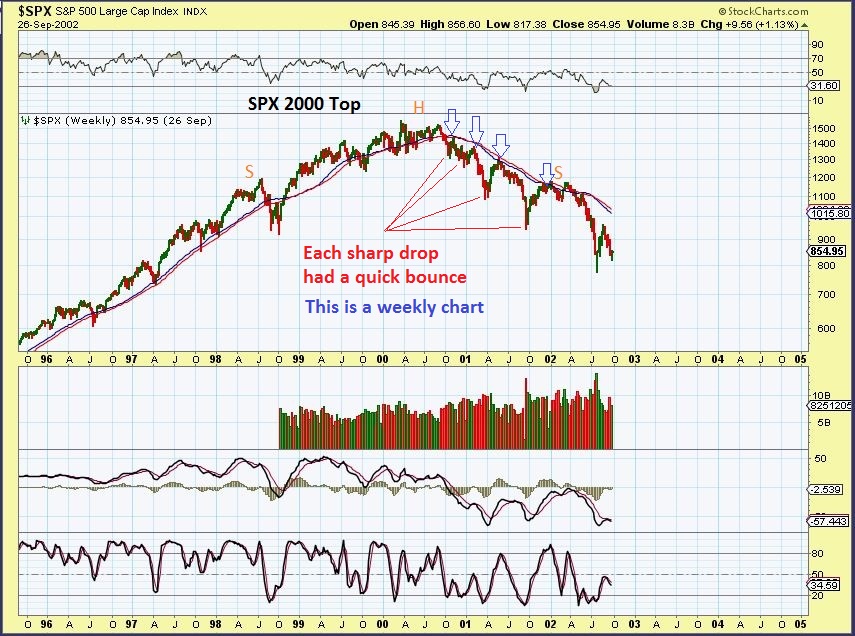
Could we be ready for a Fed induced drop? On a Monthly chart the ‘back test’ is not in place yet, but we can drop here & rally again later.
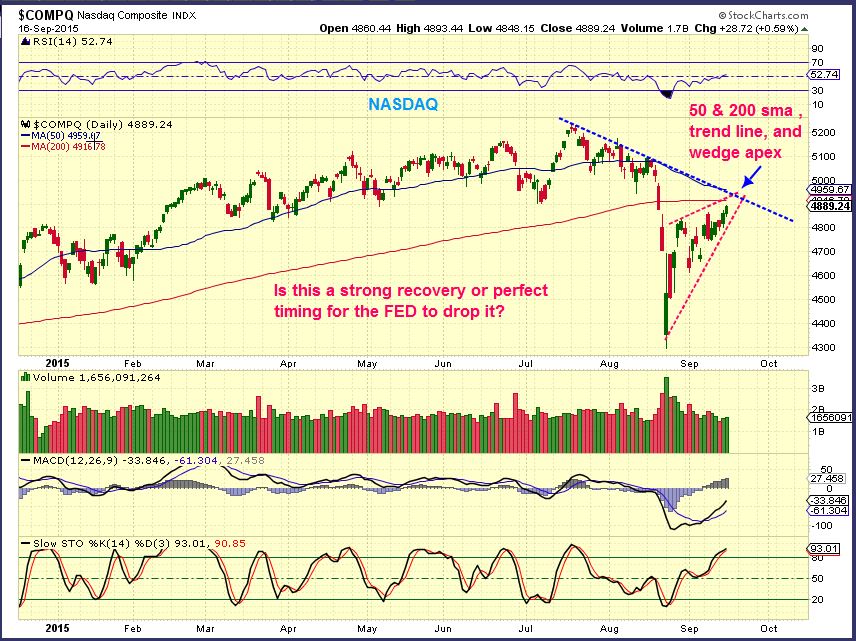
NASDAQ – I just wanted to point out this rally. It looks like a bearish rising wedge at this point, with overhead resistance in various forms.
GOLD and MINERS
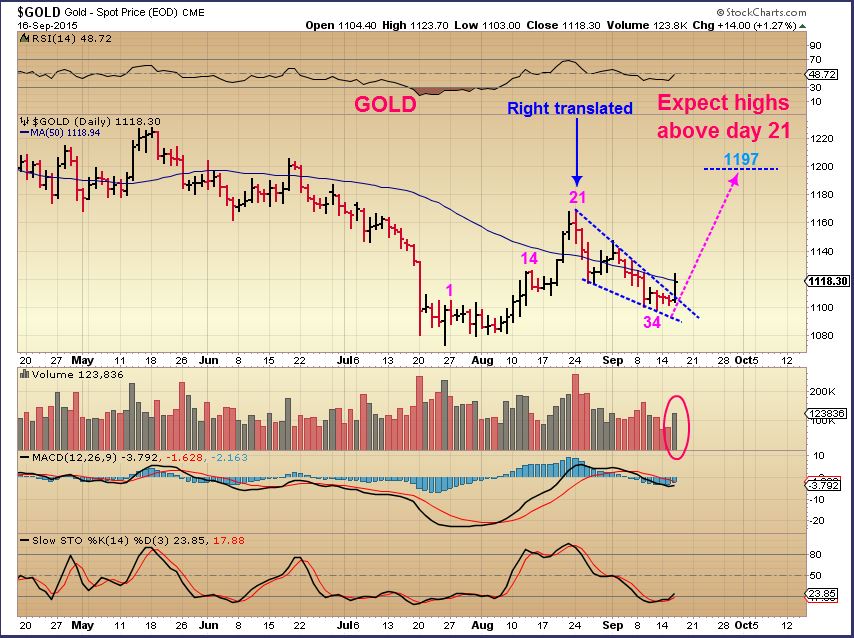
GOLD – The chart in yesterdays report pointed out the # needed to have a swing low in place. Above $1111.90 puts a swing in.
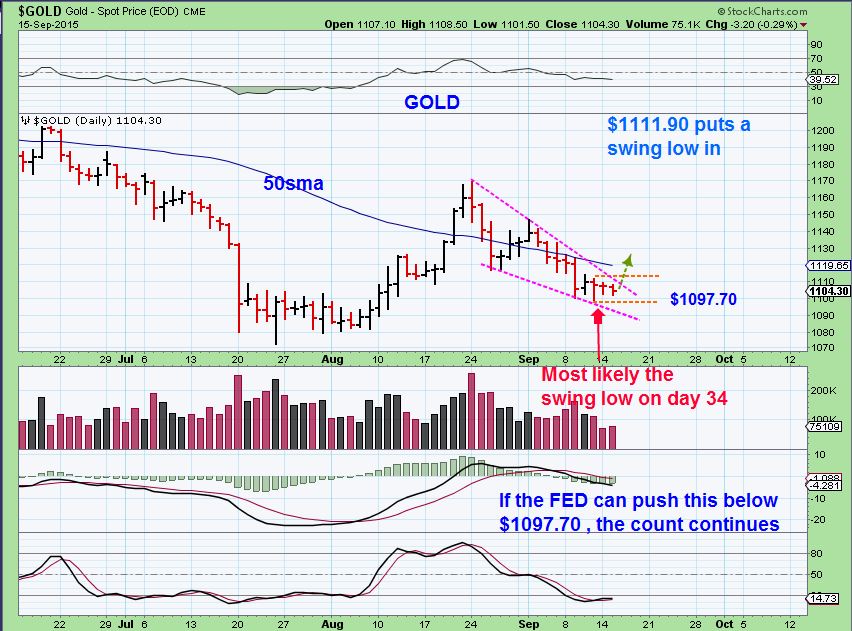
We certainly got that today. A swing low is in place on day 34. That was a right translated first daily cycle, so we can expect higher highs! We broke from a descending wedge and I consider this a buy. My initial target is near $1200 .
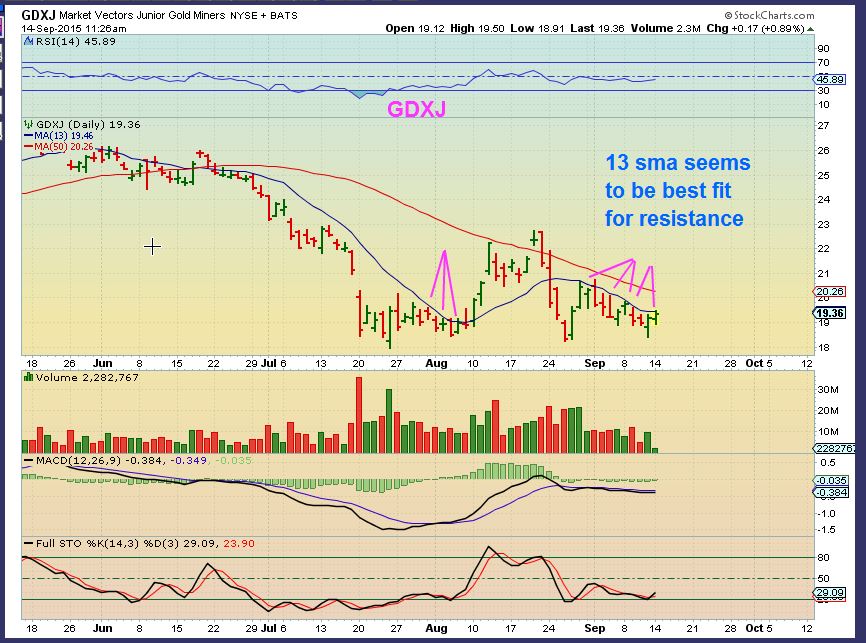
I have pointed out that a break above the 10sma ( and a close there) is a safer area to take a position in GDX. With GDXJ I used the 13sma.
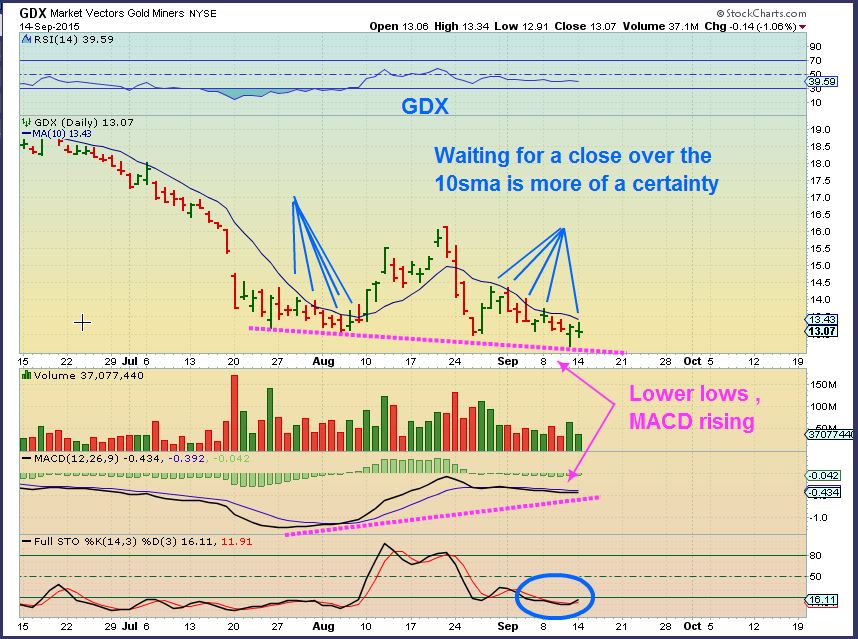
I had expected Miners to wait until after the Fed decision too, but timing was late in the daily cycle and everything just popped all at once. I posted at 10a.m. that volume was likely going to be above 70 million ( by the close) as we broke from the wedge.
GDX – This was my 10 a.m. (yesterday in premium section) chart pointing out the volume to look for if the move was real.
While you wait you can look at DNN (uranium) . That’s a good looking stock set up. See also GTE and UPL – those looks like a buy right now ( Energy). XCO was up 30% (AGAIN!). To see the potential in some of these juniors, check out a 3 month chart of AXU, EGI, & GSS .
Good luck today
NOTE: It’s just $37 for over 20 reports and some 100 setup’s each and every month! If you’re serious about learning and trading, then come try it out. See: http://www.chartfreak.com/my-secrets/
~ALEX
I'm sorry if you came here hoping to hear an opinion on the FED EX company. I am actually here to point out that I am expecting some strong movements later this week as a result of the FED EXPECTATIONS. Some are expecting an interest rate hike and others are expecting no change. So far we are seeing a sideways move in most markets leading up to that big day this Thursday. I wanted to share some charts that were in my recent weekend report. They may help us to anticipate the reaction after Thursday. Lets look at charts.
.
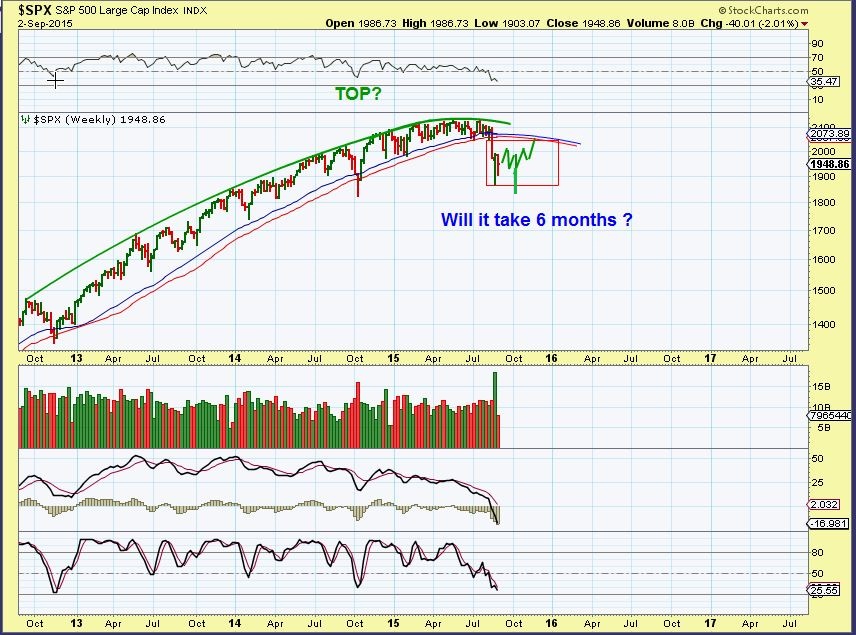
SEPT 2 - I pointed out the topping action in the markets last Spring & early Summer. After the initial drop, it should likely lead us to expect volatility, possibly even sideways for a long period of time. We have that now.
I want to point out what I am looking for next...
Read More
WTIC- Another slow motion sideways move, but this looks like a Bull Flag that wants to break higher. Will it before the FED Decision? Maybe.
Read More The following are a few of the charts I’ve posted in recent Premium section of the website. I believe we may be seeing a major shift in the markets and the recipients of future money flow just may surprise many. Hint: They have been targeted on the short side for many months and in some cases, even years. Here are a few things pointed out in a recent reports.
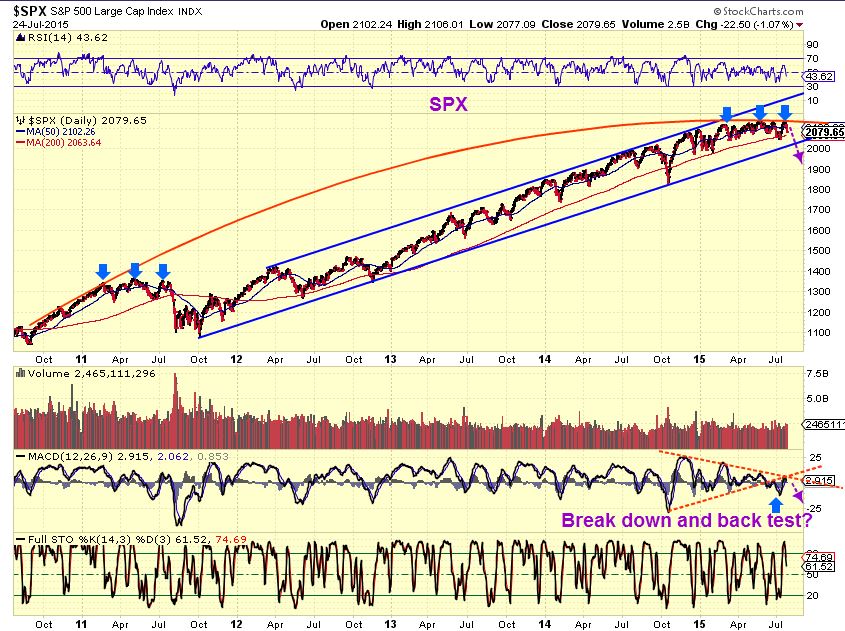
SPX JULY 24 – I have been pointing out a topping process. Watch for a drop.
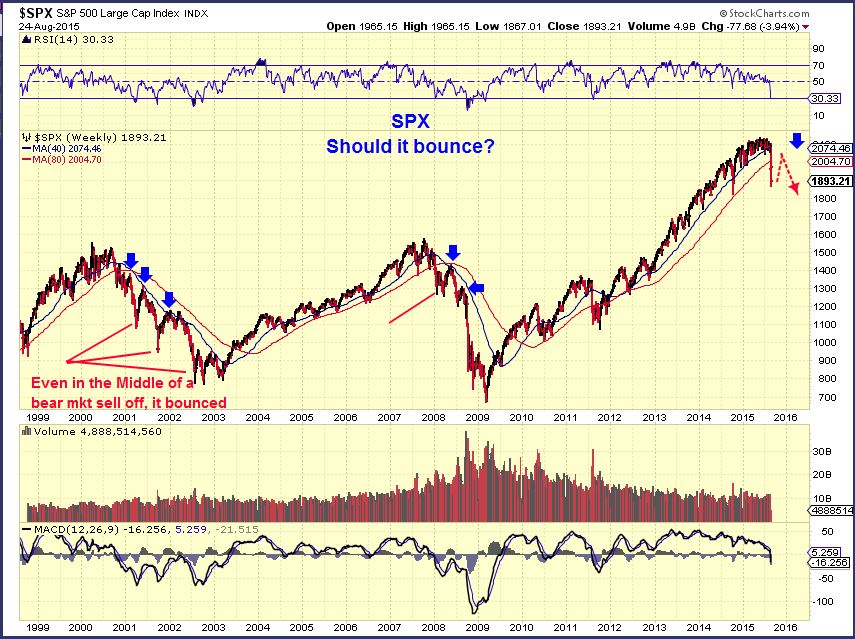
AUG 24– I did not recommend going short after the first drop, it is often better to wait for a bounce. Tops are a process . Look at the tops of the year 2000 & 2007 below. It took months to complete a top and even then, after each drop, a solid bounce can be seen (Blue arrows).
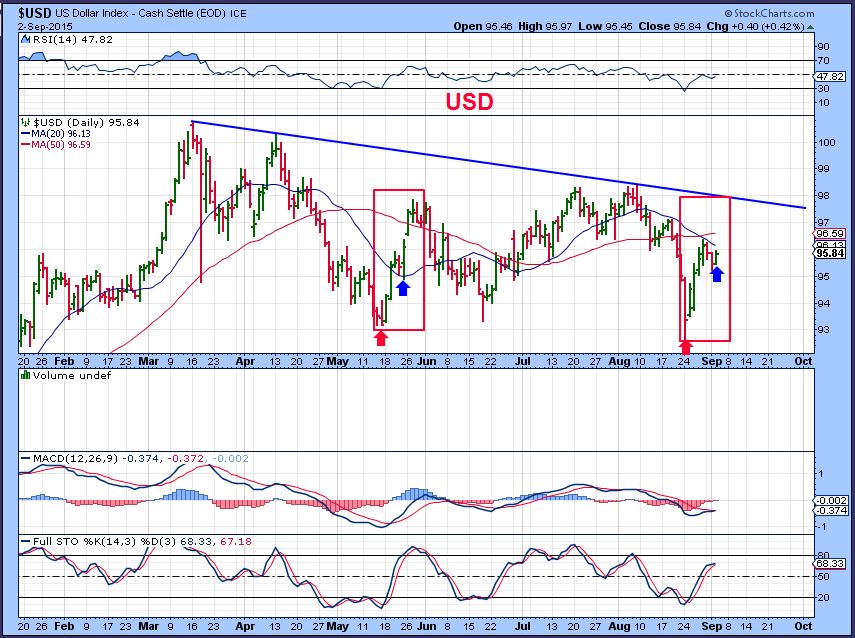
The weekly USD looks pretty strong. We saw a reversal off of the 38.2% Fib line (Amazing, huh?). I have said that I see weakness short term for weeks now . Was that drop all there was to it?
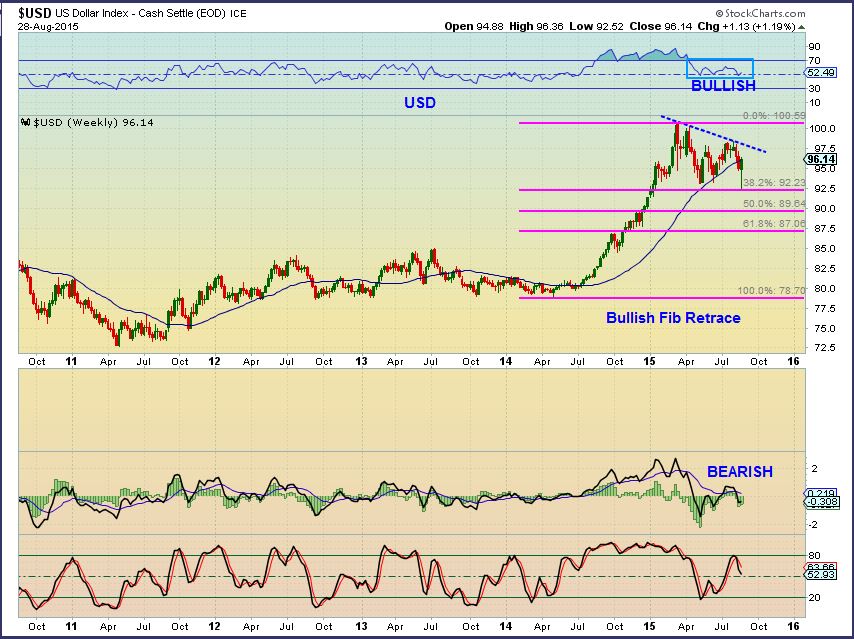
USD DAILY – I actually still see weakness within the rally, just like I saw in the MAY rally that rolled over. We could hot 97 , but I think that would be it for this rally. Commodities are also possibly indicating that the dollars rally is just a bounce.
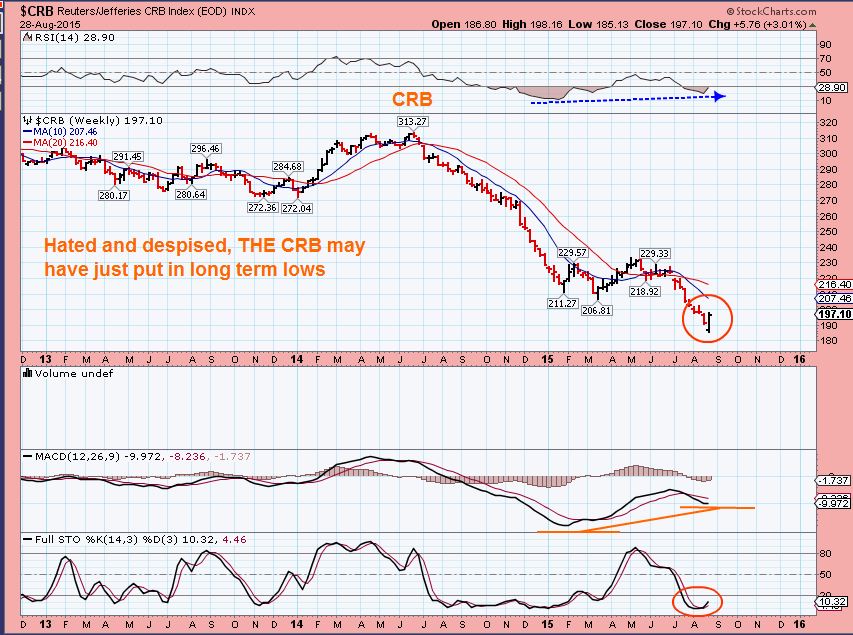
CRB – Rising with the dollar this week. Bullish Engulfing at the lows. Strong divergence on the weekly chart. These lows should hold for several weeks (possibly being THE commodities low).
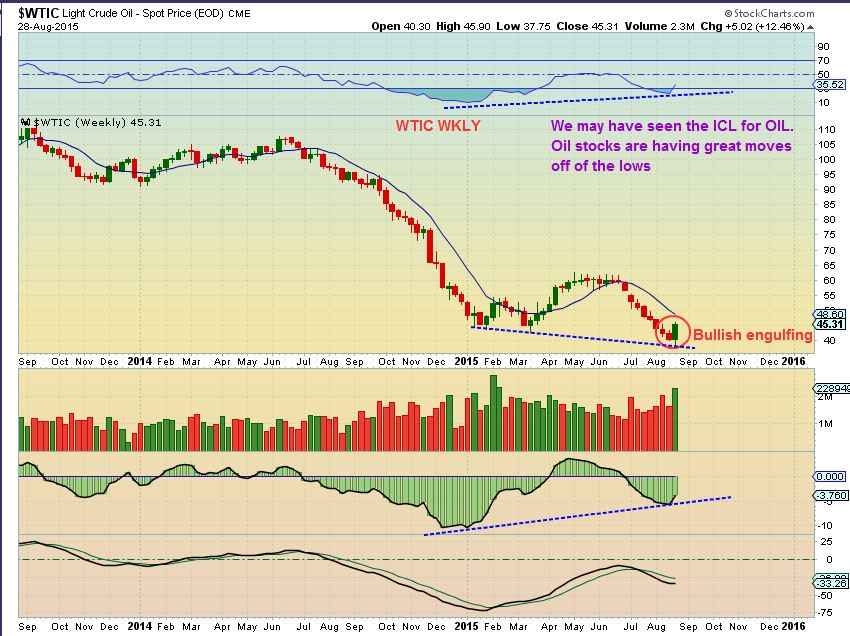
WTIC WKLY – BULLISH Engulfing Candle at the low. Strong buy last week, I.M.O. I see weeks of higher price from this low.
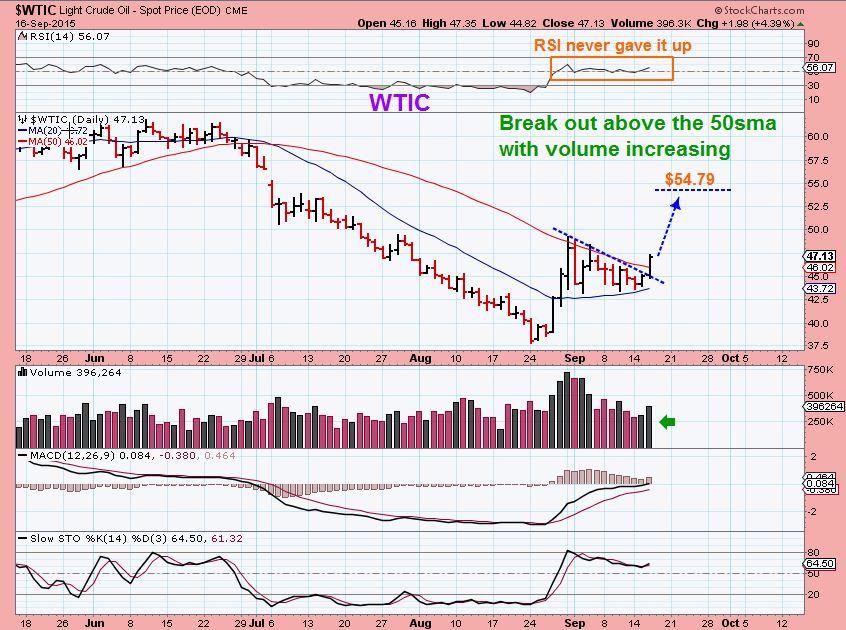
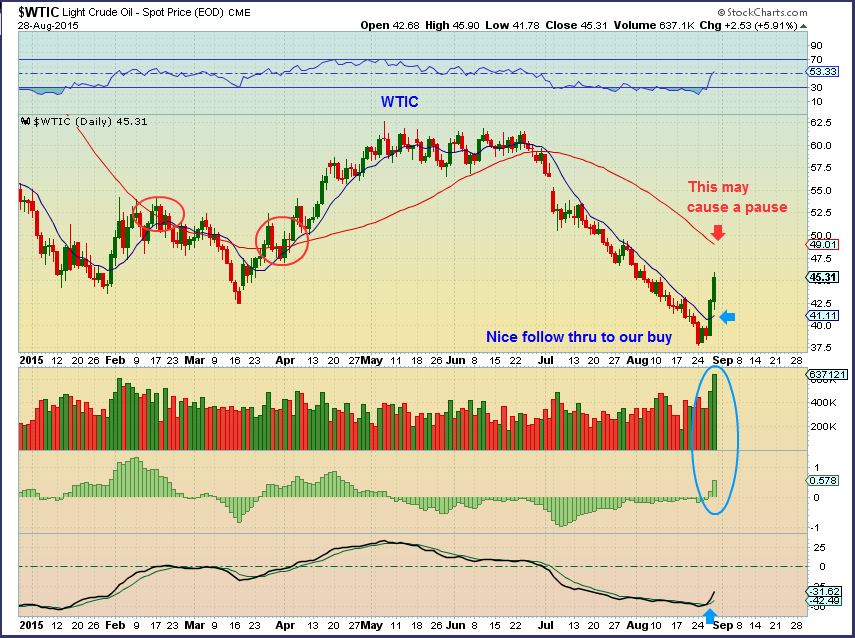
WTIC DAILY – I called Aug 27 the FAT PITCH in my recent report, a ‘buy’ on OIL & ENERGY STOCKS. For oil, the 50sma could cause a temporary pullback, a buying opportunity. That has happened this week. Soon we should move generally higher for weeks.
GOLD,SILVER, & MINERS
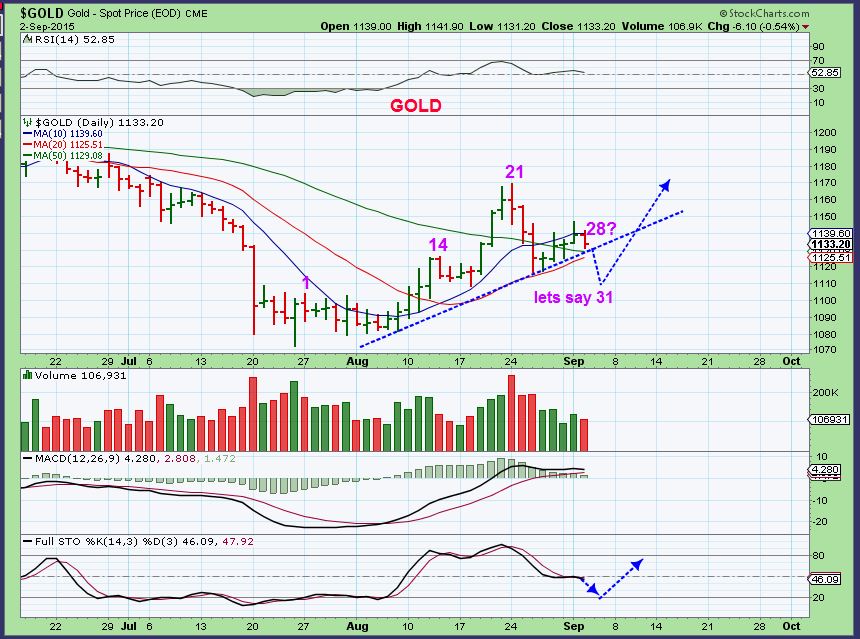
This is the Gold charts cycle count. On day 28 it is due for a daily cycle low anytime now. Even a drop to $1109 does not damage the chart. We should then rally higher.
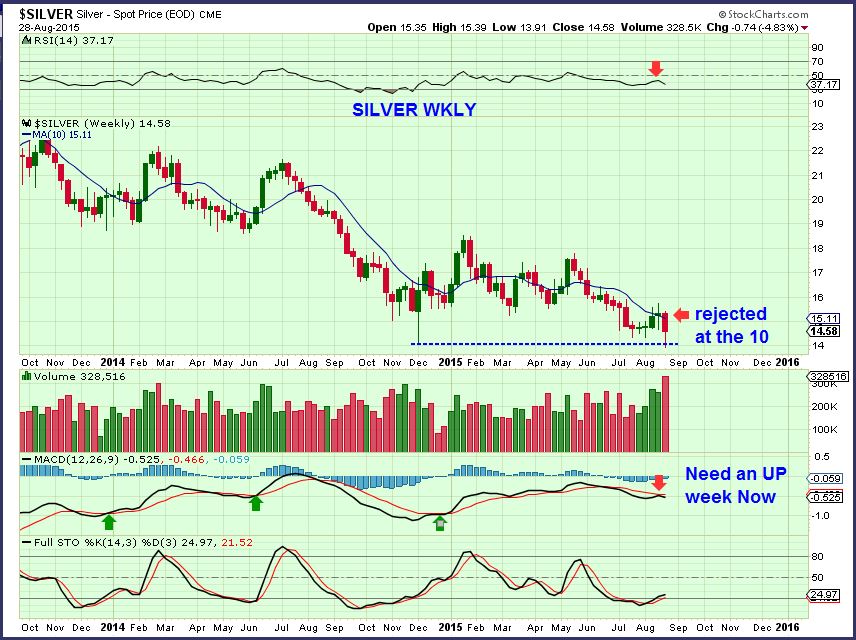
Silver weekly – It is a bullish reversal of sorts. It could be a high volume capitulation type stop run, that would be great. We need further improvement this week. I am watching this carefully.
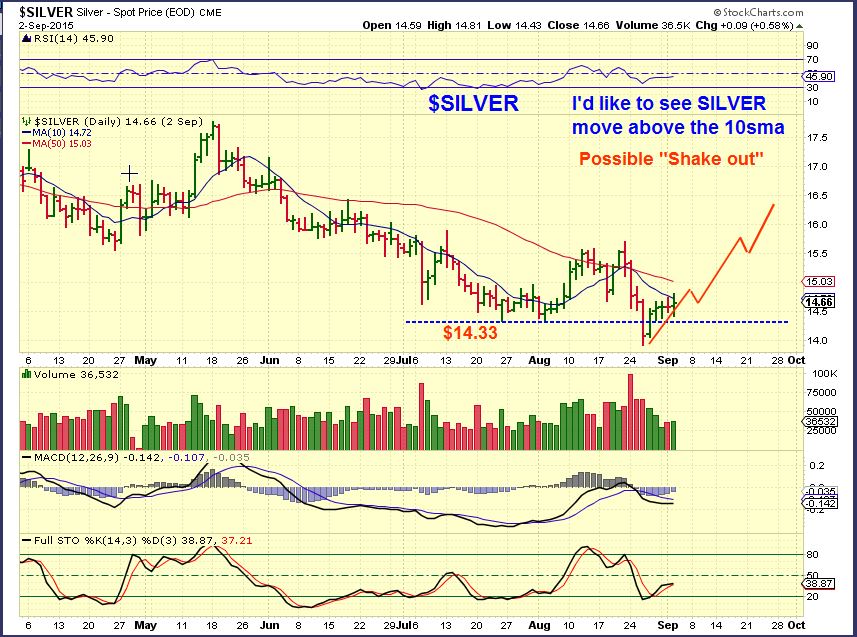
SILVER DAILY – Sept 2 , A Shake out may have taken place and so far we are moving higher.
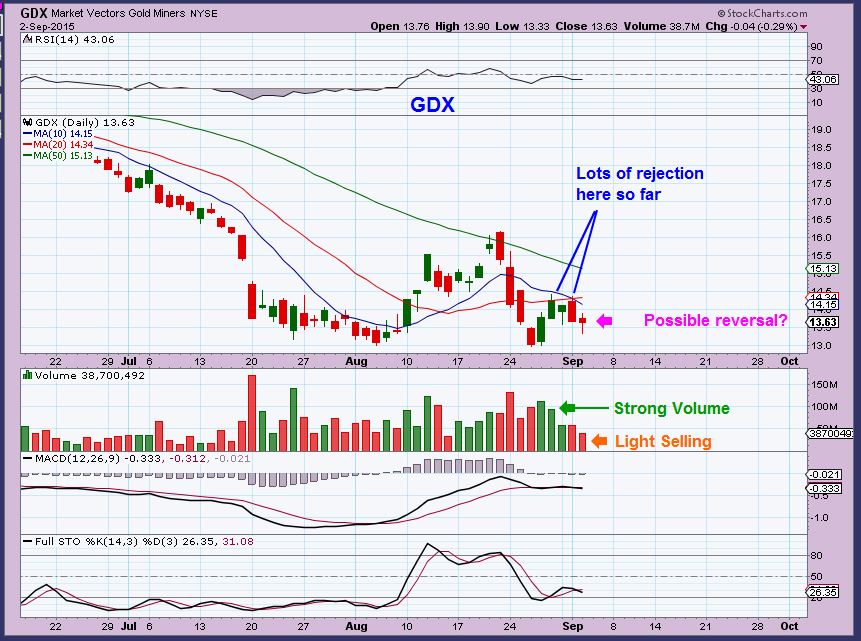
GDX – We see a struggle at the 10sma, but I expect that we will break & close above it soo
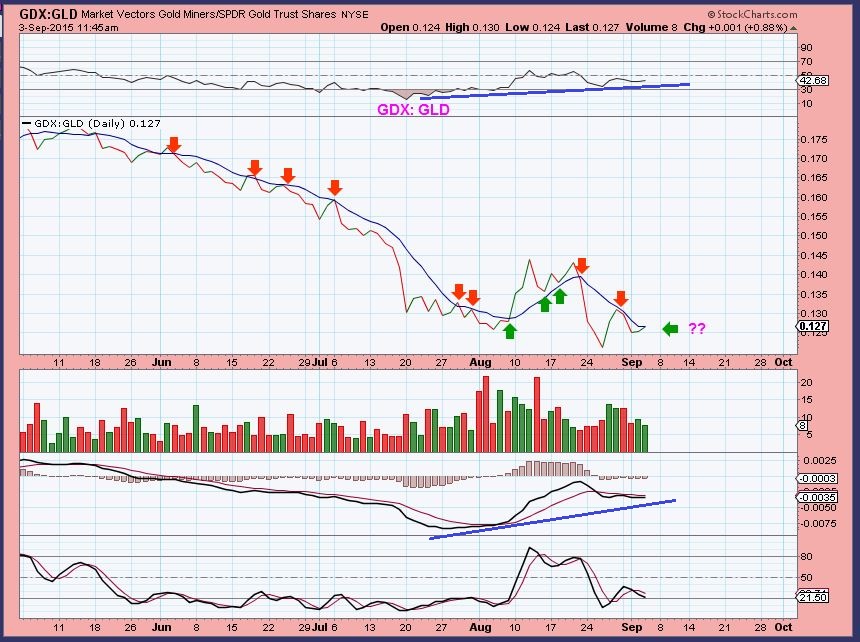
GDX:GLD is heading in the right direction. Another buy soon if miners continue to out perform.
Conclusion:
SO I am cautious about what is happening in the broad markets. We are seeing a bounce higher, but buyers may get washed out soon. These are volatile markets and we may be setting up a longer term short.
I like what I see on the weekly charts with GOLD, SILVER, MINERS, The CRB ,OIL, & ENERGY STOCKS. They have recently turned bullish. I mentioned in past reports the bullish set ups developing in ACI, BTU, AKS, BOOM, X, FCX, VALE, MDR . With OIL AND ENERGY I also pointed out many that are also moving nicely higher. Some energy stocks are up 100% already.
Here at Chartfreak I am watching the various set ups and offering opportunities to buy the pullbacks at low risk entries. I will include a few of the charts that I used in recent reports. For a low monthly or quarterly price, you can get reports like the above report 4 or 5 times a week. Thanks for being here.
~ALEX
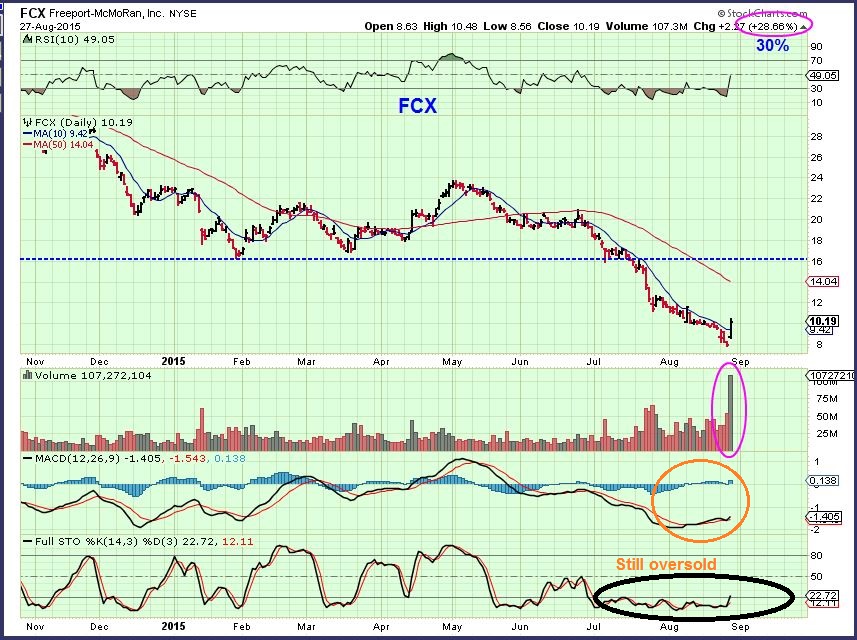
FCX – Buy the reversal. Strong volume and above the 10sma.
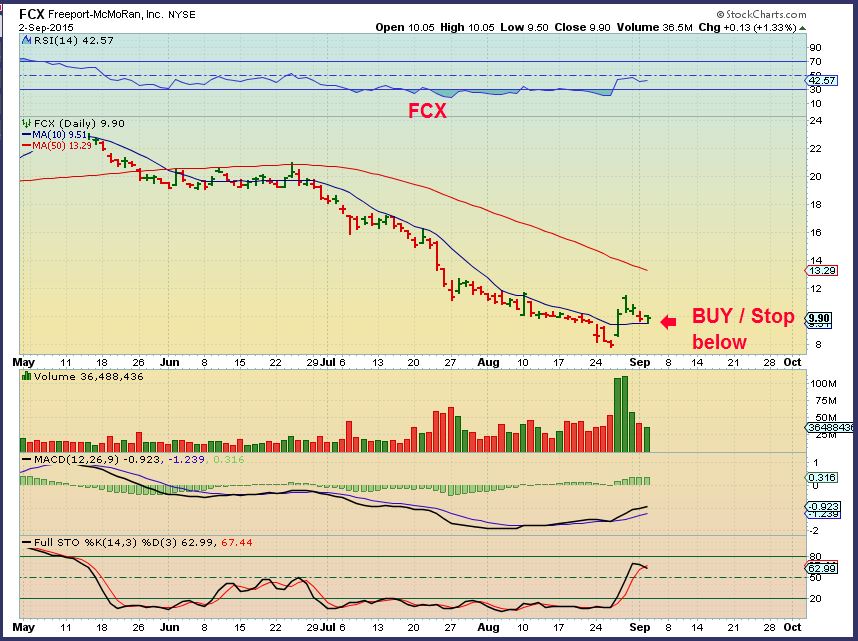
FCX – Low risk entry, stop below the support.
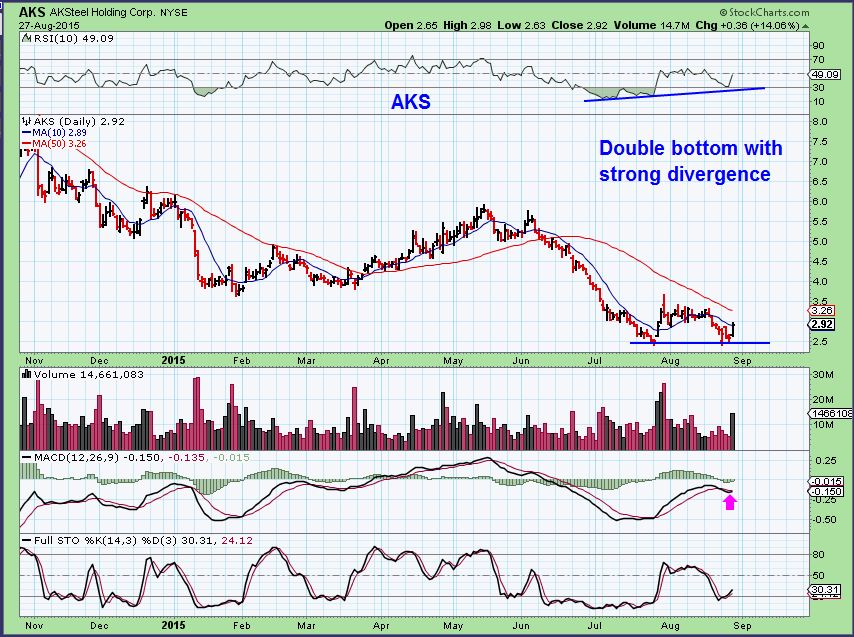
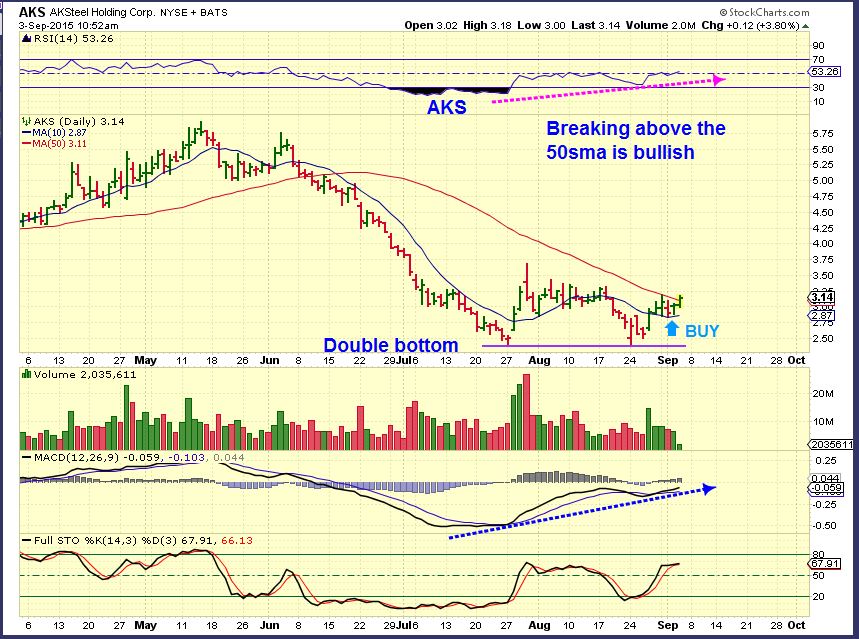
AKS – Low risk buy of a double bottom.
AKS today – This is still a good set up, support held.
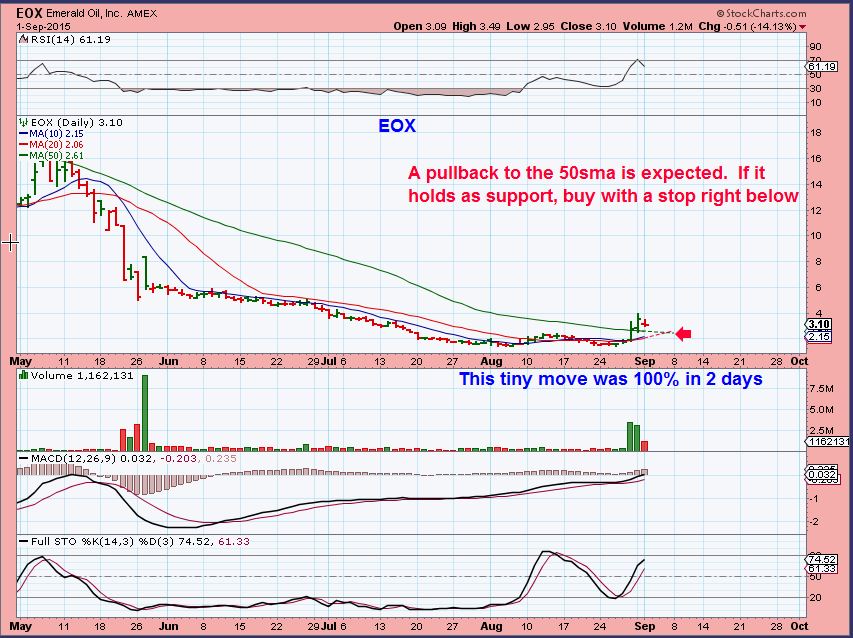
EOX – Sept 1 , this stock is spit adjusted, but it popped almost 100% in 2 days.
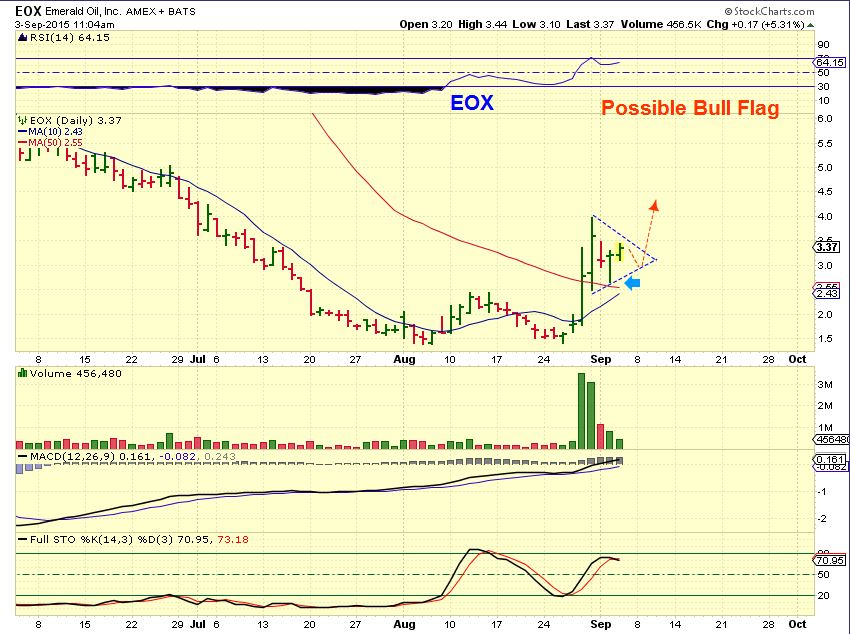
EOX Currently – possible bull flag forming or just a move higher.
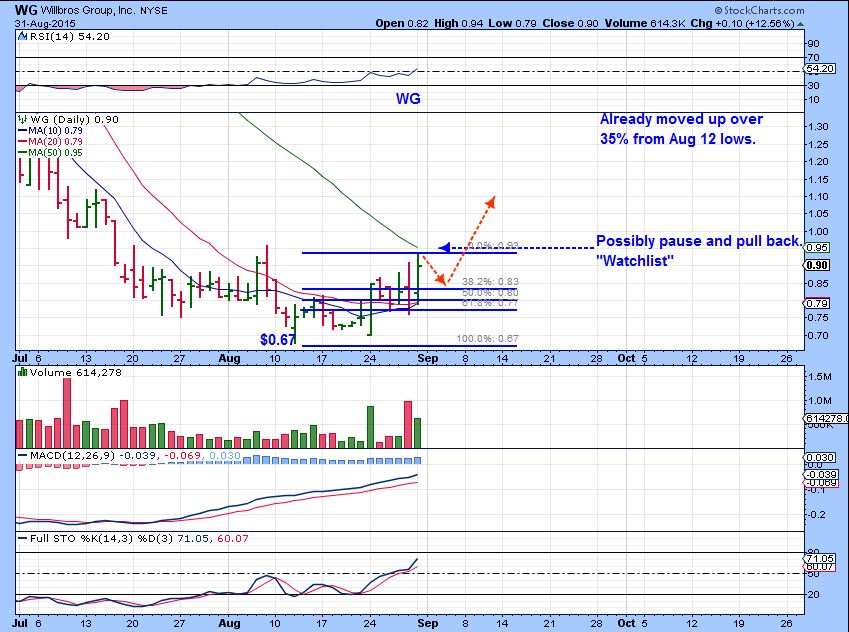
WG– Some Energy stocks trading under $1 have formed long bases. I liked this set up.
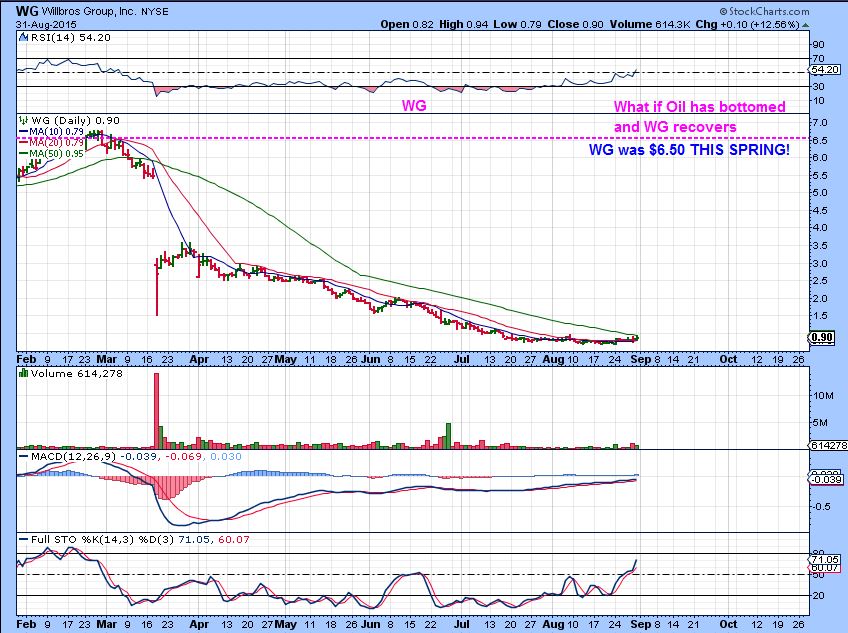
WG– Trading at only $0.90 , it was showing signs of life, already up 35%
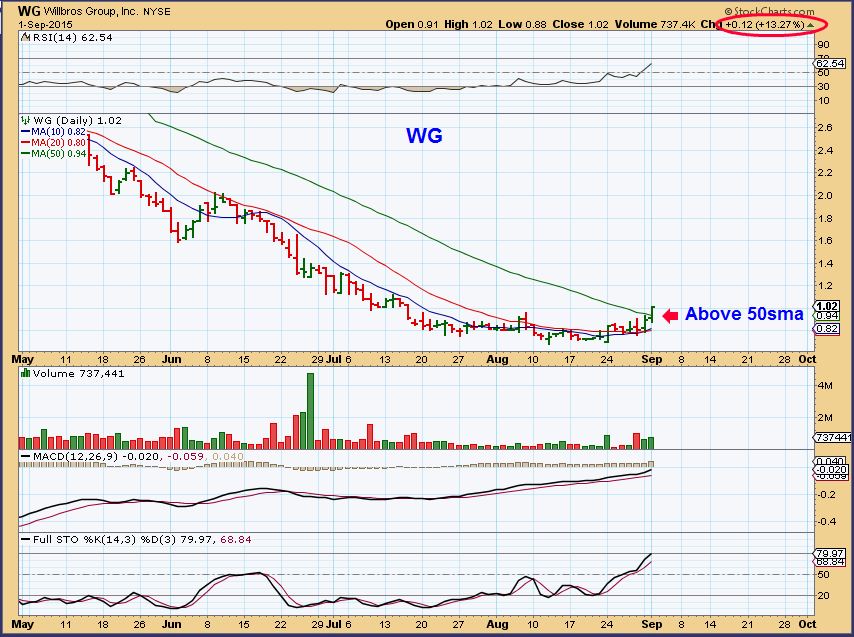
WG– Then it popped above the 50sma, even better.
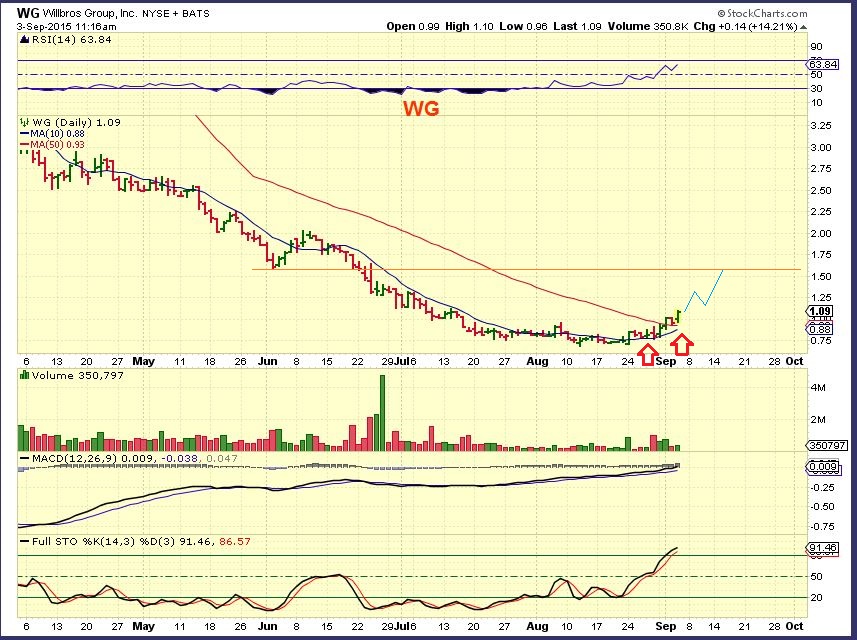
WG – Still moving higher. So far 20% higher from that $0.90 mark .
Scroll to top