The Beat Goes On

  Yes, The beat goes on and the drums are on fire.  In my last few reports, I have mentioned how we were focused on Miners and commodities lately.  Did you see the Commodity stocks and especially the  Steel stocks today?  Many were up 15- 20+% today alone.  Take a look at charts of  X, AKS, CLF, FCX, VALE , and so on.  At chartfreak, we have been focusing  on these trades, and now Energy is looking very interesting too.   Below is a small portion of Wednesday mornings premium report. The follow through today was amazing!


From Todays report…

XLE –  This looks set up to break out higher

XLE 3-1


.

By the way-  COPPER looks very bullish to me.  (  See FCX, NCQ, TGB, )

COPPER 3-1


My FCX chart from Feb 9, pushing that 50sma,  it could have been bought at $5.  EDIT: It hit $9 today, up over 100% from the Jan lows.

FCX 2-9


I still like all of the set ups that I’ve mentioned here in commodities , like CLF, X, AA, CENX, FCX, VALE, AKS,  etc.  They are having a nice run.  Here are some examples.


VALE Feb 3

VALE 2-3


I posted this 2nd BUY in Vale with a tight stop 2 days ago . This could easily run 25 – 50 % in the coming weeks.

VALE 2-29


Follow through

EDIT: VALE is at $3.63Wednesday.

VALE 3-1

CLF –

CLF 2-29

CLF 3-1

X –

X 2-29


This was March 1. EDIT:  On March 2 it hit $11.49

X 3-1

Check out this crazy steel stock.  $3.69 to $9.39 ,  now ready to go again? EDIT: It hit $9.22 today.

TMST 2-29

.

I mentioned this set up on WTI way back when Oil broke to new lows.  Then I mentioned it Monday with this chart.

WTI 2-29

Boom

wti 3-1


PDS

PDS 3-1

OAS

OAS 3-1

I gave a list of these types of stocks in yesterdays reports and they all seem to be acting well, either forming bases or breaking out.

.

If you get a chance, you can check out some of those charts  ( X, AKS, CLF, VALE, etc). They are continuing to act correctly.  Many are obviously getting extended, up 100% off of their lows, but commodities do look like they still want higher price.  It has been a traders paradise and a buy & hold approach has also worked for the last couple of weeks.  I hope that you have been able to take advantage of these moves. For $37/month , my reports can guide you as an addition to your own trading style or analysis.  It seems that  1 trade today could easily have paid for 1 month  ( or a yearly membership for that matter)   🙂   Thanks for reading along and best wishes!

.

CLICK HERE AND SCROLL DOWN FOR SIGN UP INFO

~ALEX


Public Report – Update For The Golden Pennant

Many people are looking at this almost perfect Bullish Pennant forming in Gold. Many are also looking at the C.O.T. report that came out Friday and seeing bearish implications.  Yes, Bull Flags can fail, but for now it remains a bullish trading pattern, so lets discuss Gold here using a few of todays charts from the premium report.

.

GOLD – Gold tagged the $1250 area overnight. That is the top of the flag.  Gold could break out from here, but since we are not at the Apex,  GOLD MAY ALSO POP & DROP TODAY (SHORT TERM) IF THIS FLAG HOLDS IT BACK. This flag has eased overbought conditions meaning that Gold could still break higher in time . 

GOLD 2-29

GLD Monthly  ( Feb ended Monday). Thats a bullish chart .
GLD 2-29 monthly

Silver-  Silver actually dropped Monday and then bounced off of support.  This can be viewed as a test of the break out and also may be relieving overbought conditions. ( I don’t know why volume didn’t appear correctly here).

SILVER 2-29

This is a Monthly view of GDX, since Feb ended Monday.  This surge with that kind of volume is exactly what you want to see. 

GDX MONTHLY 2-29


I had posted this chart last week with a triangle that I had drawn in at the lower left corner. I’m pointing out that when a Flag pattern breaks out upside,  one usually buys the break out and puts a stop below the apex. If it fails, you will be stopped out.

GOLD flag

I also pointed out a couple of Miners that have ‘Lagged’ a bit and may be setting up to run even higher if Gold does Pop.  ( AGI  – Imagine thinking  that $2.40 to $4.30 is lagging)  🙂

.

So why do I like the set up in AGI?   Look at the similarities between these next 3 charts. Long bases can lead to excellent rallies.

AGI 2-26

ABX base

NEM 2-8


So AGI could break higher out of that base if Gold decides to break from that flag.

AGI 2-29

.

What if Golds flag was only a 1/2 way point, and the RSI & STOCHASTICS gets embedded? That would prove to be a huge move out of the lows.

GOLD FLAG 2-24

.

Yes,  The C.O.T. was showing that Commercial shorts are as high as they have been at previous tops.  Will this flag fail?   It might, but I’m not going to jump the gun and short this bullish move higher.  I’ll just continue to tale it step by step, using and honoring stops along the way.

.

Best wishes and thanks for being here.


~ALEX

Public Report – Bull Flags

I wrote a report about Bull Flags for the premium members last night. Why?  Questions have been raised.

 .

On Feb 17th, after the recent run up in Gold, I mentioned that Gold  could Pause and form a Bull Flag.  These are often just a pause along the way  (although they can fail).

Feb 17 - I discussed a possible Bull Flag forming after a strong run higher. 

GOLD 2-17

Feb 24 -   We have the Flag and as mentioned, it is often  just a pause before continuing to run higher.

GOLD 2-24  

Well on Friday  Feb 24 Gold broke out and dropped.  Many said Gold failed at the Bull Flag.   Friday  Feb 26 ( Today)  Gold dropped down to $1212.  Does that hurt the Bull Flag and prove it is a failure,  like some are saying? 

No- Let me show you 2 ideas that are not a stretch or grasping for straws. These are legitimate patterns playing out .

Read More

Public Post – A Trading Paradise In Metals And Miners

Are you basking in the Traders paradise?  At Chartfreak, trading has been good in Precious metals and Commodities.  Lets take a look at a few of our expectations going forward and review some trade set ups that are still working out favorably.

.

SPX WKLY –  After warning that there were signs of another  sell off coming in November,I have recently been expecting a rally to draw the bulls back in.  I expect that we could see a repeat of the run up last September, as highlighted.

SPX WKLY 2-19


OIL REVIEW


Back on November 13 , I had a $26.09 Target for Oil on a weekly chart.  I also pointed out a $24 target later , if the selling reached extremes.

WTIC WKLY 11-13

Last week the XLE didn’t make new lows, but Oil did, dropping to $26.05.   That along with cycle timing caused me to look for Oil to possibly see a temporary bottom here.


I used these charts in my February reports.

Oil  gapped up recently , so I drew my expectation of a gap fill and a tag of trend line. Then the move higher.

WTIC 2-18

We got a perfect tag of the trend line.   I still believe that Oil may be finding a bottom unless this trend line breaks?

WTIC 2-19

Notice that Some Oil Stocks bottomed last summer, well before Oil.

XOM 2-16


.CVX 2-16

.

GOLD SILVER & MINERS

GOLD– We caught the strong run up in Gold and Miners right from the shake out lows in GDX.  On Feb 17 I thought that a FLAG could form to consolidate recent gains, while individual Miners may still rally or play catch up, so I presented this idea and a few alternative ideas as well.

GOLD 2-17

You can see that the Bull flag is almost complete.

GOLD 2-22b


SILVER –  Silver never broke out, so it may do that this week or it may just continue to consolidate.

SILVER wkly 2-19

I definitely believe that we may be seeing the next phase of the Bull Market in Precious metals starting, as we surge out of the lows. Nothing goes straight up though, so lets also discuss what an eventual pull back could look like, as it may present another buying opportunity.

.

This is one that would shake many people up. I don’t think that it is the most likely path, but it needs to be viewed to prepare us for any possibility.

GDX with 2013

These 2 charts were in my last public report. I favor these views.

#1

GDX 2-18b


#2GDX 2-18

.

What about this Traders Paradise?  Past public reports have pointed out some of our trades in Miners  and  commodities.  Lets review a couple more here.

.

SWC – This stock was pushing on the 50sma and was a good set up last week.

SWC - 2-19

SWC –  SWN has broken out after reporting earnings. I expect higher prices.

SWC 2-23

MUX –  We recommended a 2nd buy on Jan 26 at $1.17

MUX WKLY 1-26

MUX  – today it is at $1.75.  If Miners pull back in a significant way, I can see a test of the 50sma as possible.

MUX 2-23

ABX – $ 7.65  inverse H&S with good volume pops.

ABX 12-16


ABX currently at $13.42.  This may just form a handle, before another strong mive higher.

ABX 2-23

.

Here is some good news too.  Some of the commodity stocks presented  in past reports as ‘trade set ups’ now appear to be breaking from their bases and could have great upside potential  for the long term. 

.

CENX – Feb 3, nice long base with a shake out, ran and pulled back to $4 at the 8 ema.

CENX 2-3

CENX   Has moved from $2.63 to above $7.   A pullback may be another buying opportunity. Look back at how ABX and NEM ran from their long bases.

CENX 2-22

.

FCX was mentioned as bottoming near $4, and then a  2nd buy was at $6 as it broke above the 50sma.  FCX is near $8 today. This also may be bought on the dips if it remains healthy.

FCX 2-4

 .

Feb 3 – VALE at $2.32 , this was a low risk entry, since your stop would be placed below the lows.  Price  is now trading above  that blue triangle.

VALE 2-3

.

X Daily–   Notice that US STEEL is  forming a multi month base with divergence.  This has a lot of upside  potential if it recovers from here.

X 2-19


Recent reports  featured AA, AKS, STLD, TCK, VALE, FCX , etc., and most of them now look like bases that may become longer term bottoms.

.

I’ve been discussing the possibility of the Equity Markets topping and the Bull returning in Precious Metals and Commodities for a while now.   Many public reports have been posted at Chartfreak.com to highlight these events.  I liken it to a large freighter ship turning around in the ocean.  They can’t turn on a dime, but gradually they will reverse course and head in the other direction.   Is that what we are seeing here in the markets today?   Many Miners and commodity stocks look to have built their bases, and they could even become buy & hold investments longer term if conditions remain this way.  Why not join us as we continue to monitor the situation? Chartfreak.com

.


~ALEX

Public Post – OIL & GOLD

I'm going to share a portion of the premium report from Tuesday.  We had been invested in Miners from the shake out lows, but most of what was bought has had a spectacular run higher.  Now that there could be a consolidation phase in precious metals, does anything else look interesting?   Have you seen  VALE, FCX, CENX, etc?  Commodities are making some nice steady gains. I'm also looking at The Energy Sector among other things.  From Tuesdays report...


I think OIL is putting in lows  (temporary or permanent remains to be seen).   Lets discuss a few ideas as to why I think we are at lows in Oil. 

.

On November 13th ,  I said that my OIL WKLY target was $26.09

WTIC WKLY 11-13

Did we hit $26.09?

Read More

Public Post – A Precious Metals Review

In a recent weekend report I discussed what I thought about the USD going forward, also using the recent action in the XJY as a historical guide.  It could affect Gold in a big way. This is important, since The Big Picture of the USD has paused and may be preparing to choose a direction to move in again soon.

.

USD – After a strong run up in 2014, the USD paused and flagged. It could drop & back test the trend line, that would help Gold further. As a bull flag, it would run higher.  That might not be so good for Gold.

USD LONG TERM 2-12

.

We are also watching Oils activity

WTIC WKLY LONG TERM– Oil looks close to putting in lows, but it has for a while now. Read the charts.

WTIC 2-12 wkly

.

GOLD SILVER & MINERS


I had been following the possible break out in XJY:USD and in miners.  We see it here in this Feb 12th chart.  This evidence still favors Lows in Gold, Silver, and Miners,  as discussed in a prior report.

YEN VS USD BREAK 2-12

.

GOLD  I had 2 views for Gold, and it looks like this one may be playing with a pullback.

.

    I would expect that Golds price would eventually test the 200sma, but this can occur later when the 200 is rising.  Shown here is a possible 38% retrace back down to the top of the cup shown near $1180.  A 50% retrace is $1154.65.  Either is possible, time will tell.

GOLD 2-12


.

GDX  MONTHLY UPDATE –  This chart posted a week ago is one that I have been following for a while. I also posted an updated one in this weekends report.


GDX MONTHLY 2-5

.


30 yr chart of the XAU.  Did you miss the last move?  It may just be the start of a larger run.  That move that we just put in looks tiny from this view.

XAU 84 thru now

.

We also reviewed some of the recent gains of the miners that we had discussed before.

MUX– Look for the base.

MUX WKLY 1-26

The run has begun, and could mimic the multi week drop on the left on the way to the top.

MUX 1-12 wkly

 .

Even the ‘cheaper’ priced Miners have been running quickly with large %-Gains.

.

TGD was pointed out before it ran.

TGD 1-29

.


TIMMINS 2-12

.

BAA and AUMN  are ready to launch in my opinion.

BAA

So we are definitely seeing many reasons for believing that the Big Picture is changing as expected.  The Bear market lows could definitely be behind us with that classic shake out move in miners in January. We see Gold and Miners breaking above prior Intermediate cycle highs.  Many that were stopped out and left behind may now have to buy later and that could push this higher too.  The set up is very encouraging  and we will be trading it and following it to the best of our ability here.  Some “Mining Stocks” may act individually and set up even when Gold itself is pulling back,  and that will be noted too.  We saw this type of action when several Miners bottomed months, even yrs ago.  Other may now have reason to do the same.   I will be hunting for and sharing trading opportunities in this sector with that in mind.

 .

Sign up here, click and scroll down

.

~ALEX

.


PUBLIC REPORT- Time For GOLD?

If you are new here, please feel free to read my last 3 public reports under this blog tab.   They are Gold & Precious Metals reports, and I alerted my premium readers to those lows as they happened.   That was for short term trading, and I was expecting possibly a 2 month rally.    I have also been analyzing many details at these lows to see whetherit is possible that THE BEAR MARKET LOWS in Gold could be in place at this time.     I am not a constant Gold Bull, but I did do very well from 2000 to 2012 in that sector and have been looking forward to another possible leg higher after this 4+ yr bear market correction.

.

To review -  We just saw a classic shake out in Miners that had many going short expecting a crash.  This was running the stops on 6 Months of trading at the lows.

GDX WKLY 1-22

Next ...

Read More

PUBLIC POST – A GOLD REPORT

I am currently doing several studies with very bullish implications for the GOLD & SILVER market.  Some areas that I have been tracking for months have been published here in the public area too.  Right now I see things that indicate that we could be very close or, or even experiencing the bear Market Lows,  and I will be writing about it in my weekend report.   Yes, I know that everyone is waiting for sub $1000 gold to buy, but everyone doesn't always get what they want in the markets, do they?  Could it be that they will be left behind, waiting?     No Bias, No Gold Bug Fever, No Emotions, my report will cover just some facts.    Let me explain...

.

Notice this interesting occurrence for a change

.

The HUI has had bear mkt rally after bear market rally since 2012, but each 'cycle' could not surpass the last one from low to high.   Lower highs and lower lows is a down trend.   THIS CHART is a first, and it is just 1  sign of change to cheer about.  We'll zoom in...

HUI CHEER

HUI CLOSE UP

WHOA HUI

Please read on...

Read More

PUBLIC REPORT : Is Silver Really A The Weak Link?

I am not what many consider to be a Perma Gold Bull, but I do expect a 3rd phase of the 2000 Gold run to take place and end in a spectacular blow off top phase. That being the case, I also watch intently when we get these bear market lows for signs of a bigger picture change. Lately I am hearing that “Silver is weak”.  “Silver cant get out of its own way. It is setting up to plunge now.”  I’ve been discussing these lows and successfully trading them for weeks now. Is that the way I see current conditions? Is Silver really the weak link?  Not the way I look at things.  To the charts…

.

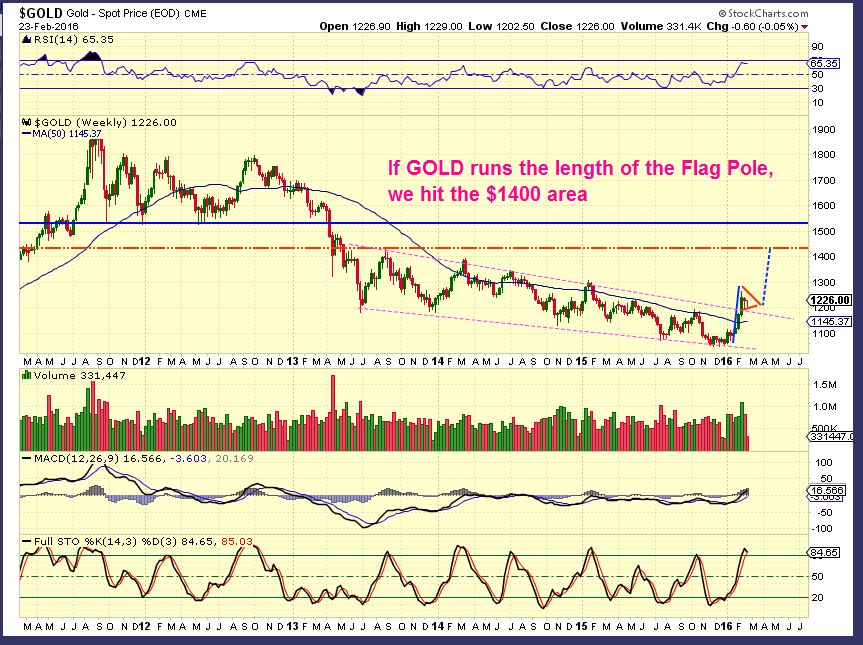
Looking at GOLD first may  help us with Silver

.

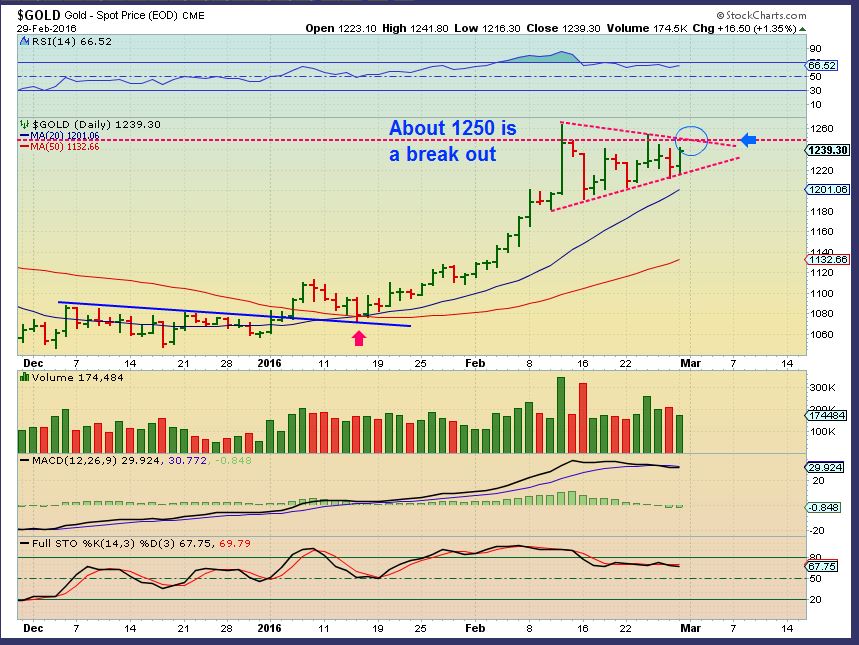
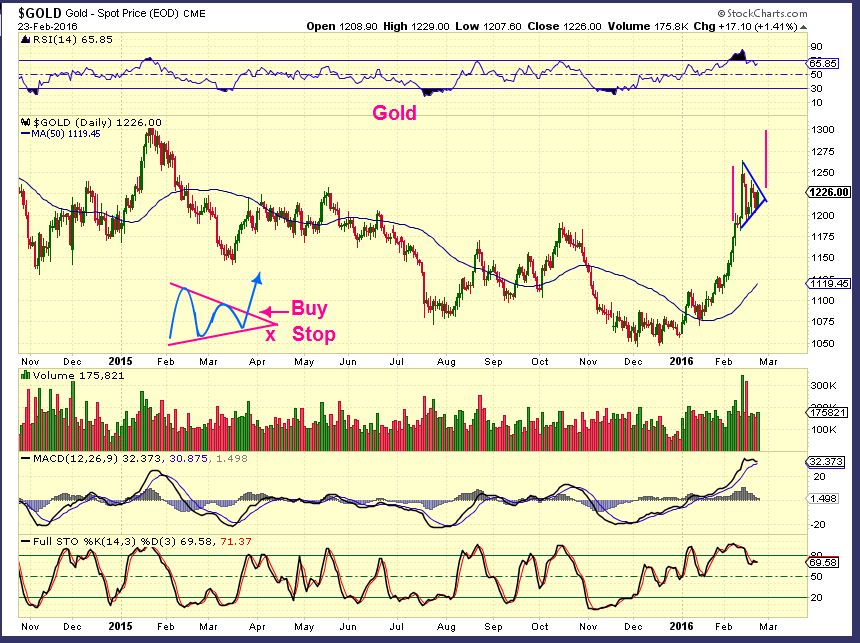
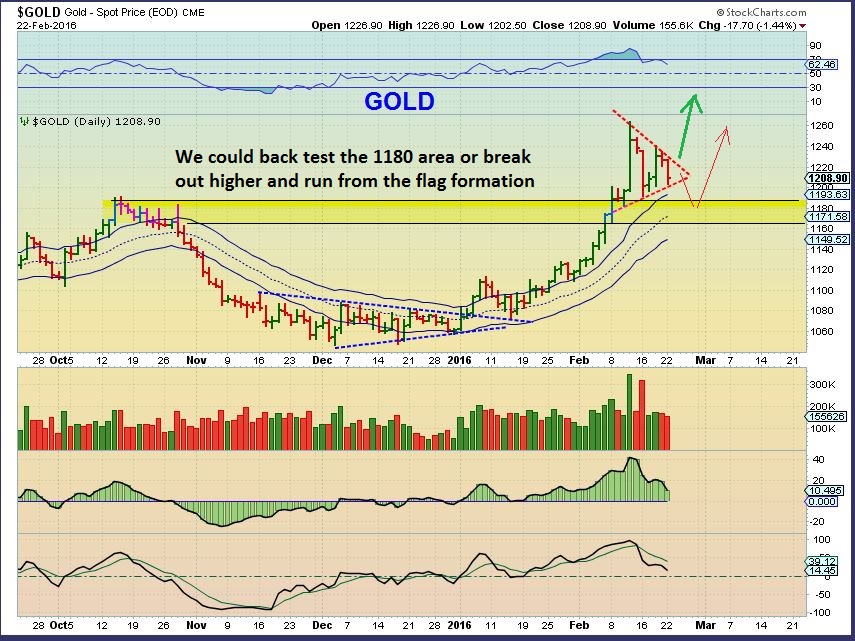
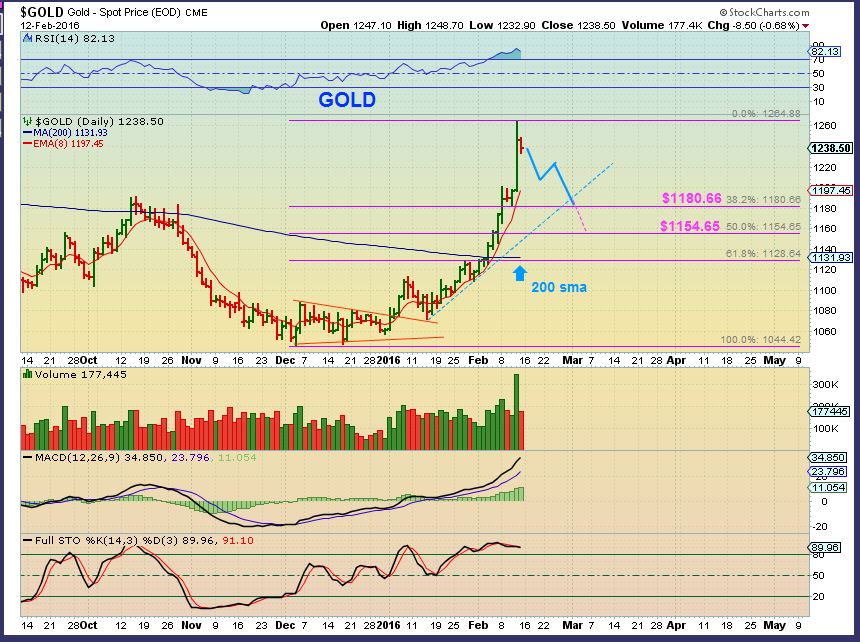
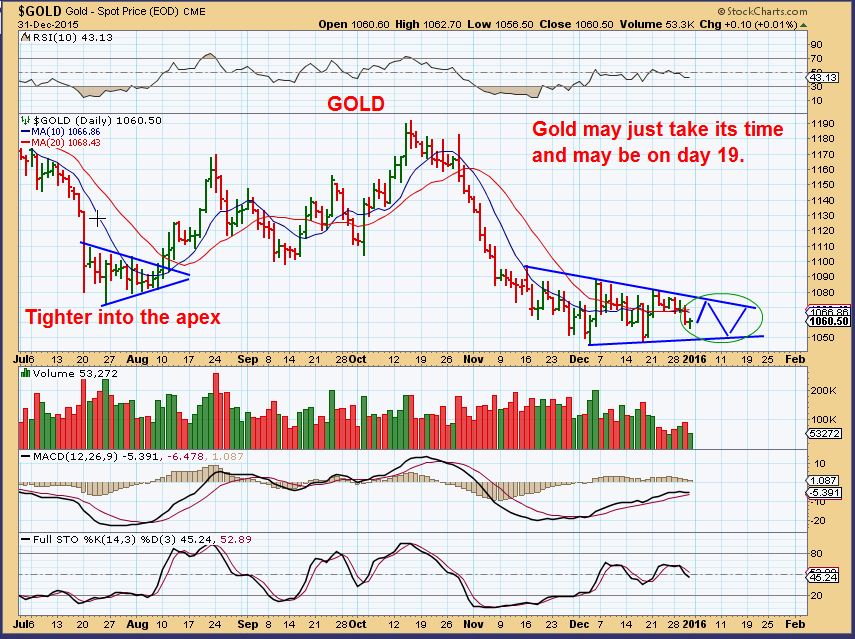
GOLD – 2 charts  –  Chart 1 – Lets take a look at Gold when it bottomed back on December  4th. I identified the lows with a weekly Bullish shake out  ( And a few other daily charts showed further confirmation of lows).

GOLD WKLY

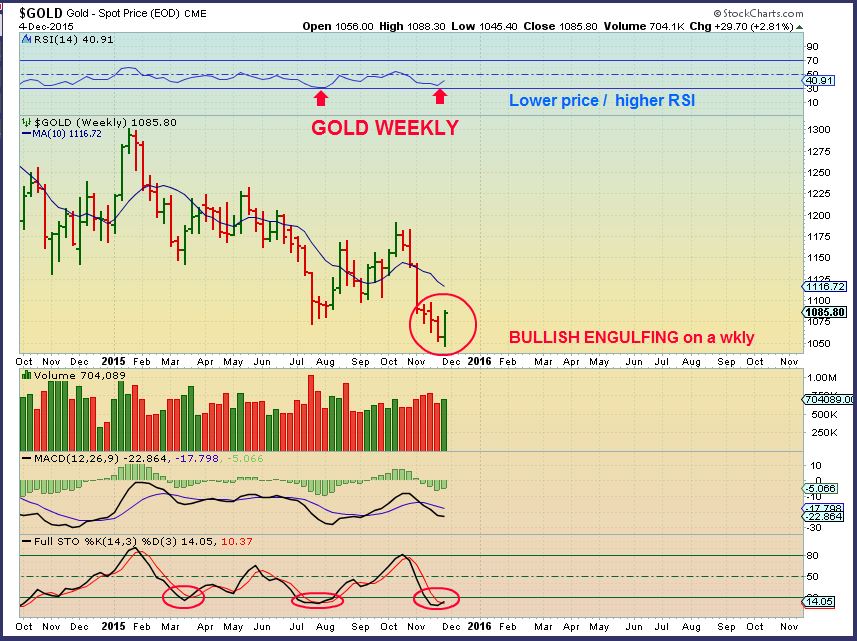
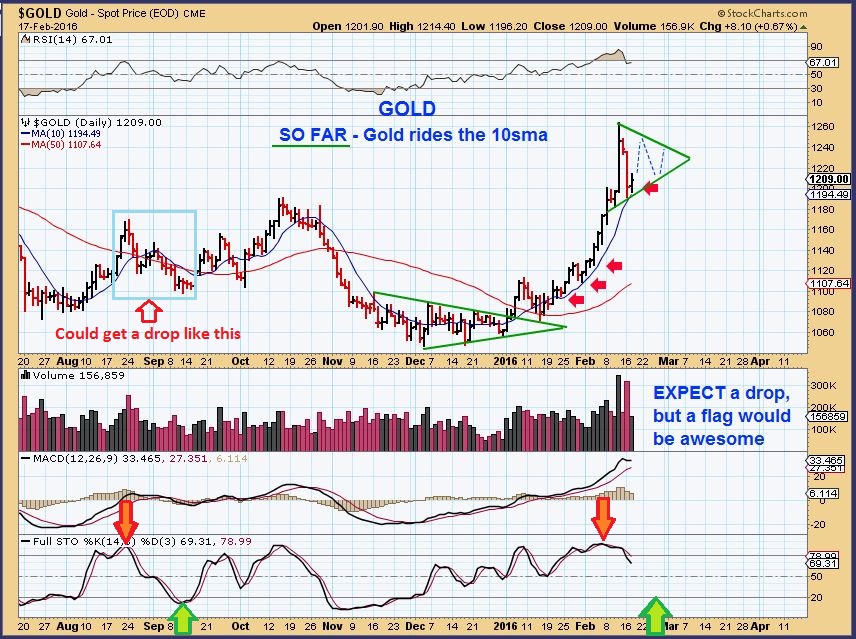
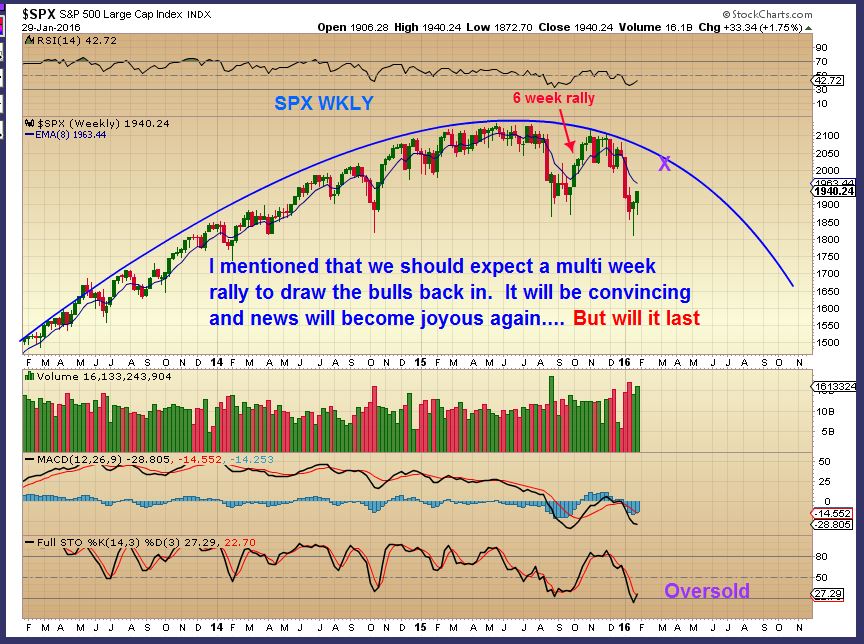
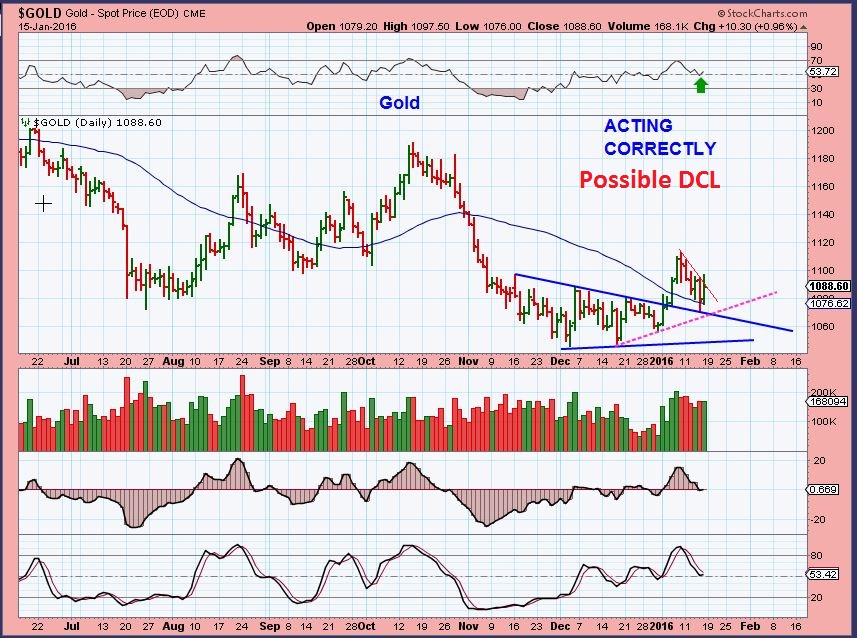
Chart 2 –   As Gold meandered at lows, I constantly heard “Gold is weak . It cant even rally.  We are going to plunge to $1000. I am going short.”   I pointed out that a Triangle was forming at the lows and mentioned how these often deceive people as a weak. They then break out higher  (See the left side of the chart).

GOLD 12-31

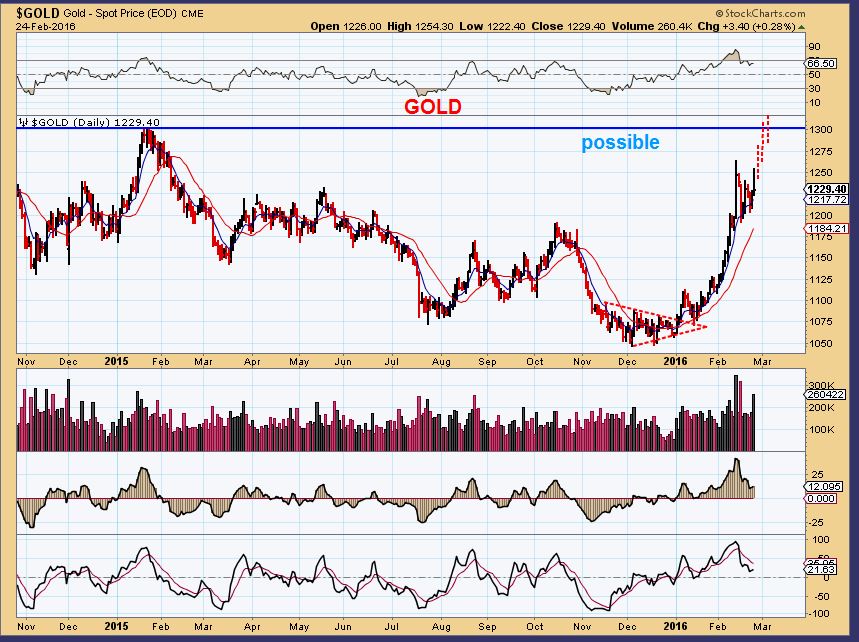
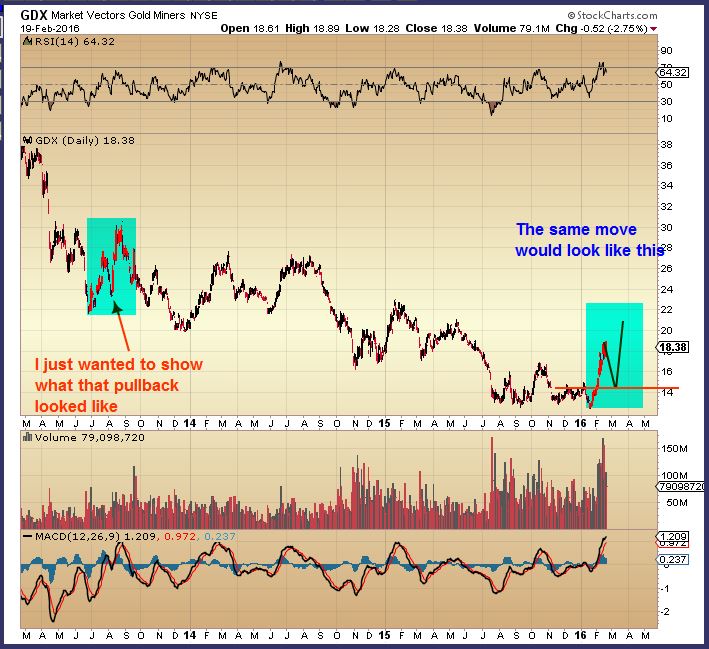
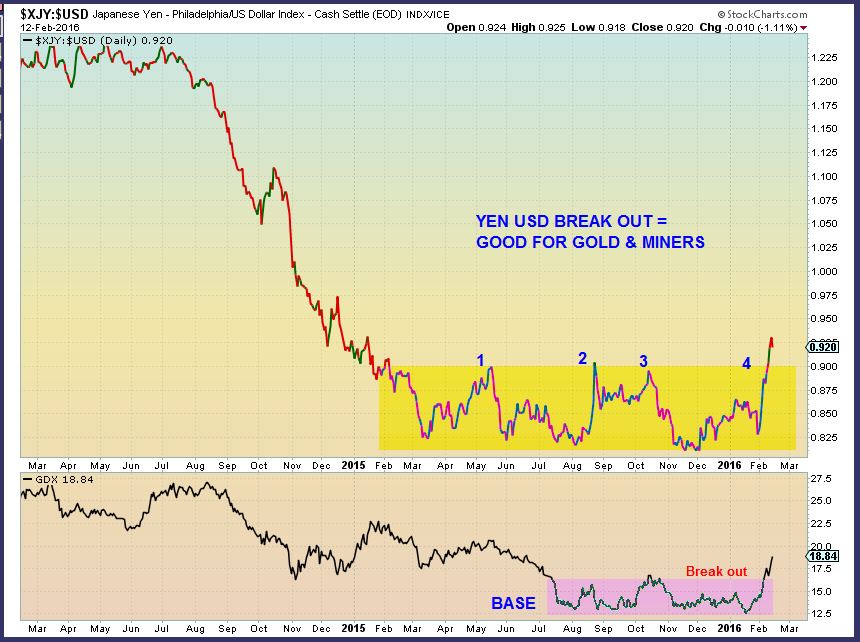
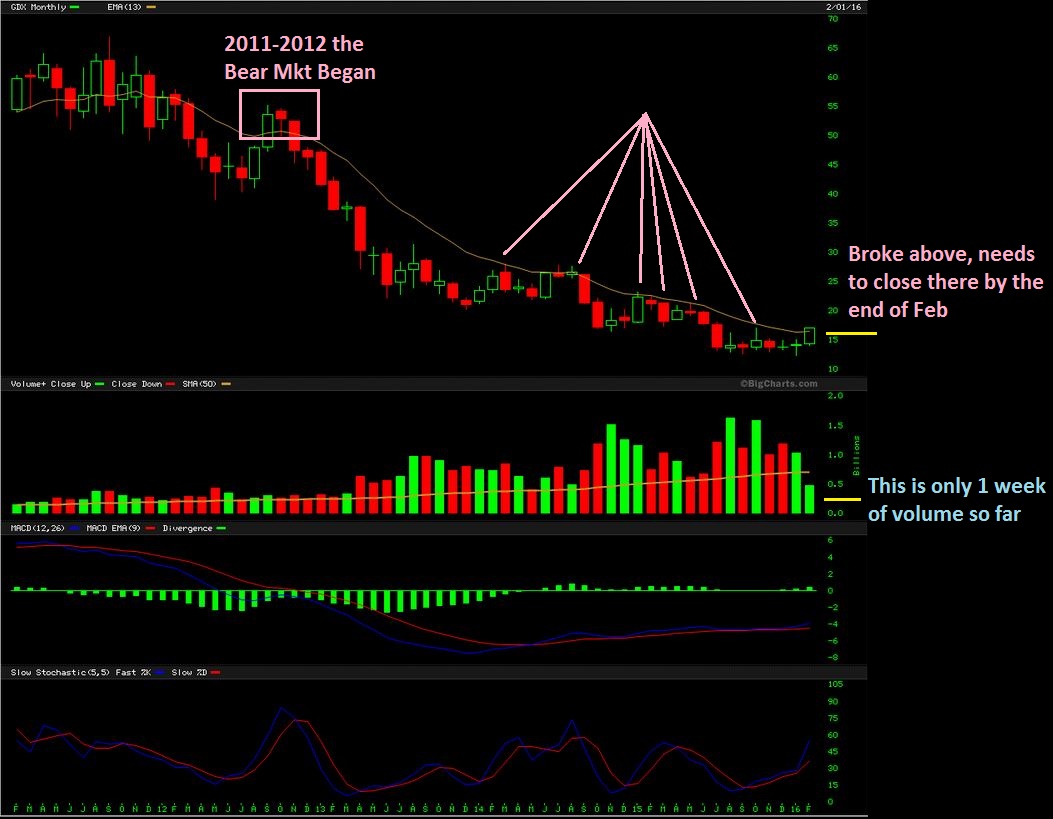
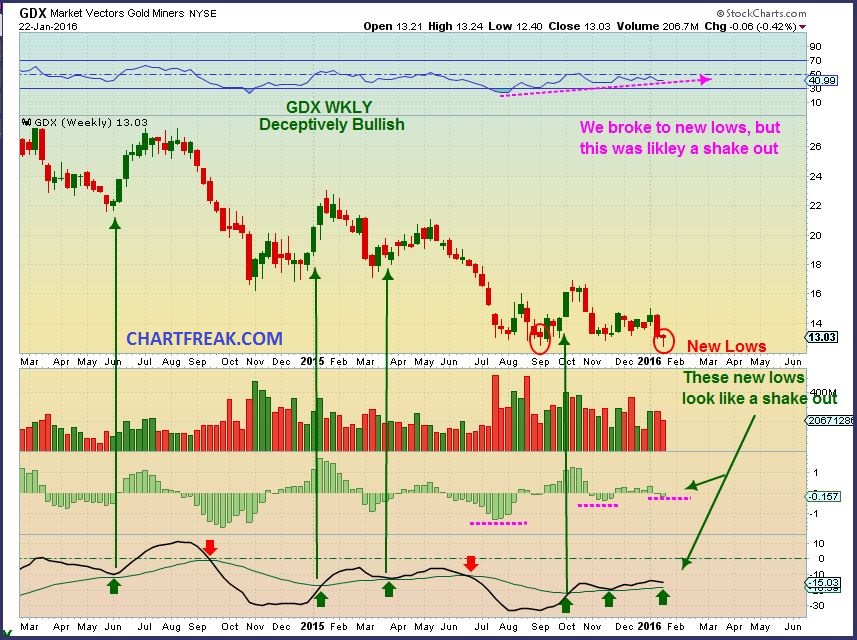
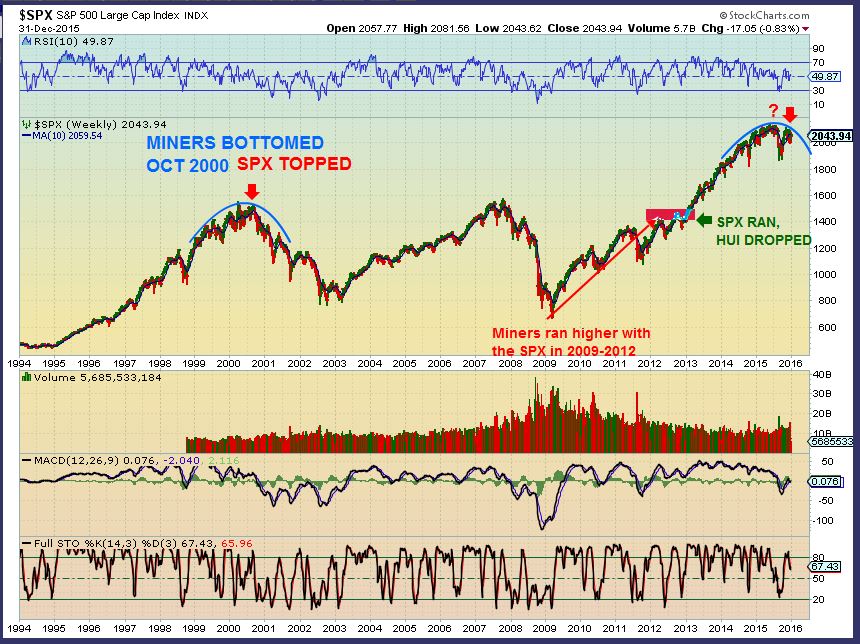
GOLD-  It  wasnt ‘weak’, it broke out but Miners broke down. Many said that is very bearish, so…

GOLD 1-15

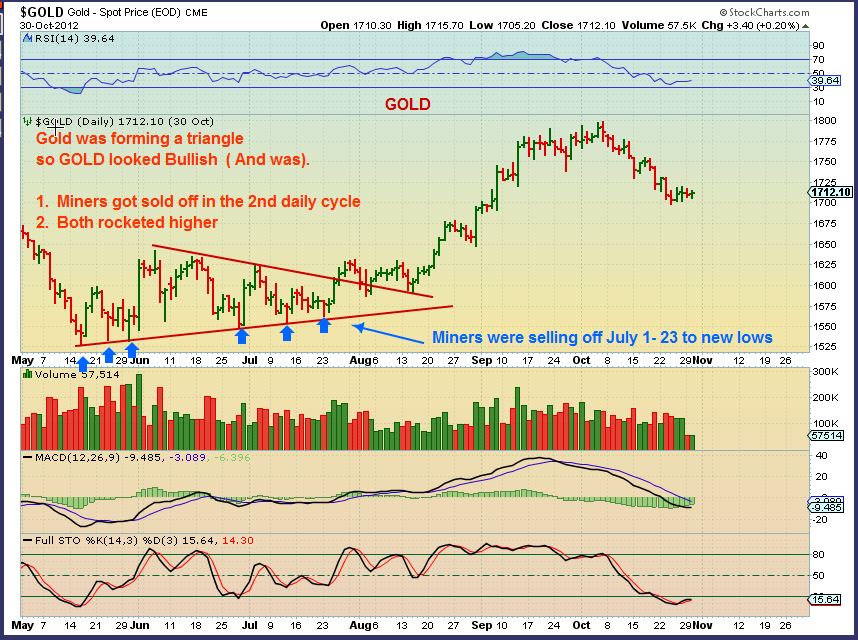
  To add confidence to our recent lows, I pointed out a triangle that I remember trading in 2012. It was VERY TRICKY.  Gold broke out and Silver & Miners broke down, just like in January.  Soon Both ran quickly higher leaving many behind ( Afraid of the weak Gold, Silver,  & Miners).

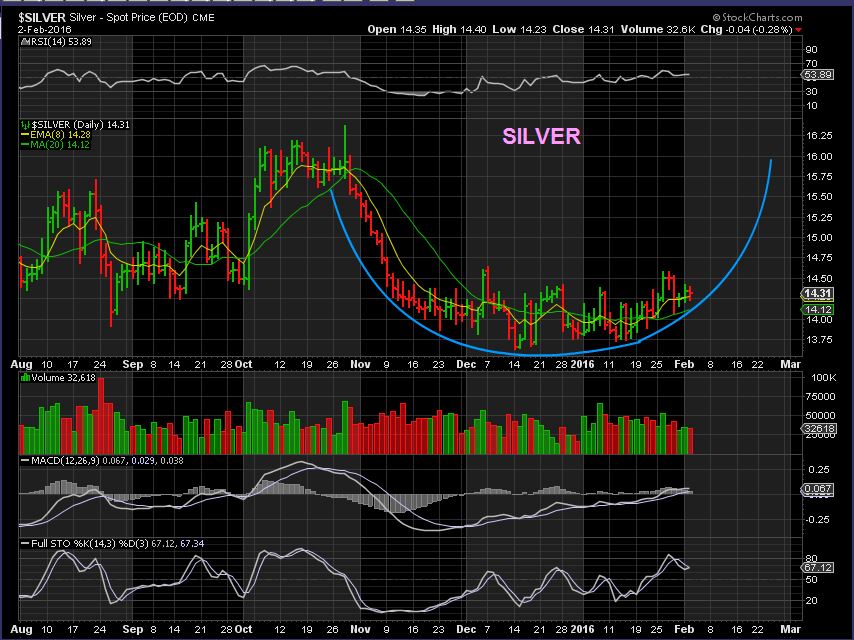
PLEASE NOTICE THAT GOLD WAS CLIMBING from MAY – AUG.   WHAT WAS SILVER DOING?

GOLD 2012 triangle

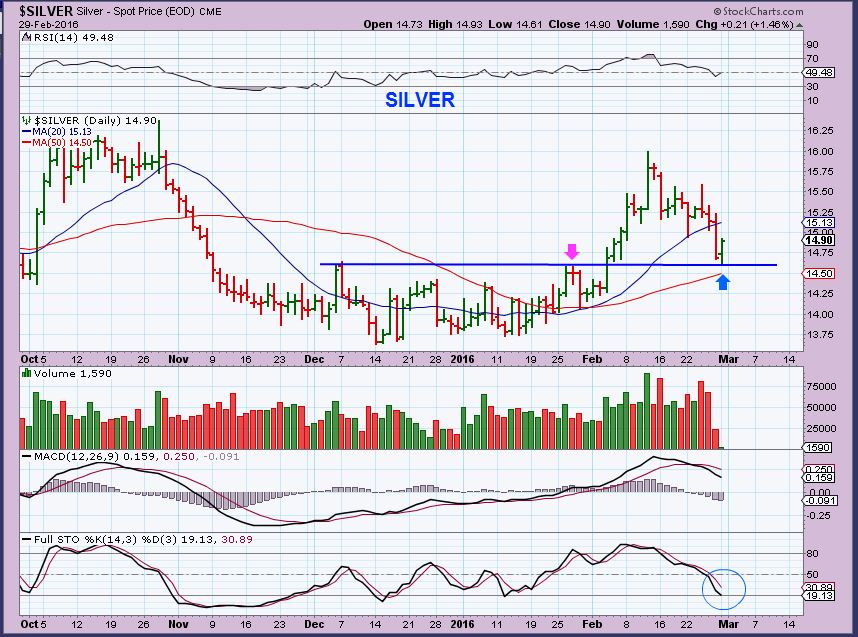
SILVER fooled people into thinking that it was “Weak?” Gold was rising in May , June, July, Aug with higher lows , but Silver was not. Notice the triangle though.

SILVER 2012


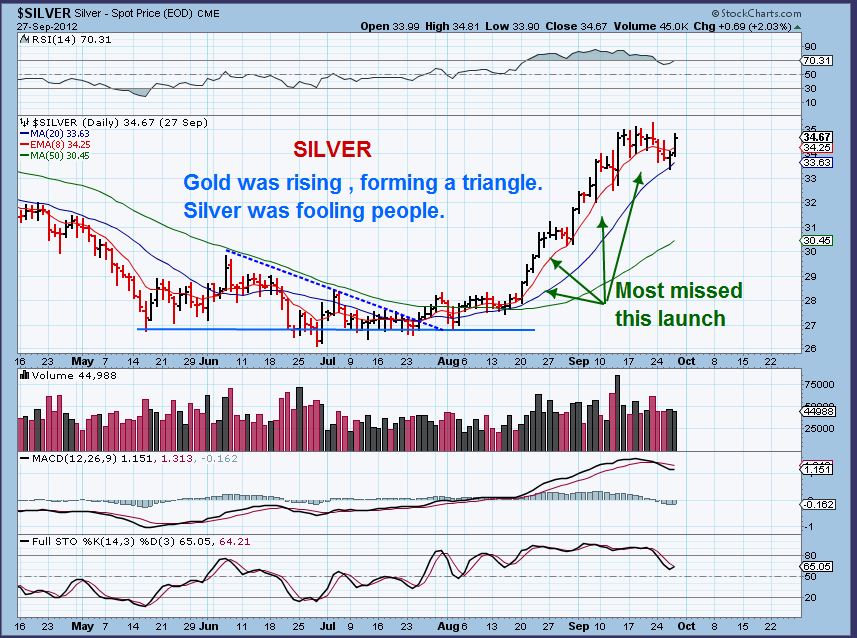
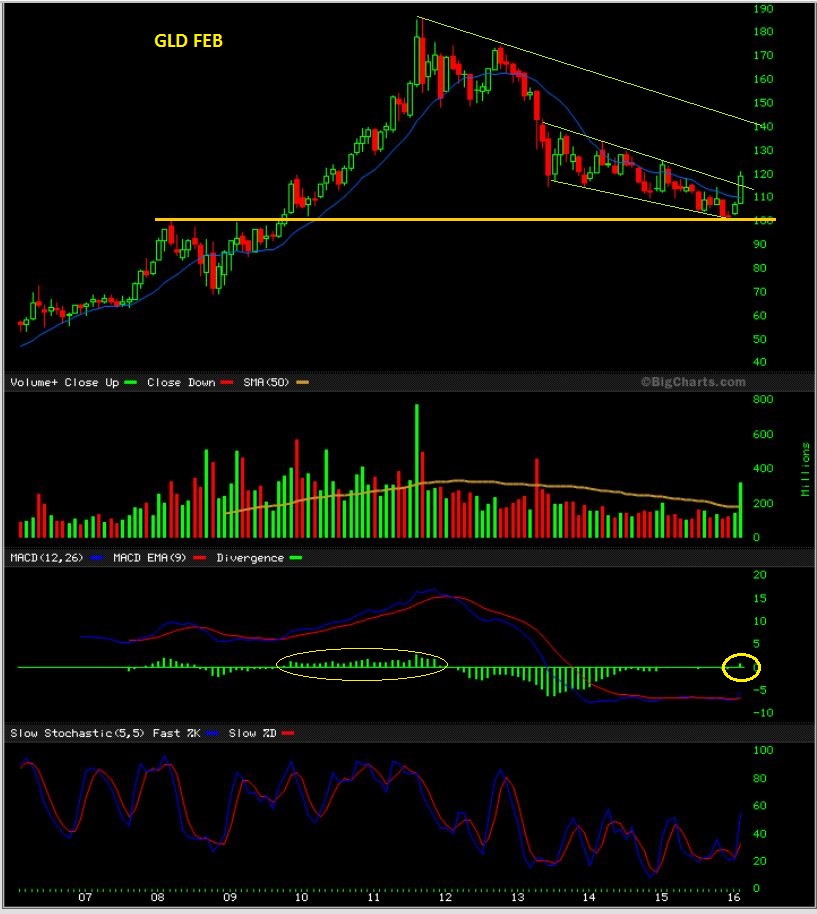
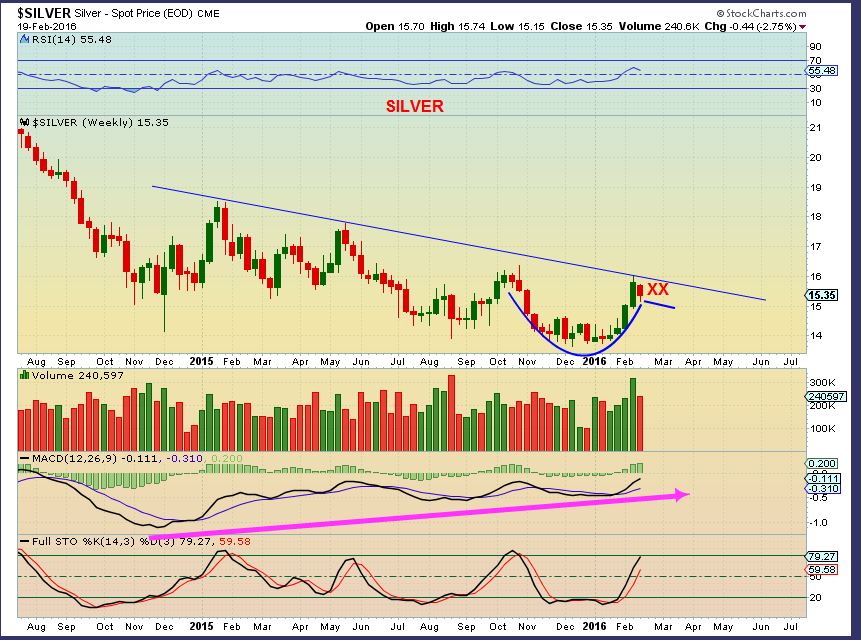
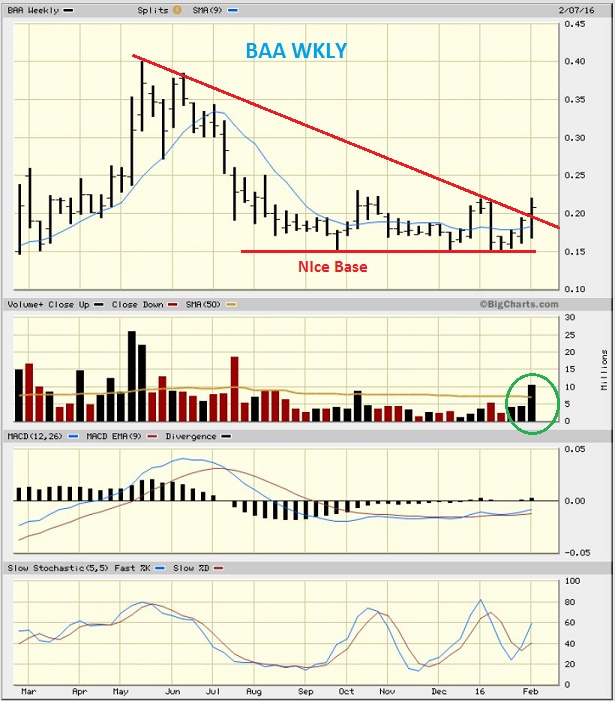
SILVER – This is how I was viewing Silver  recently,  while GOLD took off and silver “looked weak” to many.  Did you read that too? In my premium reports, I was saying to expect Silver to POP higher soon.

SILVER 1-27


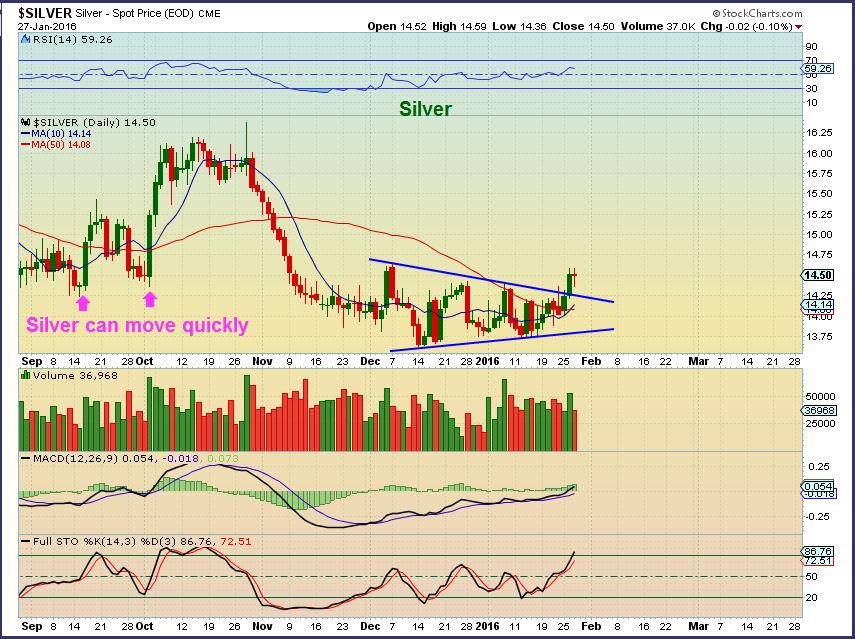
This is my SILVER chart in my premium report this morning.  Set up to break down?  Weak?

SILVER 2-2

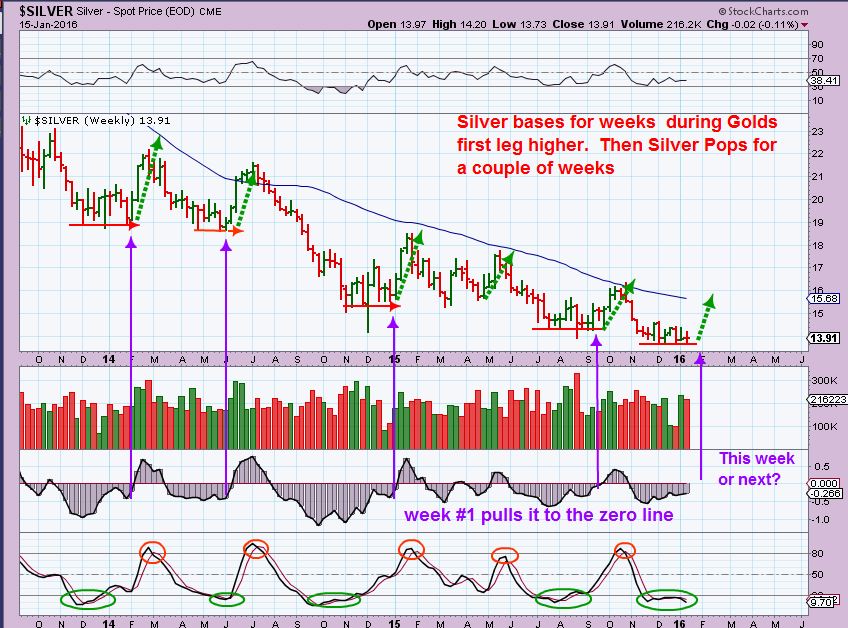
My  Jan 15 chart –  This is why I tell my readers that I think Silver will continue higher.  I use a special indicator that is lining up as expected.  The pattern of Basing & then the  surge happens , even in bear market rallies.  We’re basing,  how about the pop?  🙂

SILVER WKLY 1-15


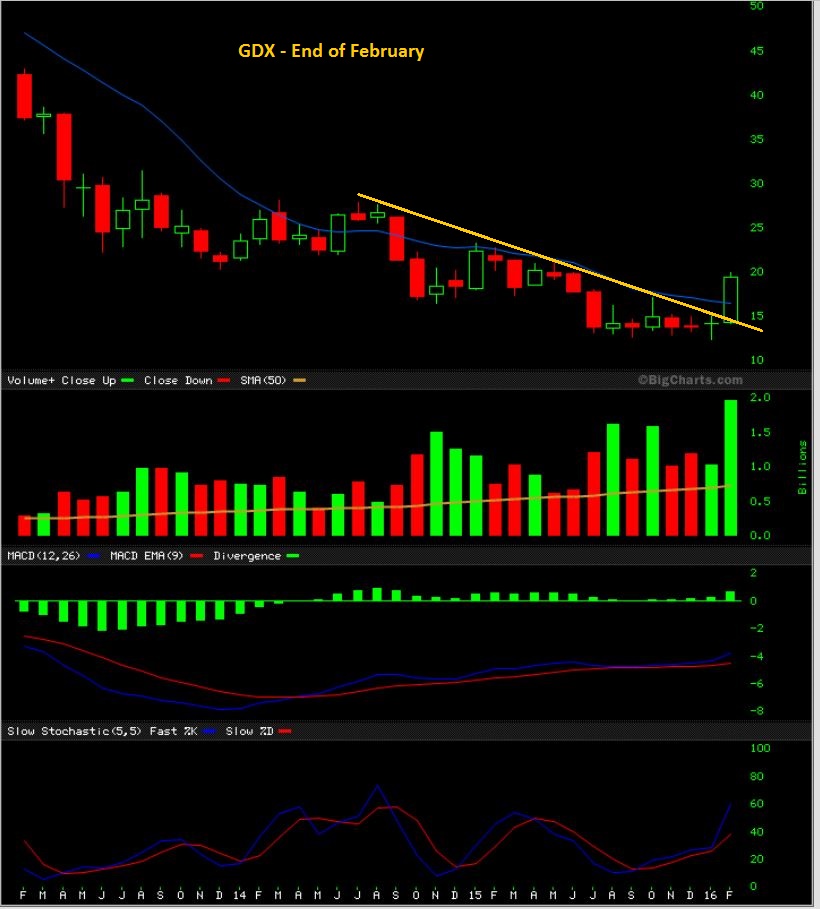
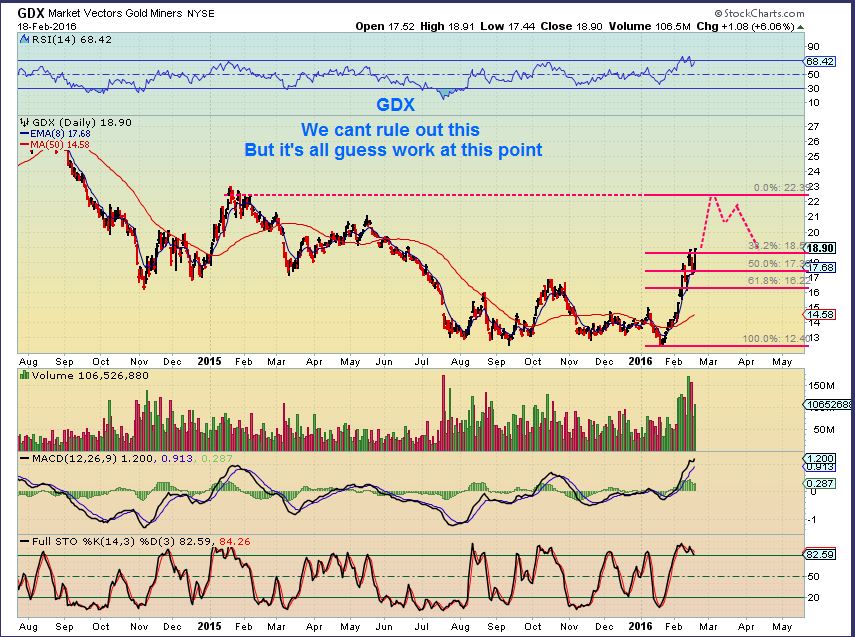
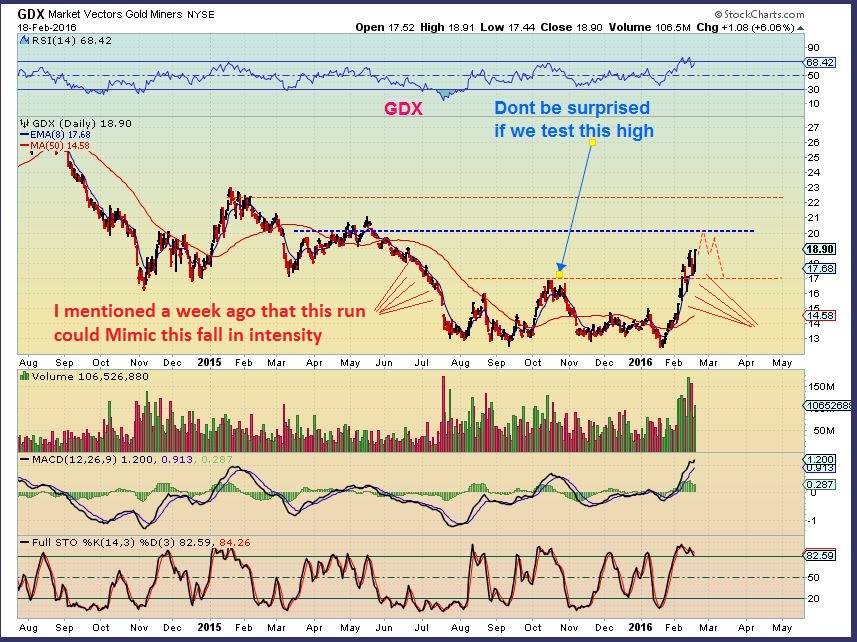
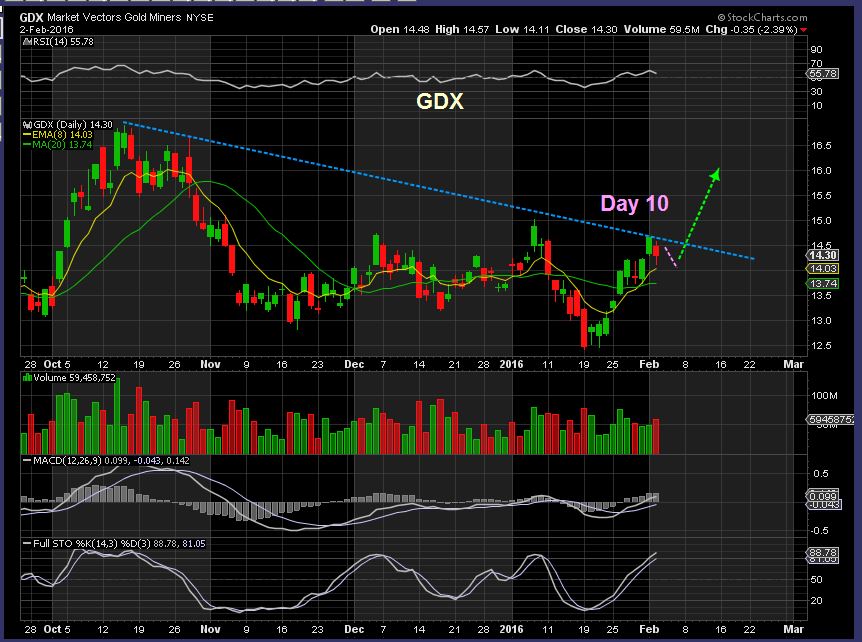
GDX Tuesday  –  On day 10 and at resistance,  it is strong but stalled for a moment.  Can it break out?

GDX 2-2

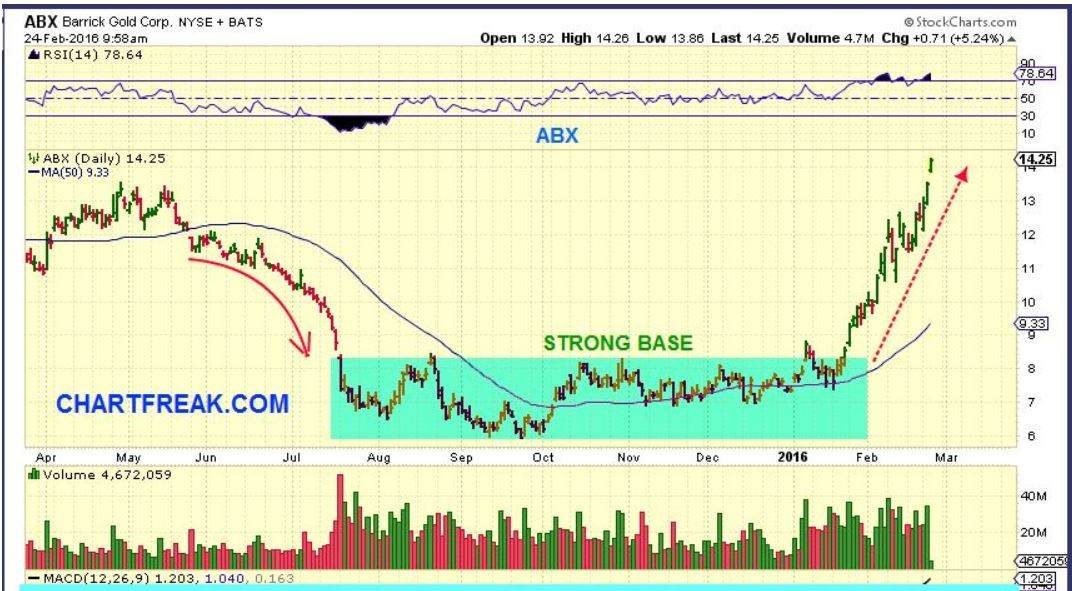
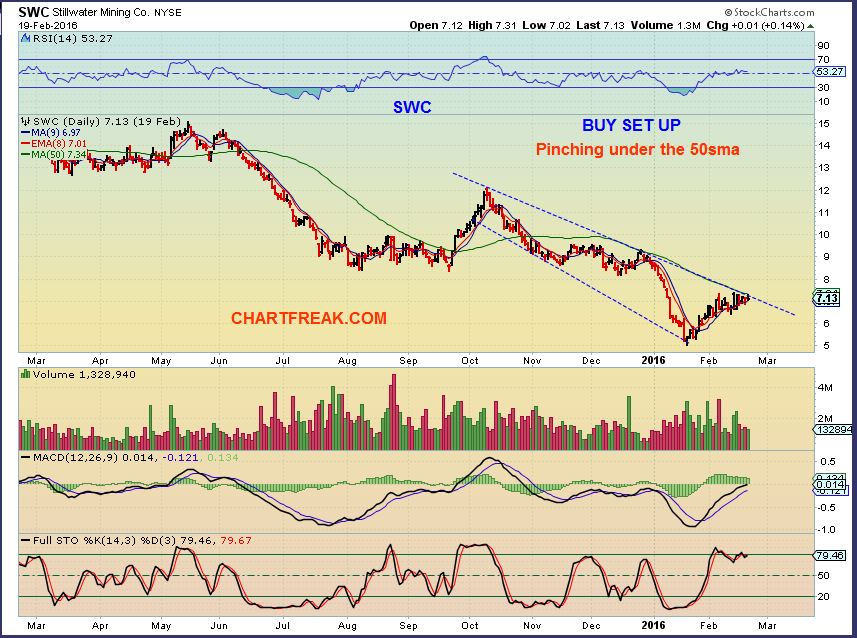
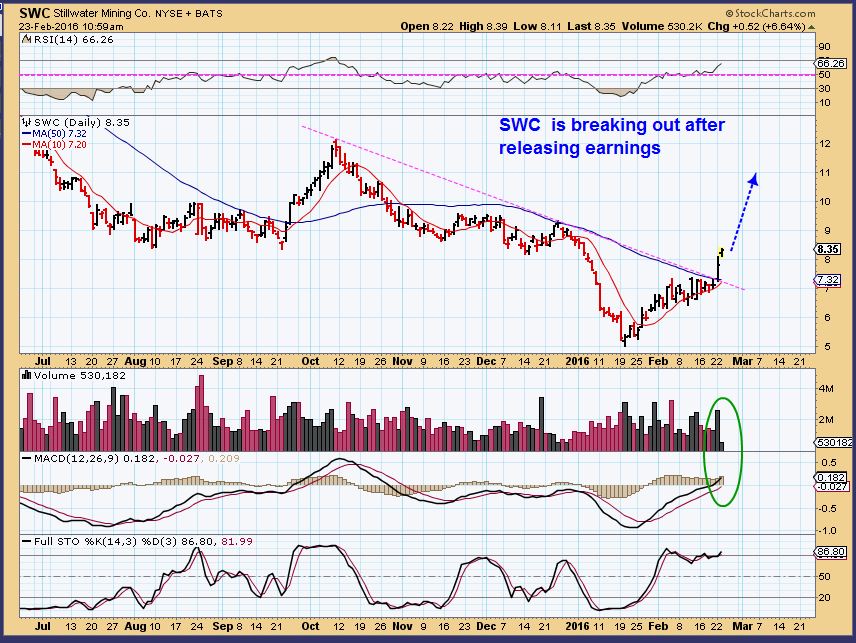
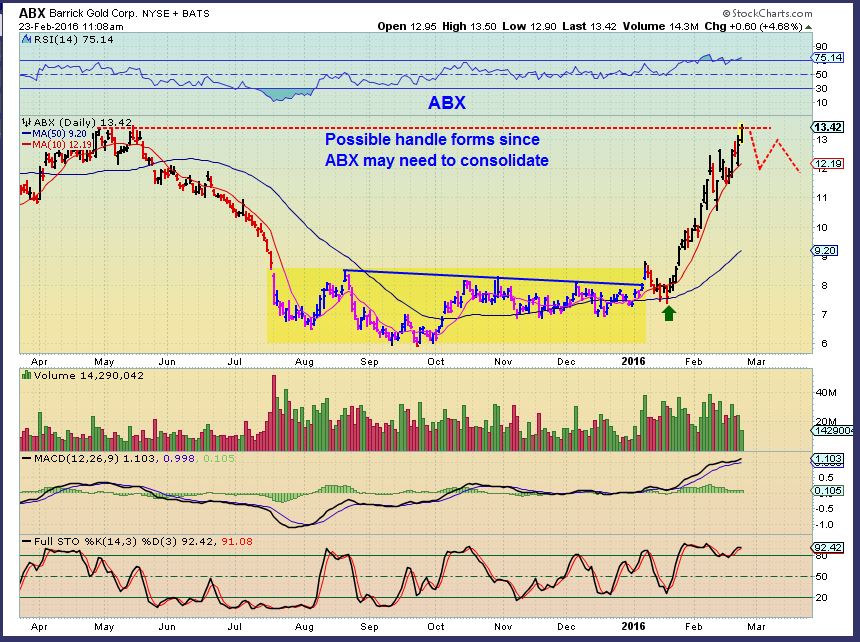
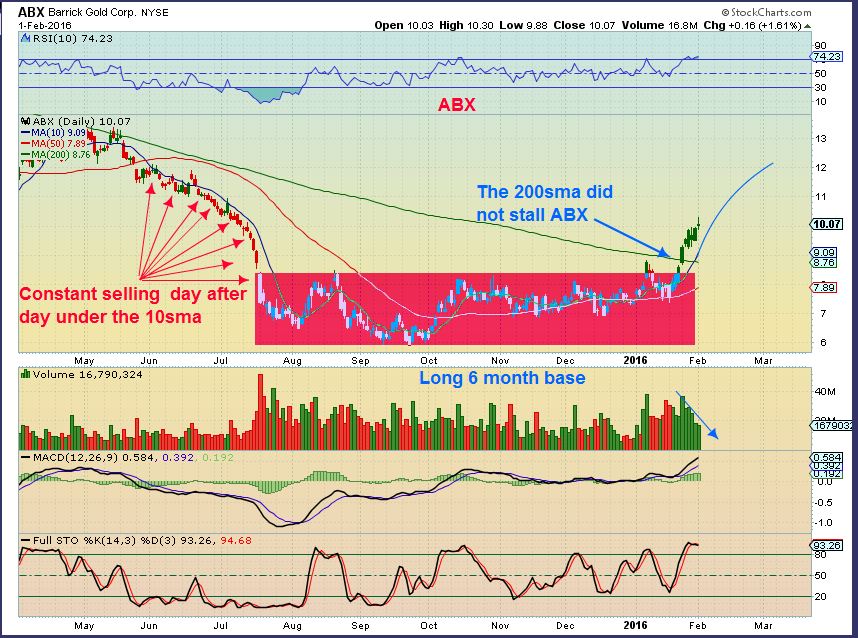
The possibility of a  bullish GDX break out is helped when we look at other miners.   ABX didn’t hold back at resistance of the 200sma.   🙂

ABX 2-1

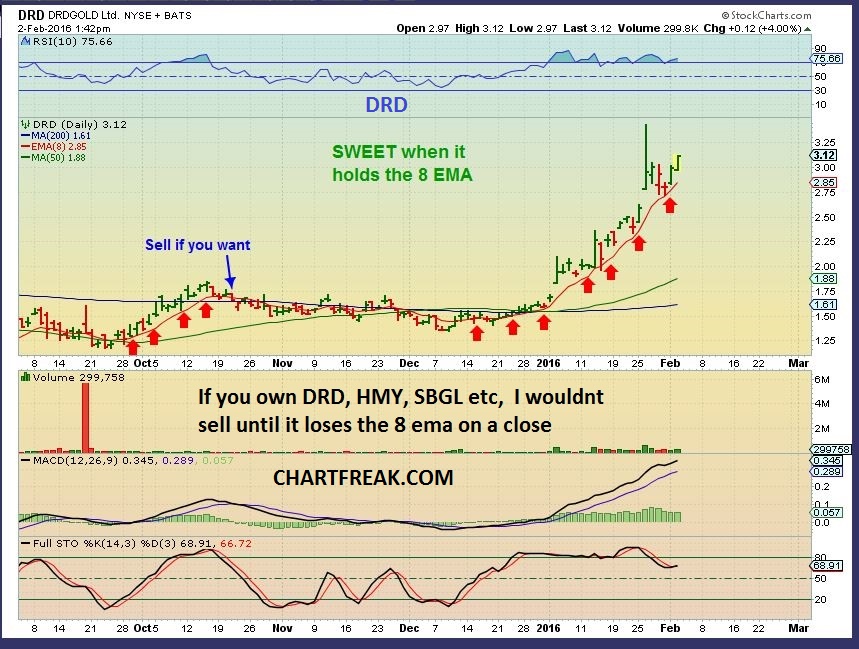
DRD –  See HMY, SBGL also.   Many Miners are moving higher.  Can you imagine this happening in GDX / GDXJ?  It is possible in my humble opinion, when the tide finally turns in phase 3 of the Gold Bull.  Huge % gains will be made by those that know what to look for.

DRD 8 ema


Yesterday I posted the bullish set up in PLM,  after someone asked me to keep an eye on it last fall.

PLM 2-1

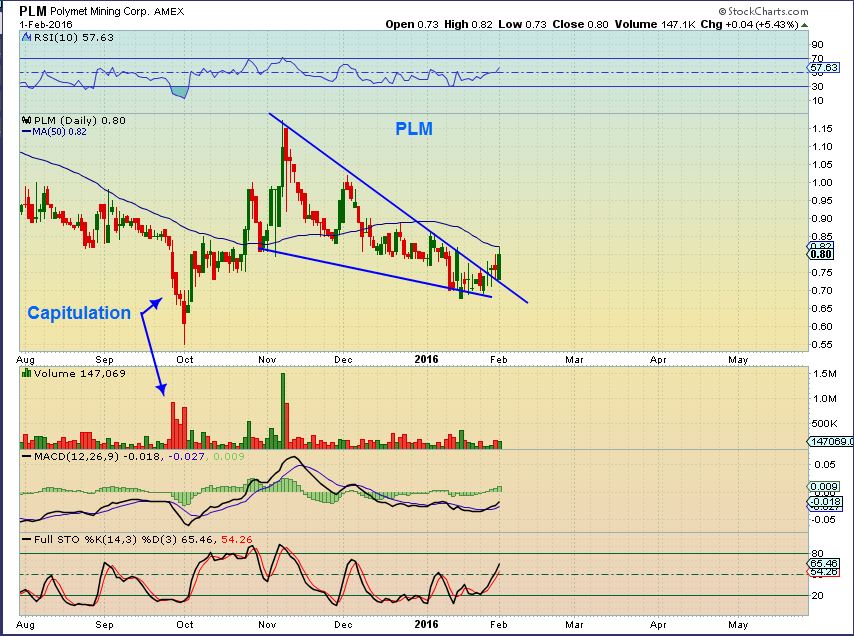
It broke out .  I think it could have a lot more upside, with a possible target  being the former high volume highs getting  tested.

PLM 2-2

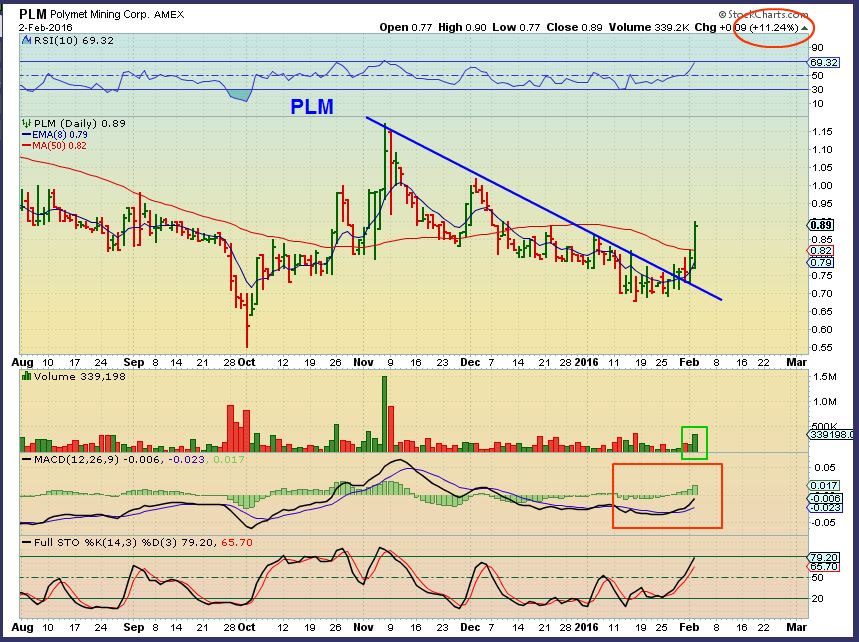
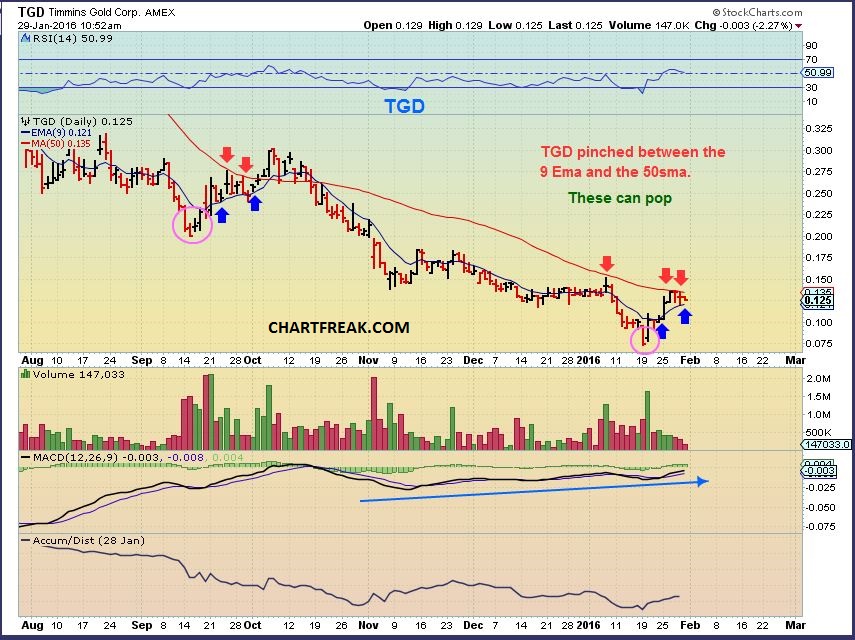
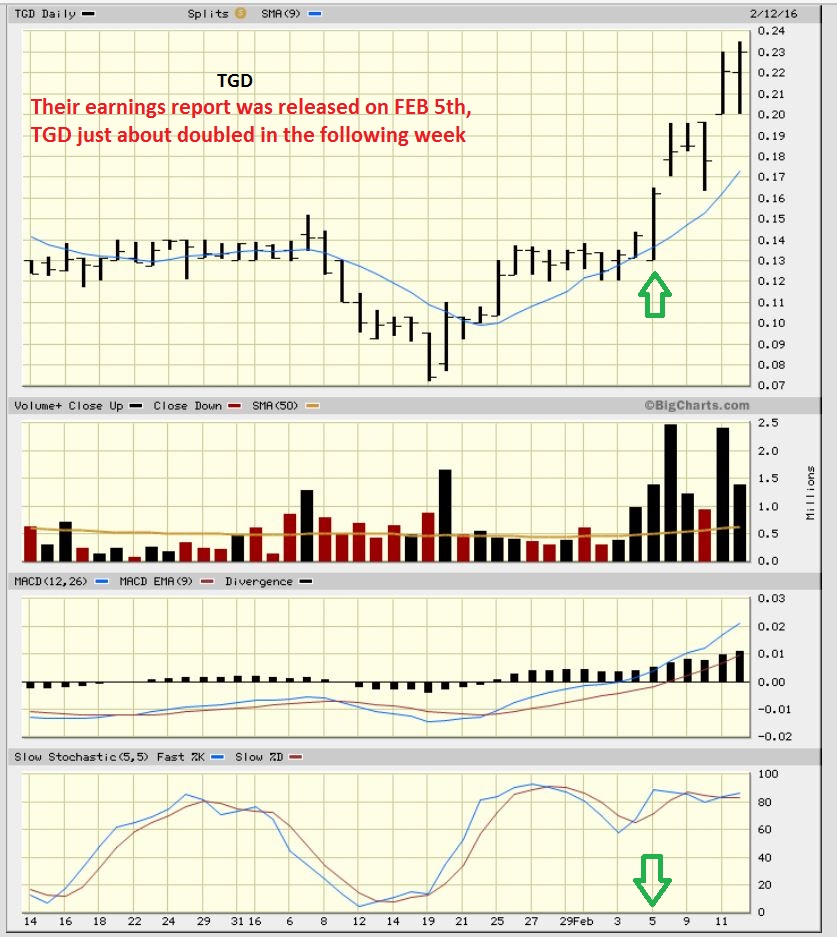
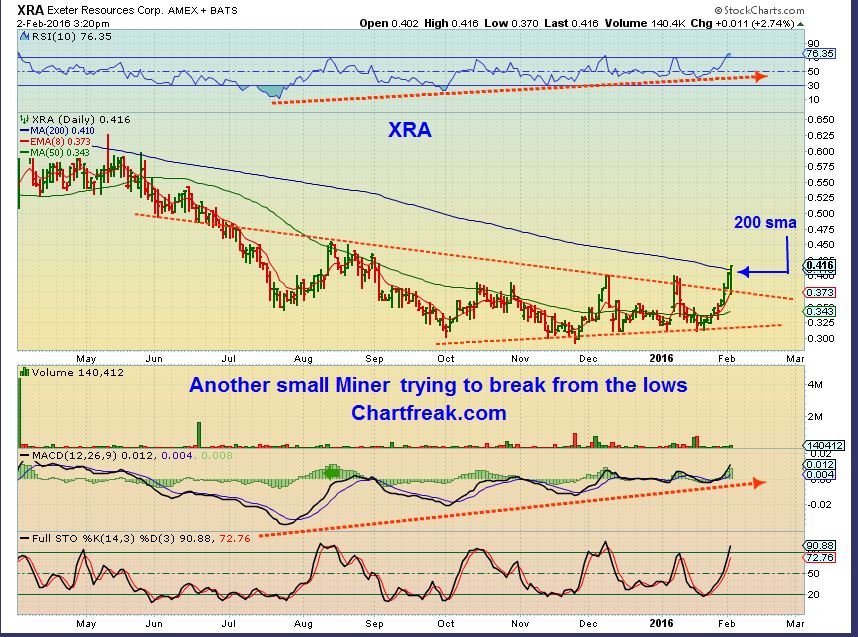
Yesterday when many Miners were selling off a little, we saw another small Junior breaking out over the 200sma.   This is encouraging to the overall big picture. I am starting to wonder how quarterly earnings will be for many miners with OIL & NATGAS  holding at lows for so long now.  Much of the cost of Mining is due to energy –  so low costs can add to their profitability .

XRA 2-2


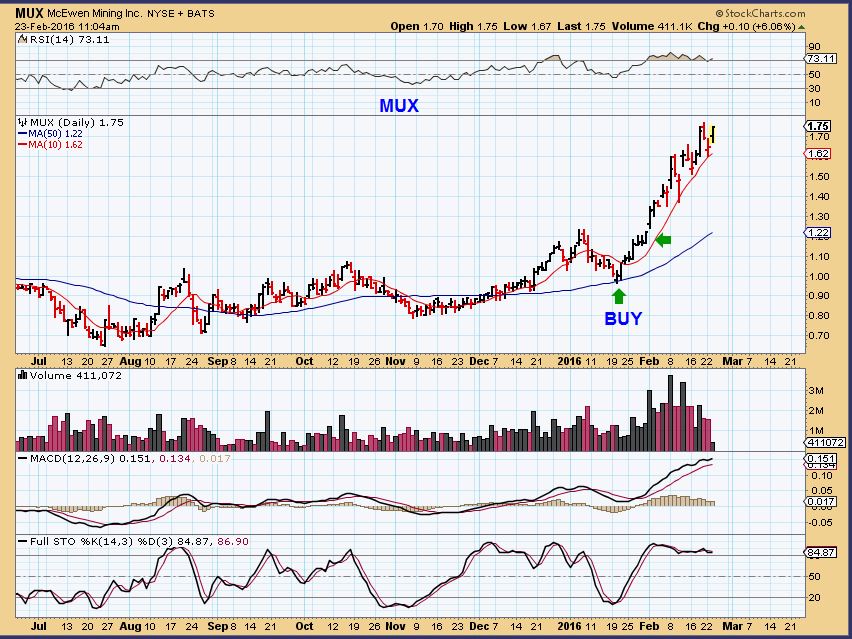
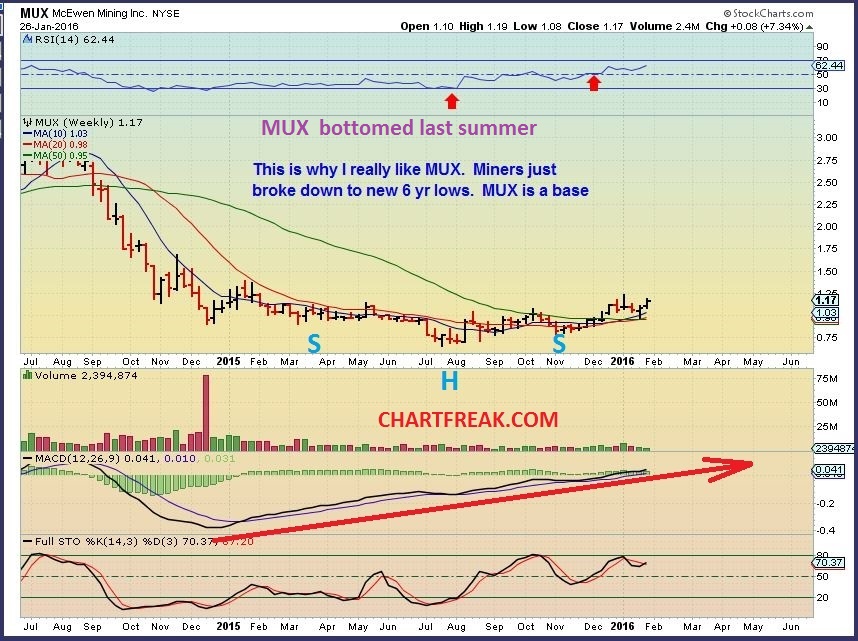
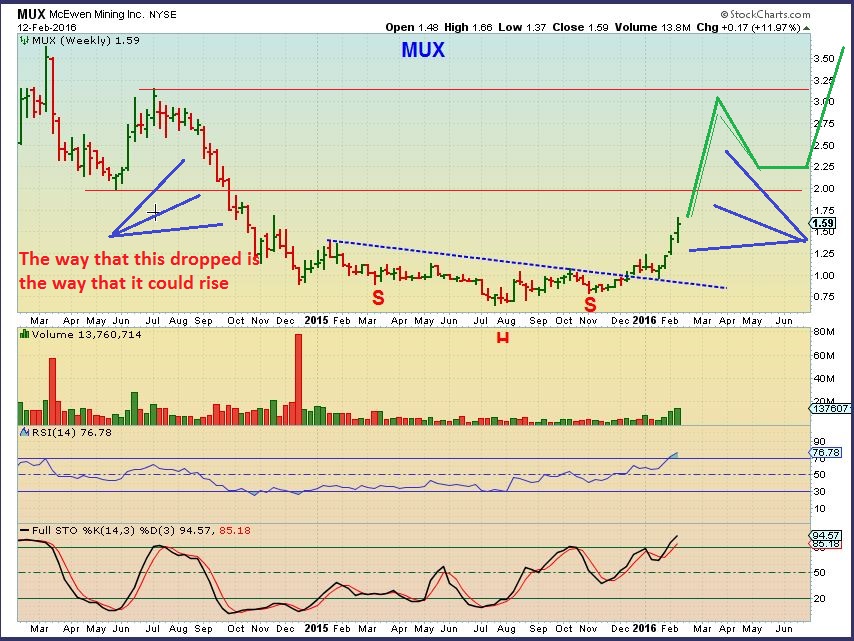
MUX – Have you seen this one lately?   It was a BUY at $1.00.  Its at $1.37 today. 

MUX WKLY 1-26

.

So is SILVER still looking weak and ready to break down to you?   Sure, in these markets anything can happen, so we use stops, but I hope I was able to give you another way of looking at it.  By researching similar chart patterns in the past, we see BULLISH probabilities in Silver .

.

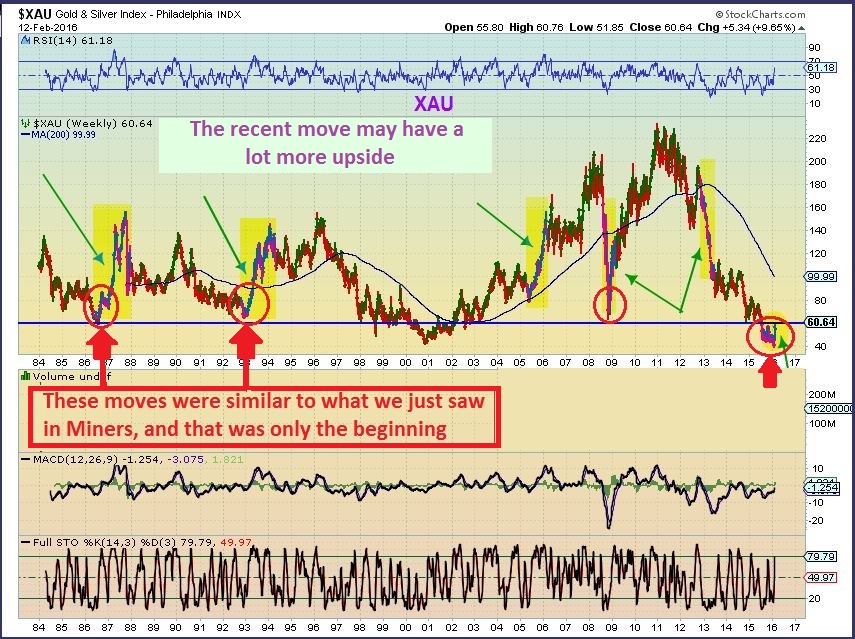
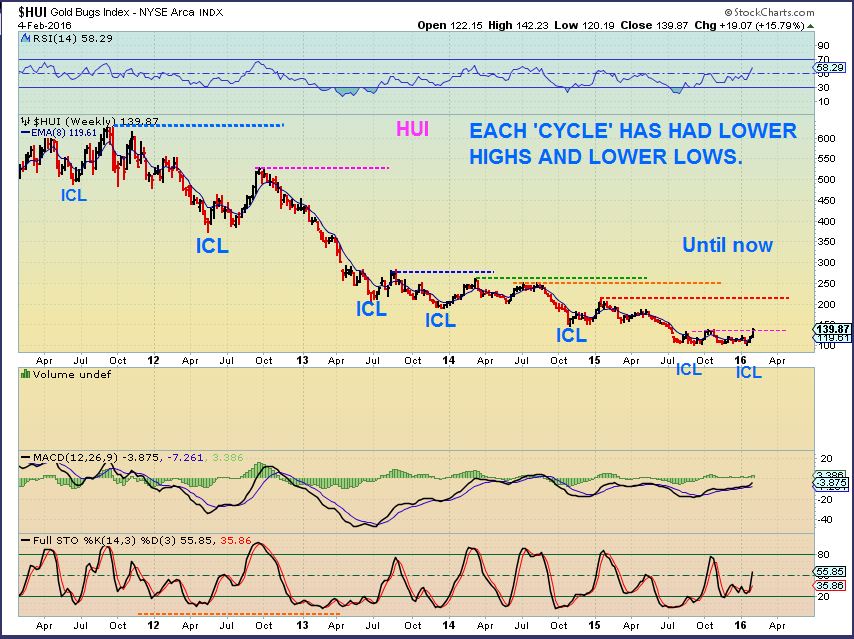
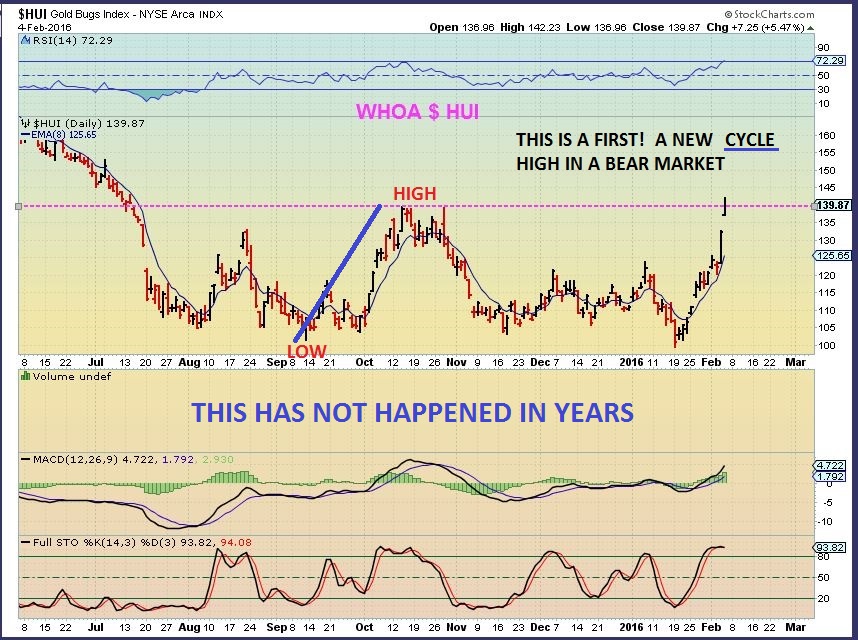
And what about  that BIG PICTURE?  Is it  shaping up at all or still just looking ugly like an ugly  bear market.

.

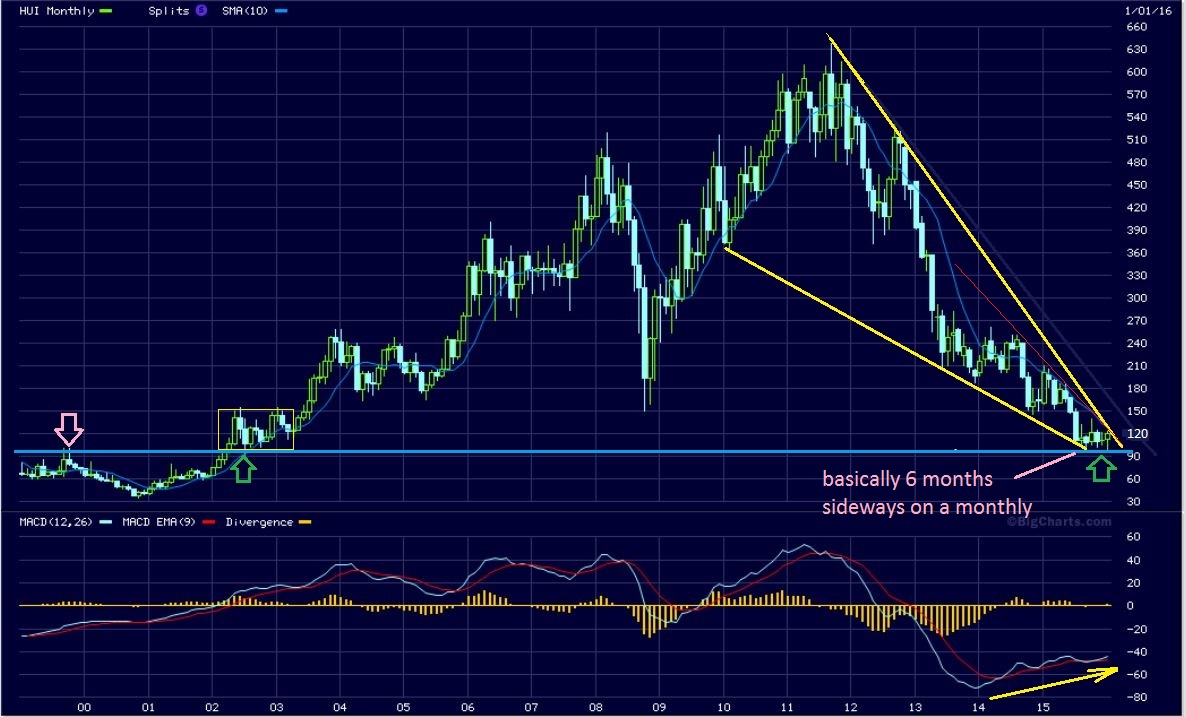
HUI is on support and has been consolidating there for 6  MONTHS.   A break out higher will eventually bring us the best trading that we’ve seen in years.  I have been there in 2000-2008 and 2009 to 2012. Look at  2008 – 2012 on the chart below.    $150 to $630+.   

HUI MONTHLY 3

.

I believe we are close to some very profitable trading for years to come.   Thanks for being here!

.

If you think that getting a second set of eyes on the markets would help you with your trading, why not sign up and try it for a month at $37.95?   You get access to all of my past reports and future reports for the month.   I think the 2 weekend reports that I posted this past weekend alone may  have been worth that.  It added confidence in the Silver set up.  🙂

.

To sign up, click here and scroll down

.

If you do sign up, I recommend reading the last weekend reports as well as yesterday and today .Thanks for being here!

~ALEX

Public Report – Precious Metals Activity

When I drew this chart in December, I was pointing out that I expected the Markets to be topping and Precious metals to possibly be bottoming.  Notice how the 2000 top in the SPX coincided with Miners bottoming.  Also notice how much that 2000 top looked like the markets in December.

. SPX & MINERS

Well, we certainly did see the markets drop though out  almost all of January.

We had a 6 week believable rally out of the summer crash that got the Bulls long again.  I expect that we may something similar now.  But can we say that Miners bottomed,  at least temporarily?

SPX WKLY 1-29

Lets look at Precious Metals

Read More