You are here: Home1 / Public
https://chartfreak.com/wp-content/uploads/sites/18/2016/01/progress.jpg
412
644
Alex - Chart Freak
https://www.chartfreak.com/wp-content/uploads/sites/18/2019/11/Chart-Freak-site-logo.png
Alex - Chart Freak2016-01-29 14:42:072016-01-29 15:07:49PUBLIC POST – PROGRESSHere at Chartfreak , we've been looking at the short term moves for traders that are likely to occur as well as The Big Picture that may be changing. I expected changes, and that is what we have seen developing already in 2016. The weekend report had over 30 charts, so I thought that I would share a couple here with the public readers.
.
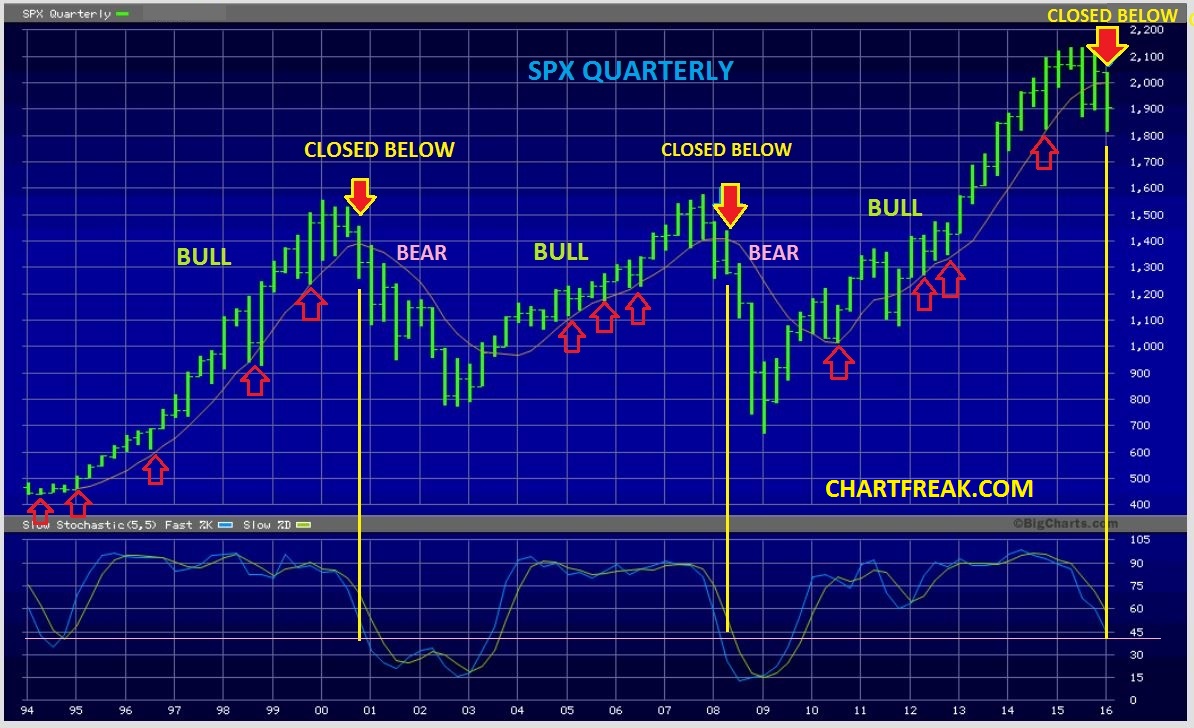
SPX QUARTERLY - They say that a picture is worth 1000 words. This speaks volumes if things dont change in a big way.
Lets look at a few other areas...
Read MoreWe saw quite a few reversals by the close of trading on Wednesday. Below are excerpts From Tuesday nights premium newsletter.
.
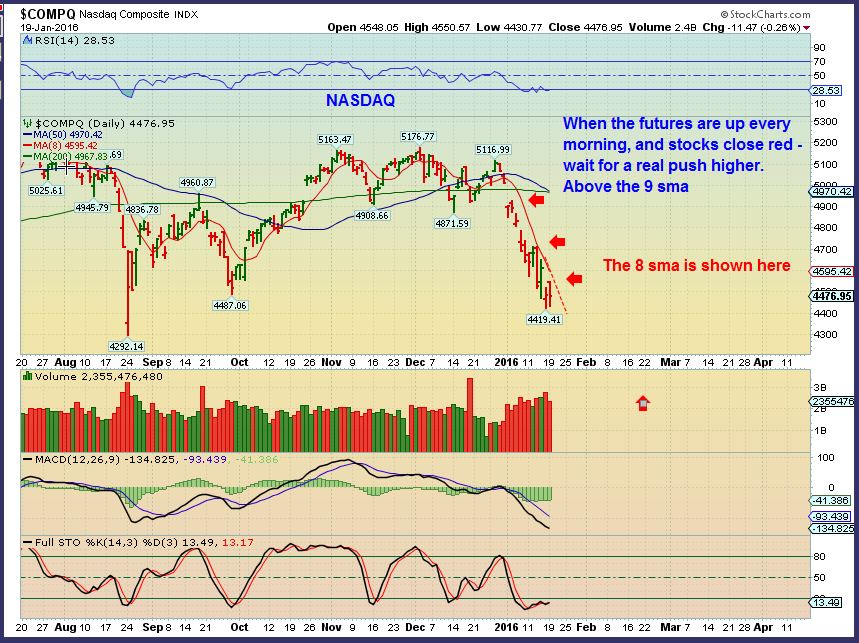
NASDAQ - The futures are up over 100 to 200 points each morning, but the rally fades. What to do? Wait for a reversal and a move above the 9sma to be safe.
Here is the SPX ...
Read MoreIn my last public report, I pointed out that I expected Gold to back test the break out & 50sma area. I posted this chart.
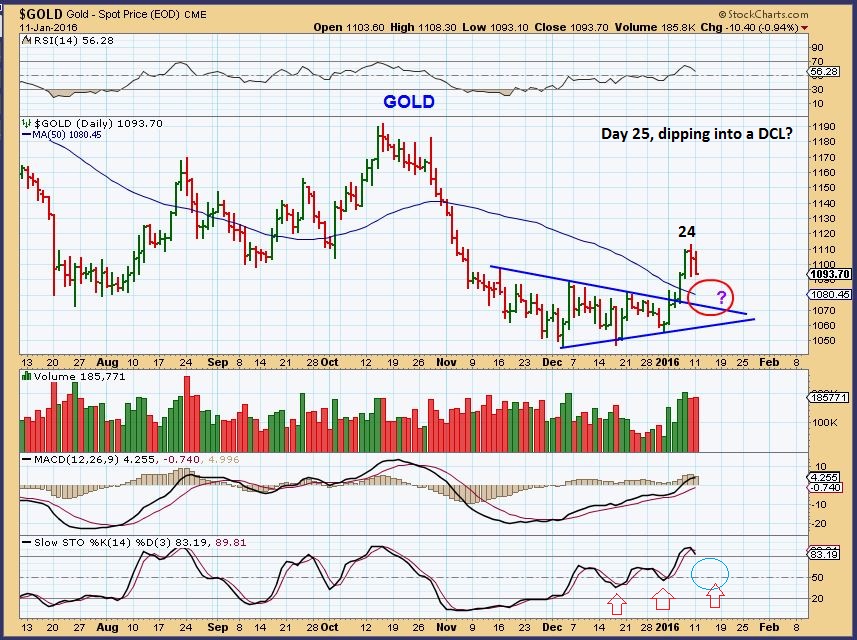
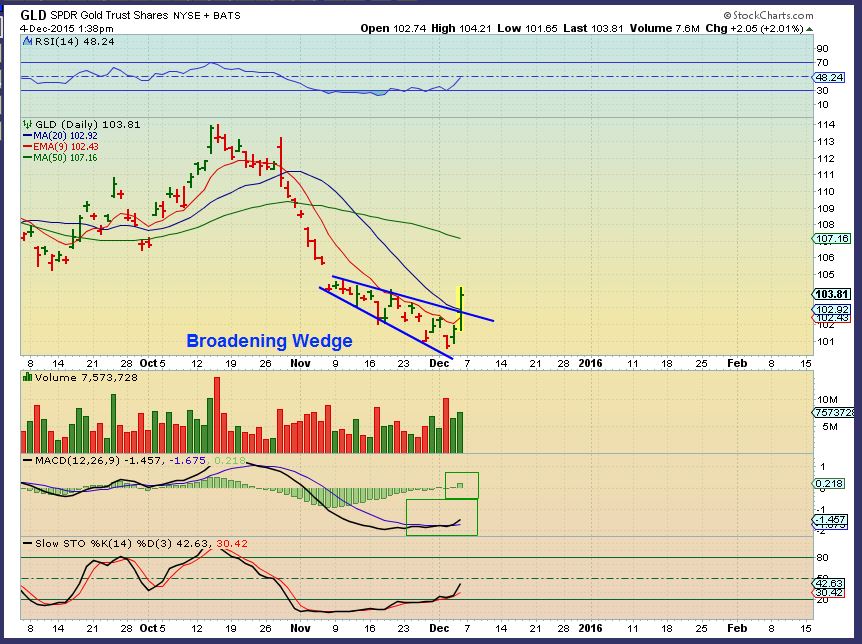
We got a perfect back test as expected and reversal. This chart from Yesterday looks very Bullish, but Miners didnt react strongly.
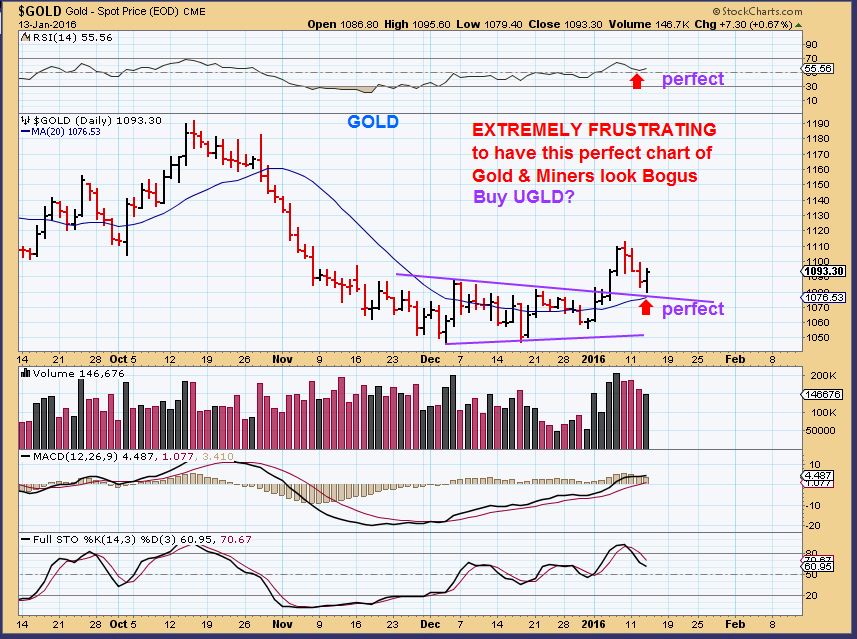
Now Gold is dropping pre-market. What am I looking at today when it comes to Gold?
Read More Most people realize that you can't solve a puzzle by forcing together pieces that dont fit. As time goes by, however, various pieces do come together, and the big picture becomes clearer. That may be happening now, so lets look at some of the pieces of this big picture puzzle.
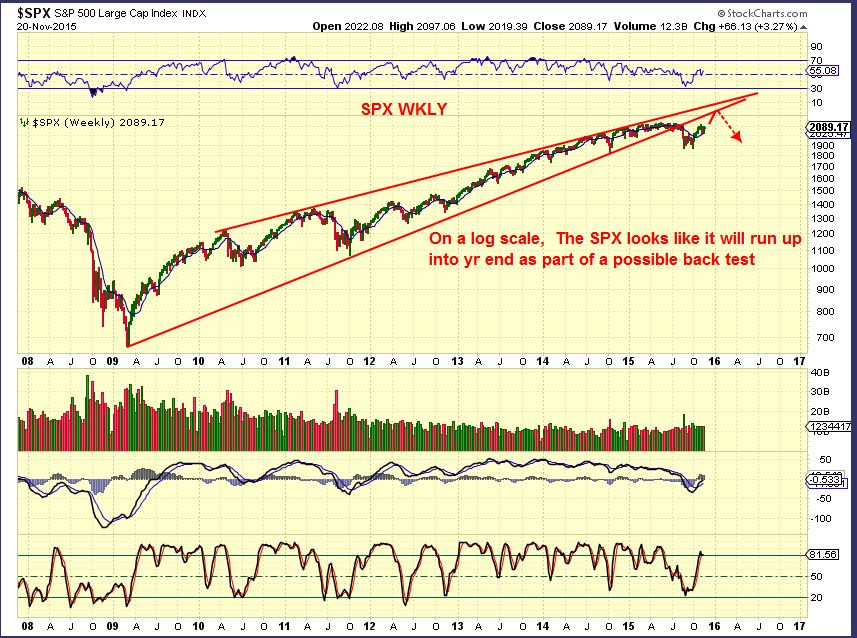
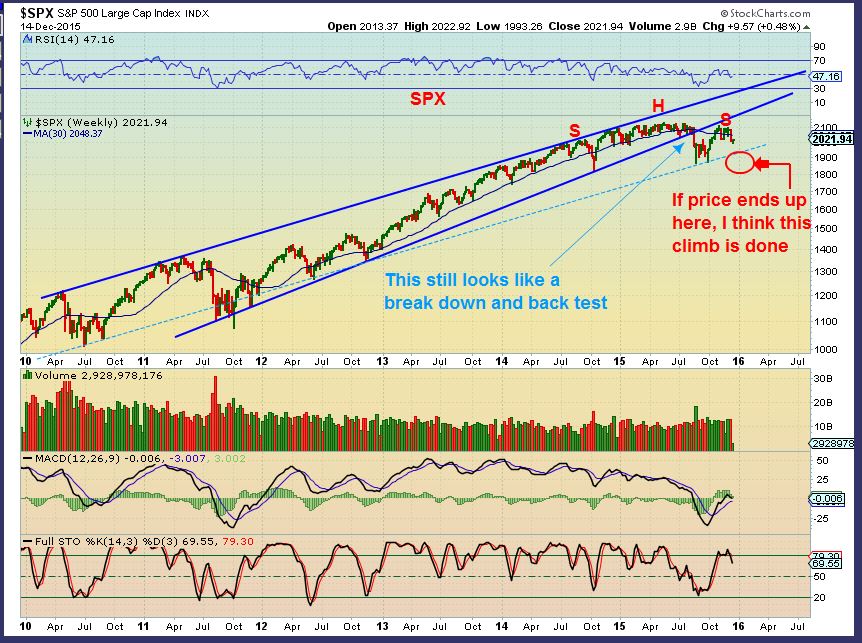
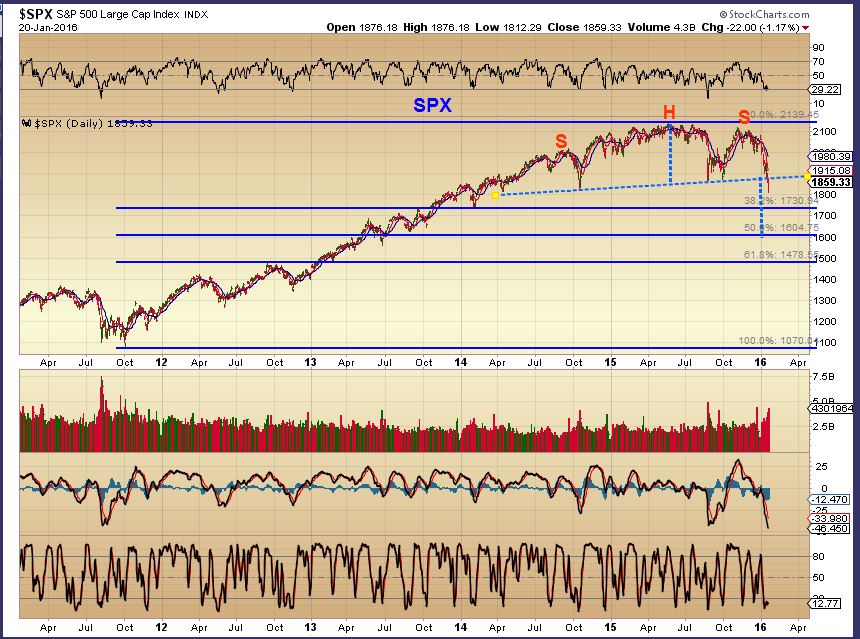
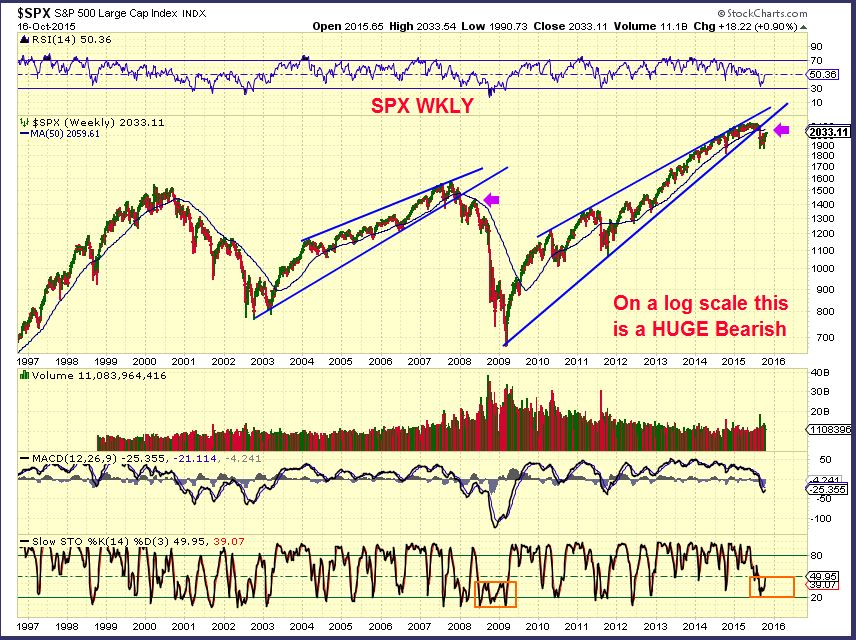
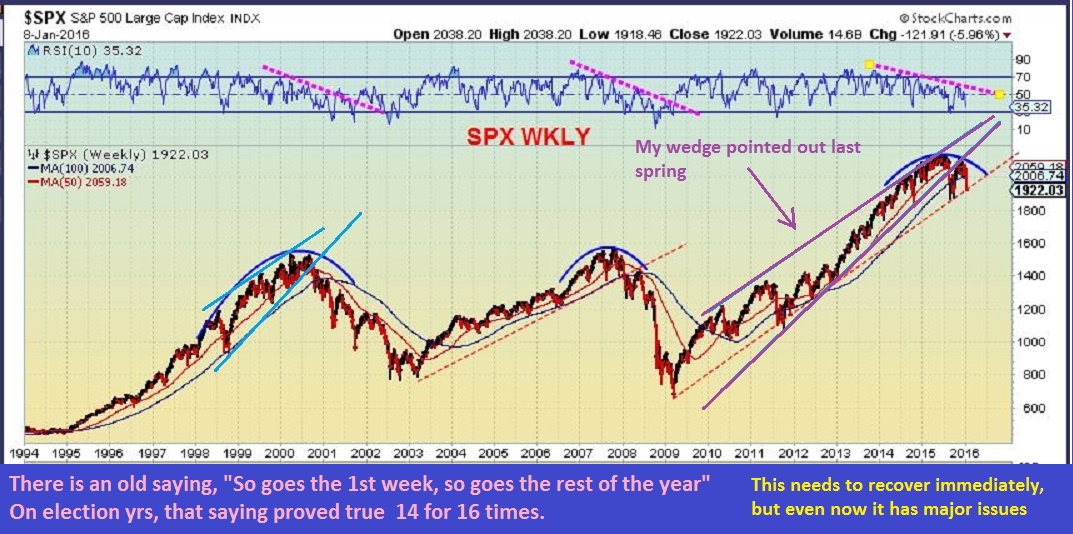
SPX WKLY- I had pointed out a bearish rising wedge forming in the SPX since last spring & last summer. After a break down this summer and back test, we had further selling as 2016 began. Is it done?
.
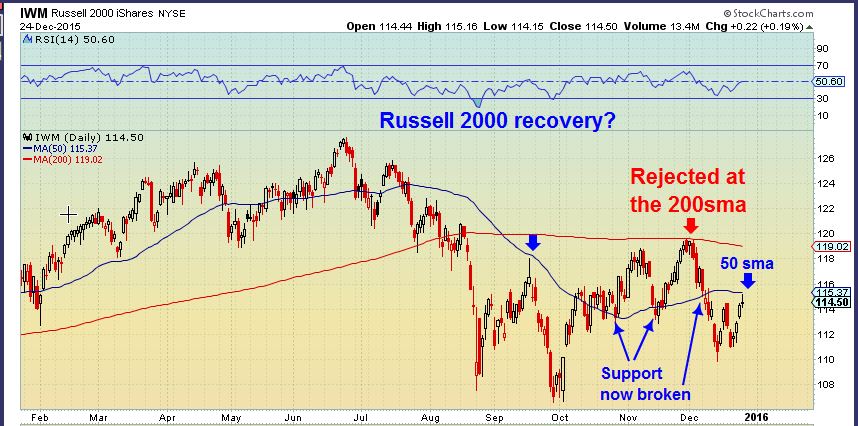
$RUT - The TRAN and RUT look to be starting lower highs and lower lows. We could get a bounce soon, but you can see that with further selling this could easily drop to the 800 area.
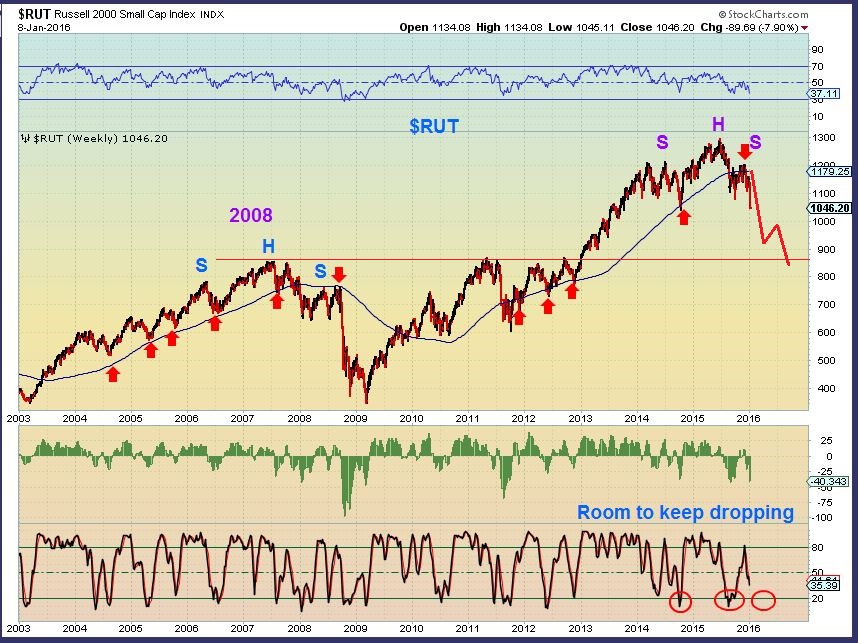
Might a falling market help Miners, or do they all fall together?
Read MoreThe Precious Metals markets have been tricky lately, selling off to new lows day after day. There were clues along the way that were foretelling the big move that we see today. You can read my last report here under the public blog to see what I was looking at and expecting. This update will give add recent charts used in this weeks reports.
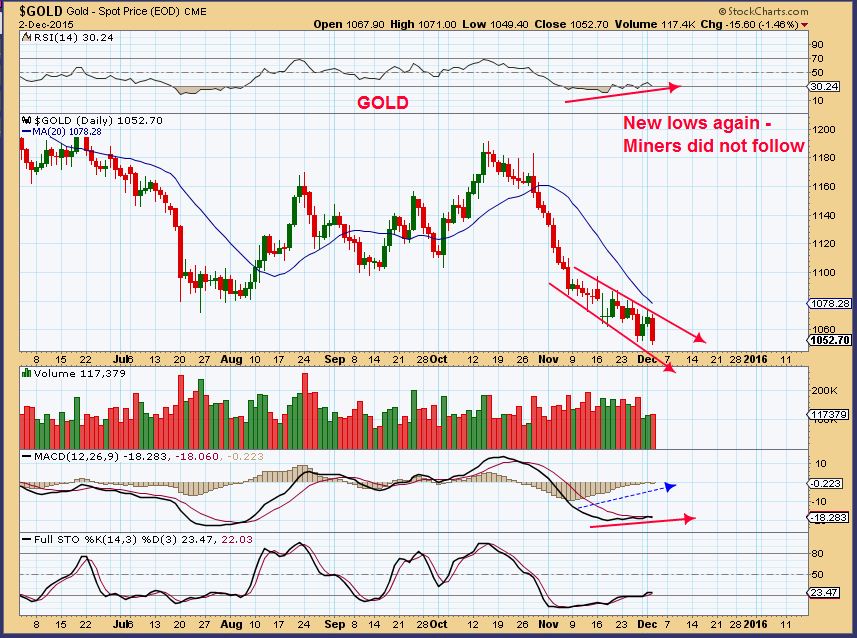
GOLD DEC 2 - Prices kept hitting new lows, but the Miners were staying above their 10sma. I was pointing out that the rising MACD and the C.O.T. report were actually just a couple of the Bullish signs indicating that soon Gold & Silver should rally higher.
This is the GLD today
Read MoreI received a good number of emails where people said that they were “Going short for the final plunge in Gold below $1000!”. I’m not saying that that plunge wont come, but does the evidence point to last weeks break down being the signal to go short? Lets look at some charts and see what I wrote in my weekend report.
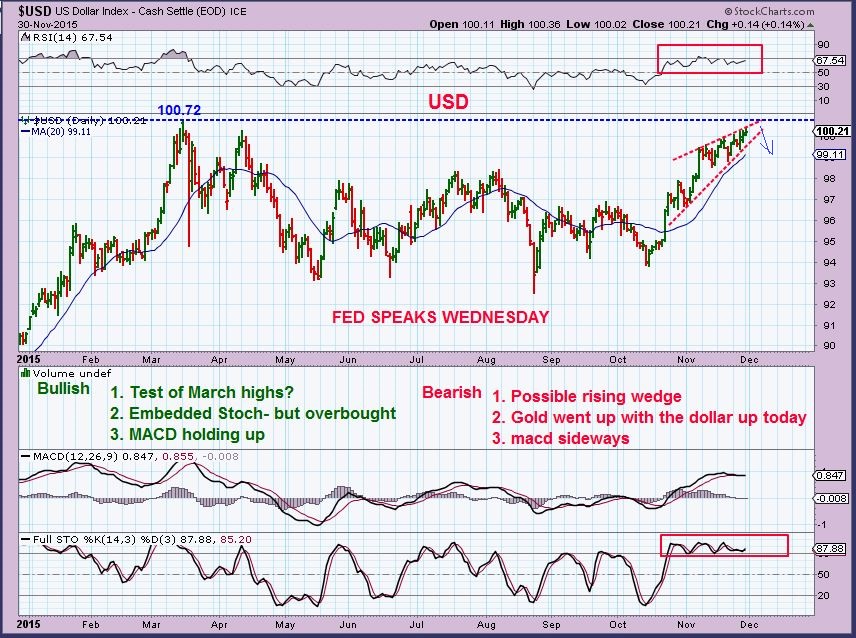
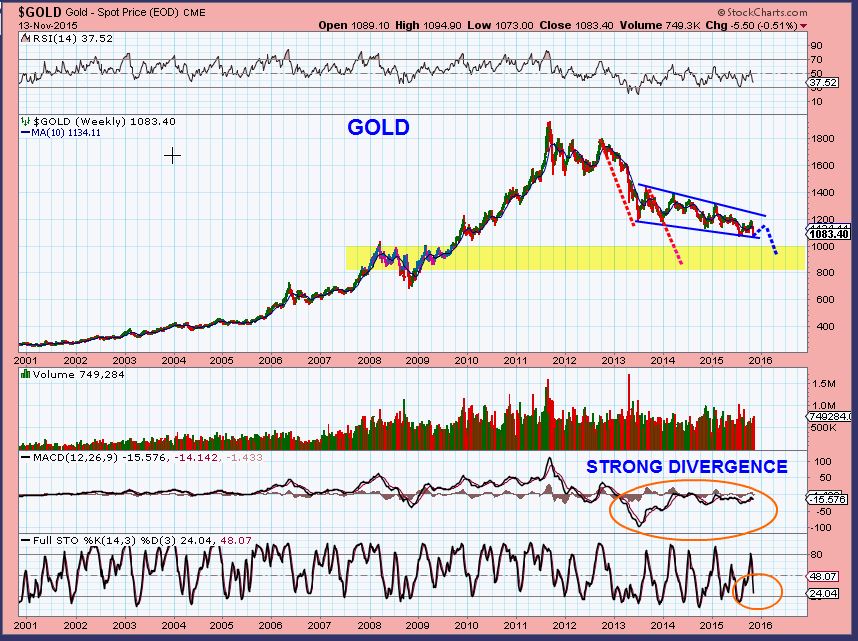
The USD Wkly looks strong and has weakened Gold, but will it break out & run or might it pause or even double top?
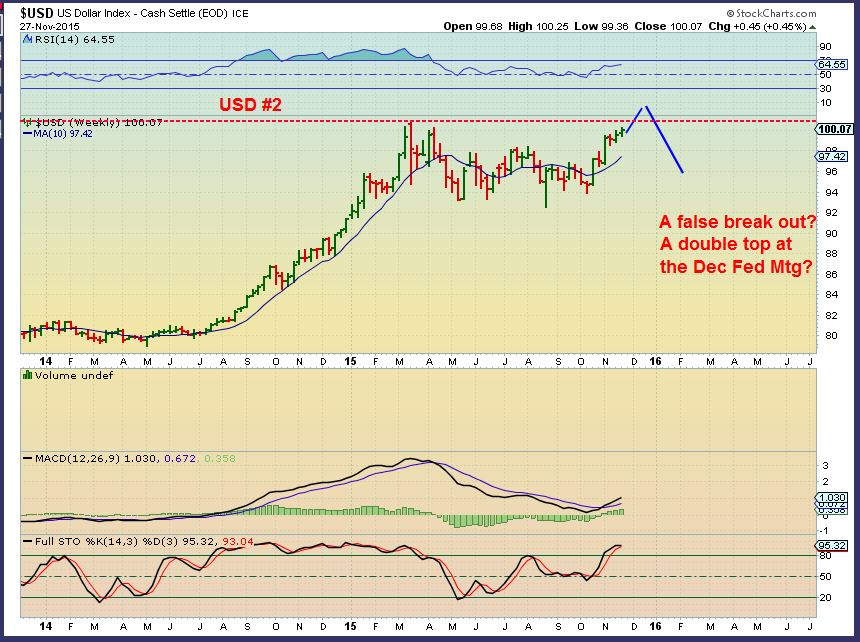
If this is a rising wedge, the dollar will stall (or fall) and Gold could pop. I wrote a few bullish and bearish points on the chart.
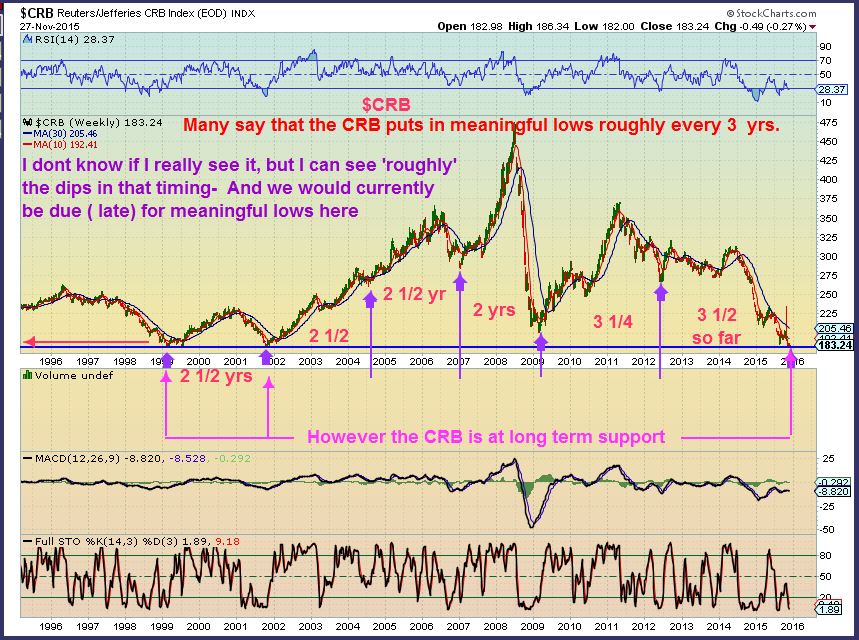
THE CRB – If the DOLLAR double tops, the CRB would likely bottom. It is at support and overdue for a 3 yr cycle low. This would imply that the Dollar will top.
Lets talk about what happened in GOLD last week.
EDIT: This is from the weekend report unless I note otherwise
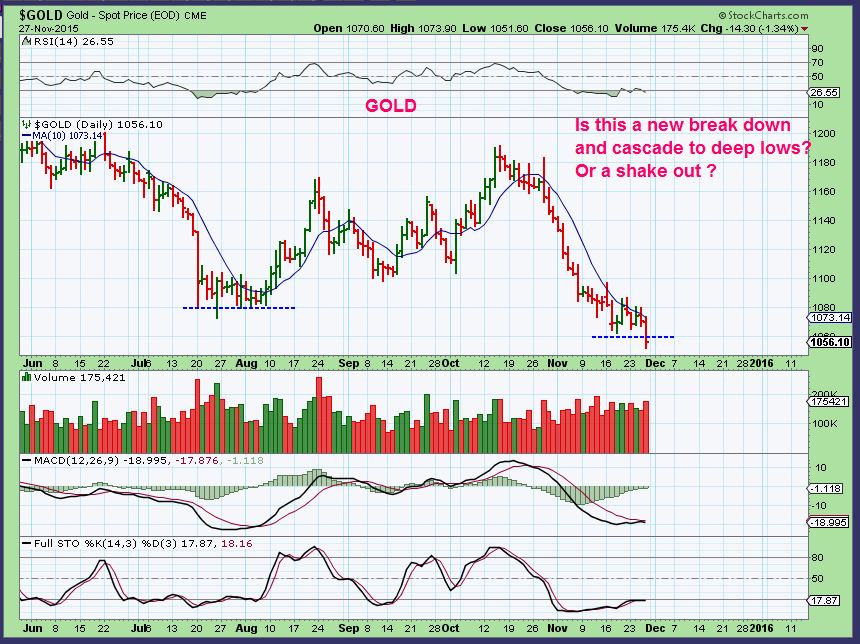
GOLD – Friday New lows. Please note that Silver & Miners are not following. They usually lead the way down. With that I have to wonder if this is a final shake out similar to that quick drop in July? Many have gone short & are bearish now again.
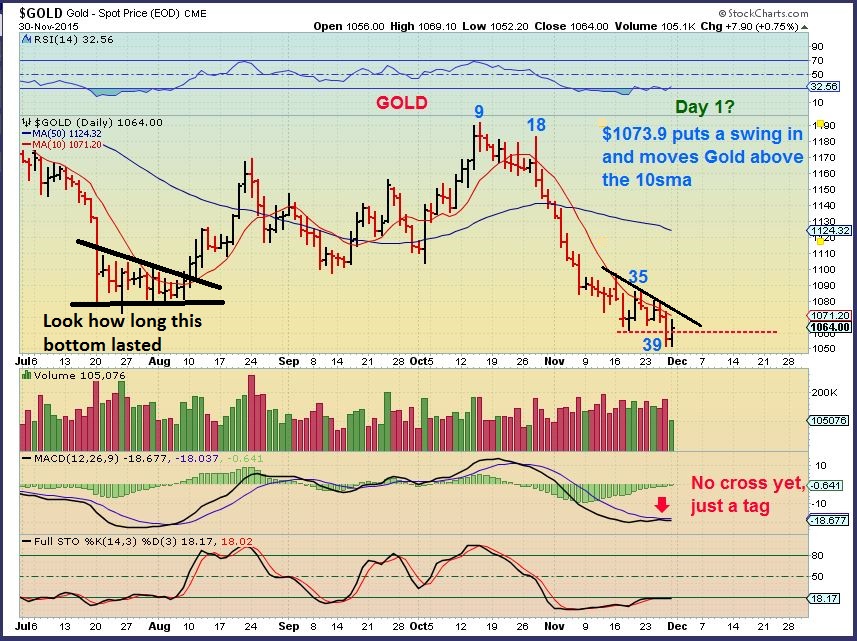
UPDATE : Monday Gold recovered while the USD went higher.
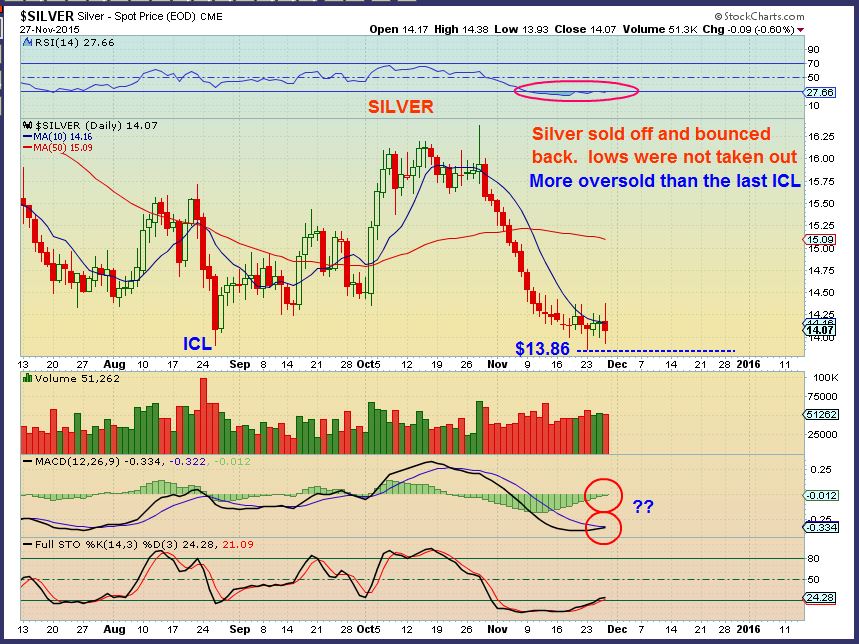
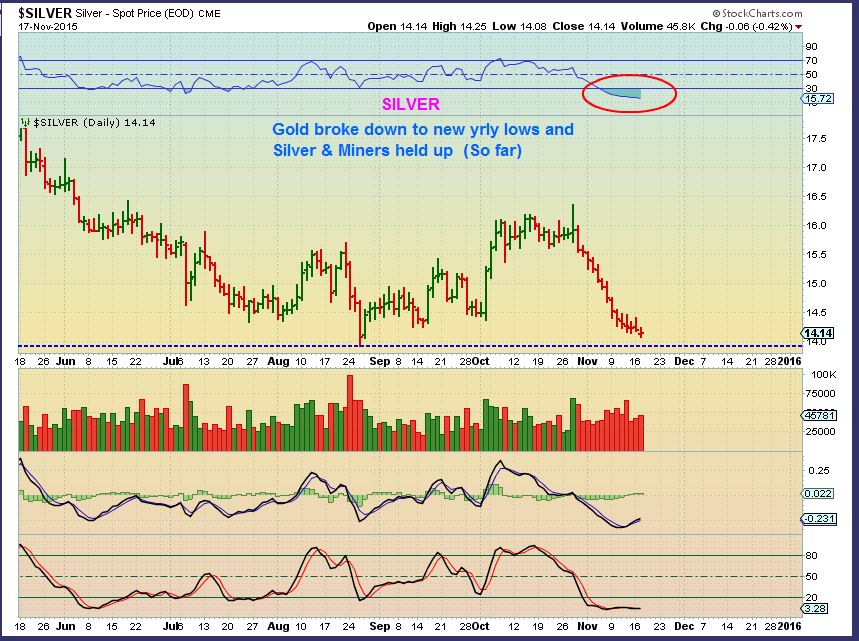
SILVER– Silver held recent Nov 23 lows as it sold off and reversed higher Friday. In fact, the MACD is trying to cross upward at these lows. I would be nervous “Shorting Silver” here. It didn’t drop to new lows with Gold and the MACD is gaining traction.
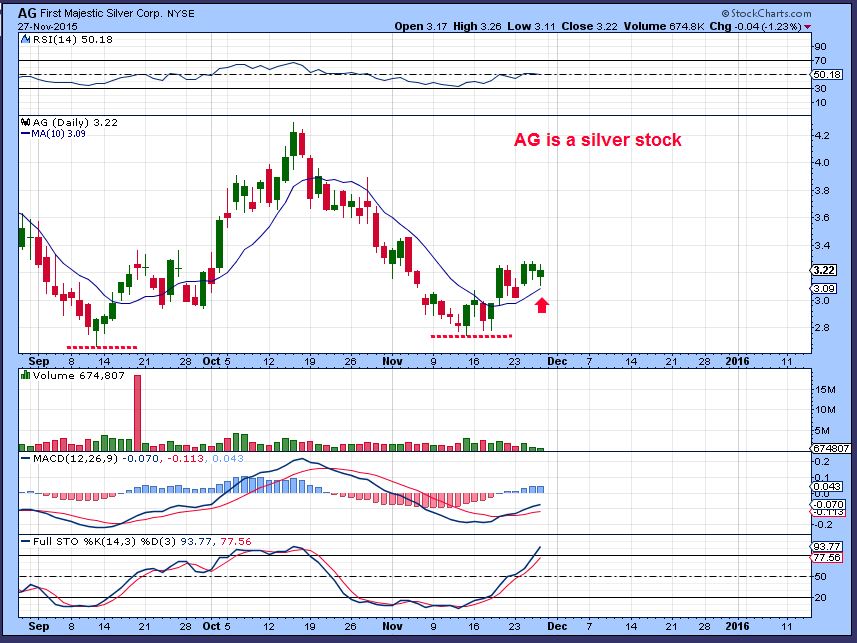
AG – Is a silver stock. This looks strong for what happened this past week.
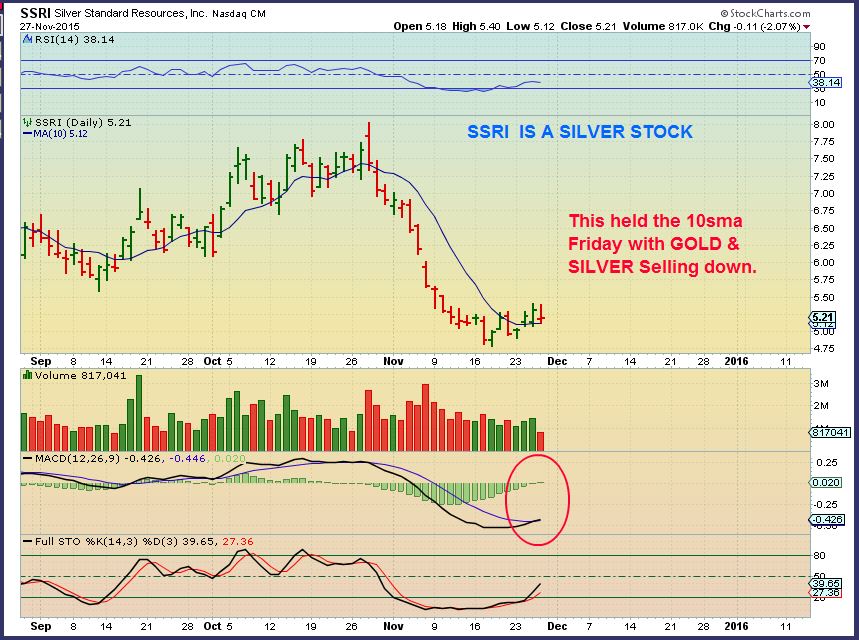
SSRI – A Silver stock that is holding up on the 10sma despite recent selling.
GDX – I drew this mid day Friday to show that GOLD broke to new lows and was staying down there, but Miners held their Sept 11 lows, and also didnt break the recent November lows from a week ago. HMMM 
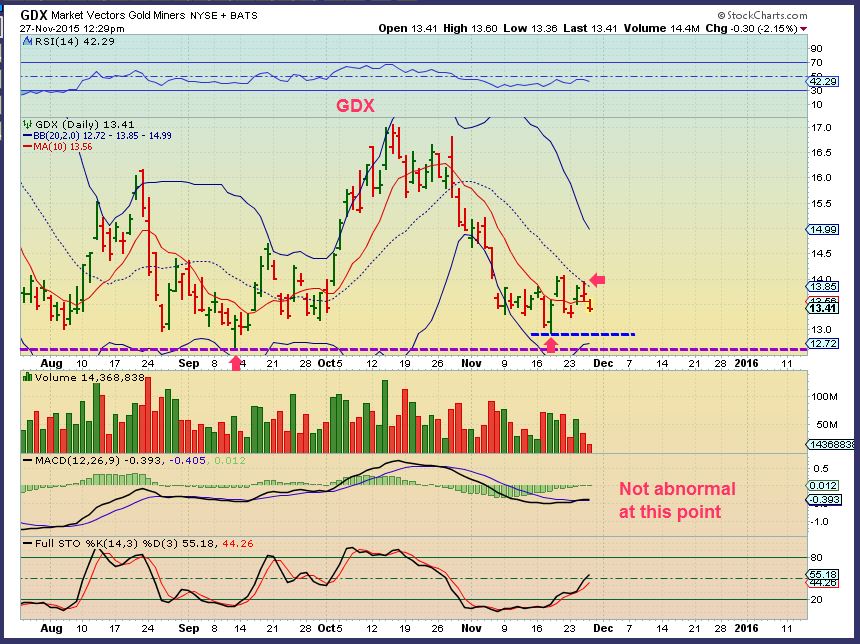
UPDATE AS OF MONDAY : So look at components of GDX. Is this a sign that Gold is about to plunge after breaking to new lows? or does this look like smart money could be accumulating Miners? Should you short this?
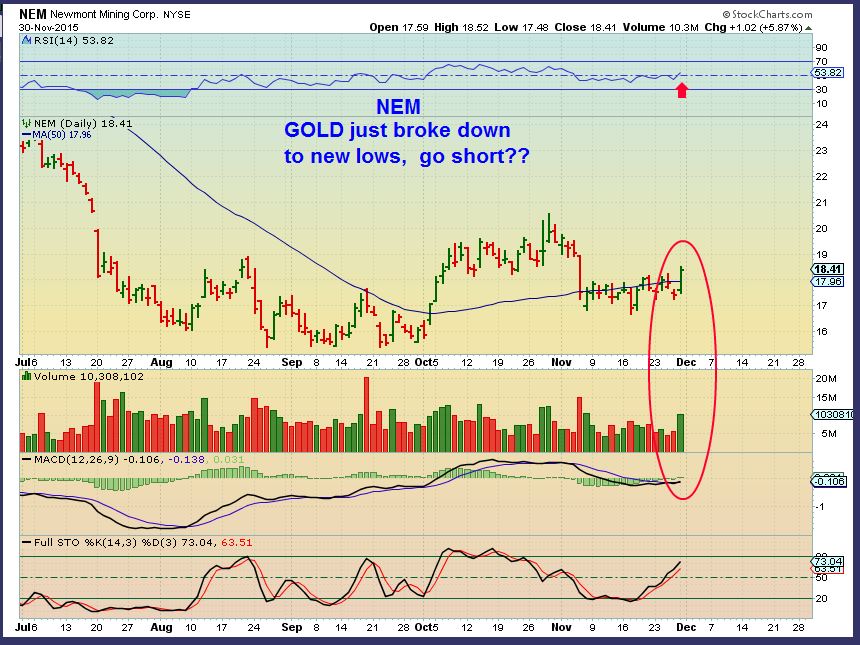
NEM – Gold broke down to new lows, NEM looks strong.
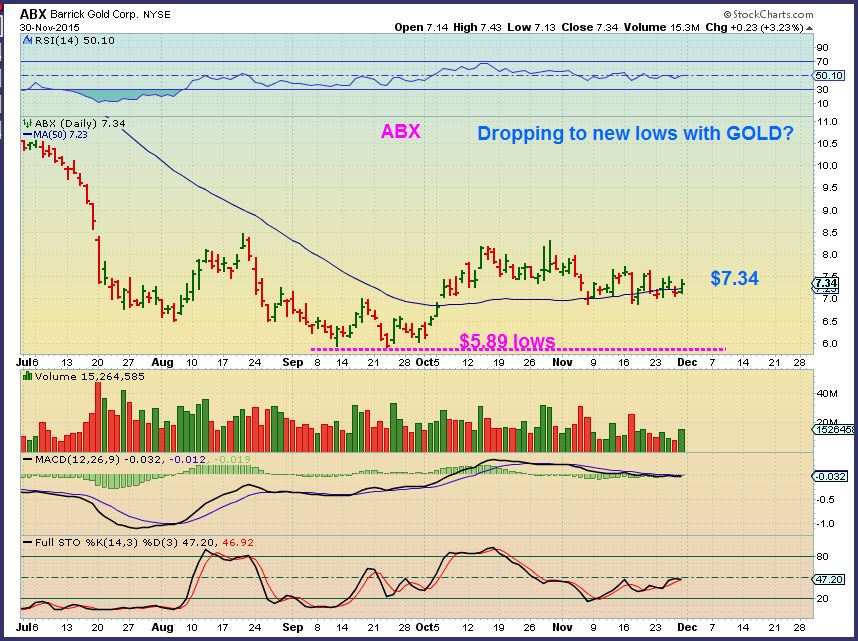
ABX – Gold broke to new lows, ABX is holding up well.
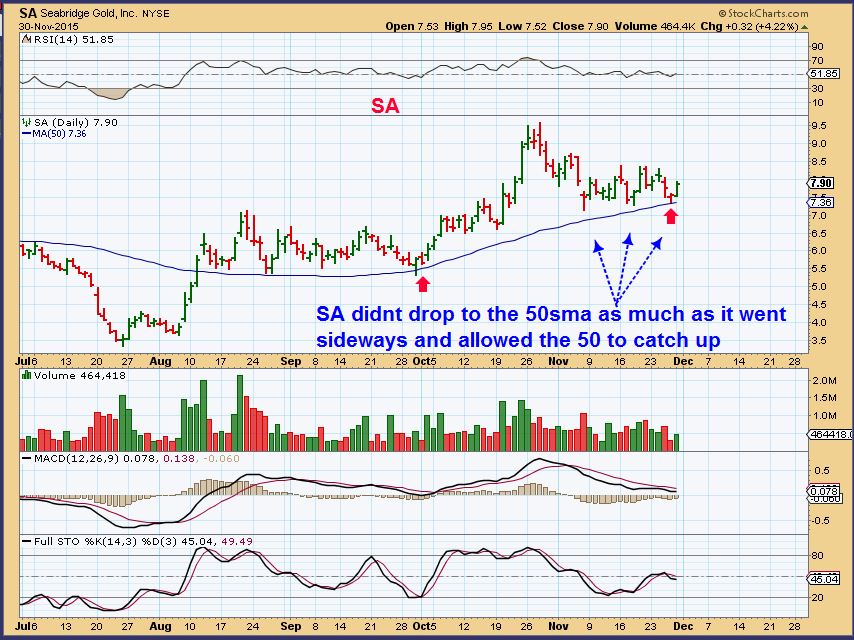
SA – Another Gold stock that is ignoring Golds drop. This set up was actually being pointed out as a buy at the 50sma for the past week.
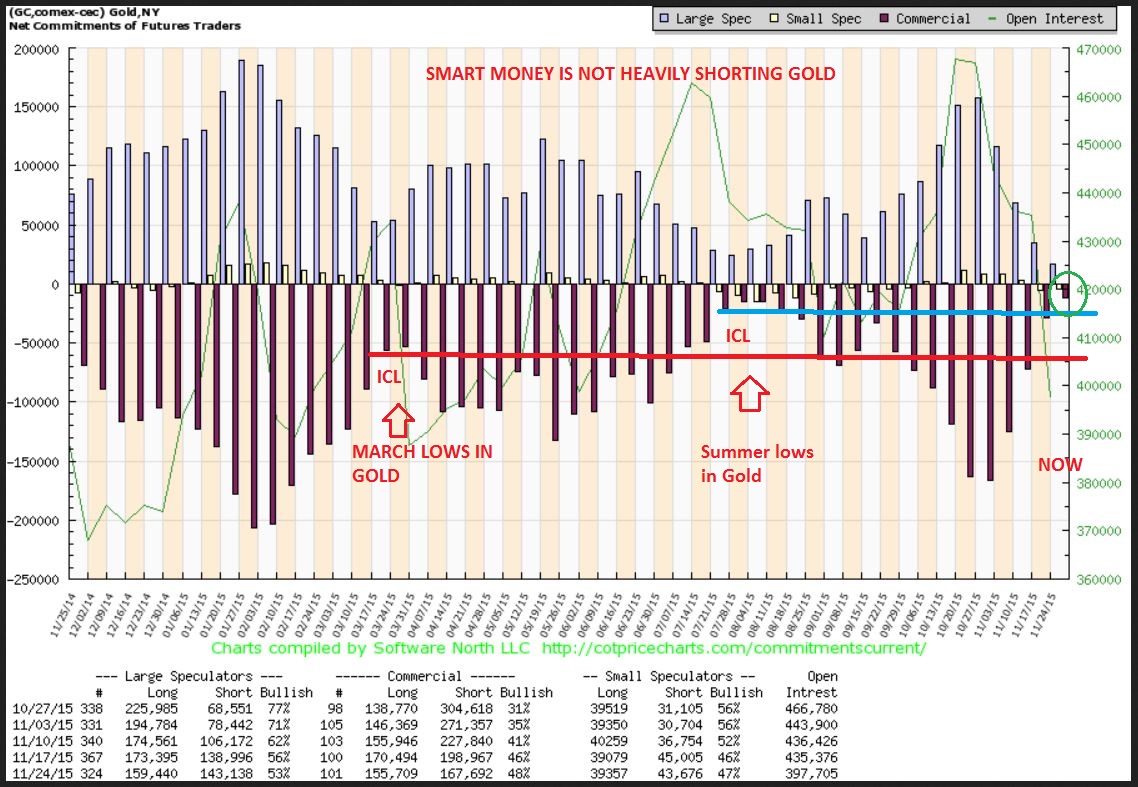
Finally, this is the C.O.T. released Monday. It shows that SMARTMONEY has bailed out on their shorts for Gold. They are NOT heavily short Gold. The prior lows for GOLD are pointed out, and smart money shorts are less now than they were at the prior lows. Should you be shorting when SMARTMONEY is not?
GOLD broke down to new lows Friday and I read on stocktwits and in other areas that many people were now shorting. Silver and Miners didn’t follow as shown above. In fact, some Silver & Gold Mining stocks are even holding their 10sma as of Friday. The C.O.T. shows that Smart money was rapidly closing their short positions. In my weekend report I was pointing out that by leaving emotions about that break down aside, the evidence was bullish too. Monday we saw GOLD recover and Miners move higher, while the dollar was green too. If you are short, you must make sure you have stops in place. I believe we could Rally or have a good bounce at least.
Thank you for stopping by and reading along at chartfreak. If this is the type of analysis that may help you in your trading, why not sign up for a month and try it out. It is only $37.95 for 1 month. You can also sign up for free email alerts to let you know when these free posts are released. Again thanks for being here and happy trading!
~ALEX
We saw GOLD break to new yearly lows Tuesday and I read in several different places that people were going short for the drop below $1000 (Again). From what I was seeing, it was not time to be going short. I discussed that in my Tuesday night report and will post some of that discussion here in the public report.
GOLD SILVER & MINERS
This is the big story. With Yesterdays break down in Gold ( breaking the July lows and breaking to new yearly lows), many have gone short expecting their crash to $1000 to finally come in capitulation fashion. I believe that this will not crescendo into a crash mode at this point, so I would not recommend going short here.
.
2 possible ideas on my mind – we should quickly review both since we cannot tell at this point which one will occur.
I have mentioned both of these ideas already in recent reports, this is a review.
.
1. Gold will either find a dcl (Daily cycle low) soon and bounce. If we get a 4th daily cycle, that bounce will roll over, followed by another dip lower into final and much deeper lows
or
2. We will put in that deep trade-able low (ICL) and rapidly move higher from here very soon.
.
( 1. From above ) Timing-wise I wouldn’t be shorting because a daily cycle low in GOLD & MINERS is due. IF we only get that 4th daily cycle… That would produce a “Bounce” and my chart from the weekend report would play out like this. You could then short that bounce.
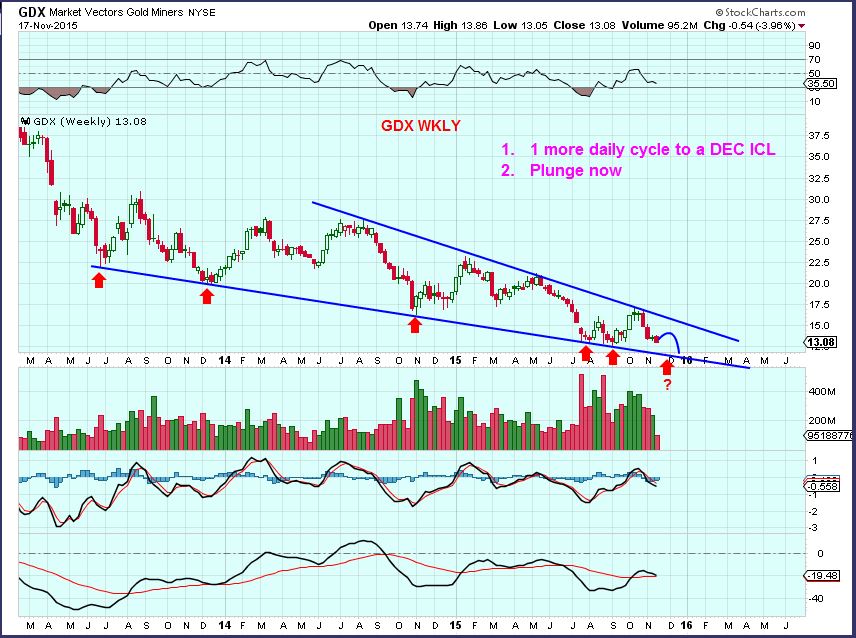
( 2. From above ) I drew this in my Nov 4th report. An ICL in mid November would match what we have seen recently. ICL’s have been arriving faster at 4 month intervals in very steep drops. You can see that we are now at the time that I pointed out as a time to watch for signs of a low.
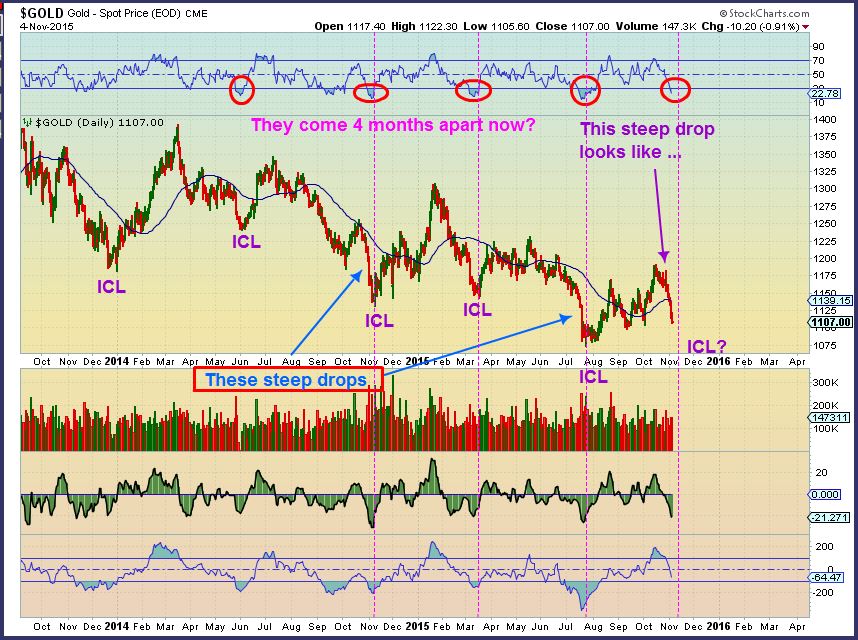
Yesterday GOLD broke to new fresh lows. You can see that we are in the timing that a low is due to be put in place at day 32. It could be that ICL and we could then move higher for weeks. Now that many are shorting and the COT has been improving, this could be the case ( Wednesday afternoon is the release of Fed Minutes). We wont really know until the move starts unfolding. A 4th daily cycle would become weak and roll over as left translated by day 5-8 most likely.

GOLD CURRENTLY – We saw GOLD undercut last night and reverse higher. That could be the “test of the lows”. Lets see if it holds.
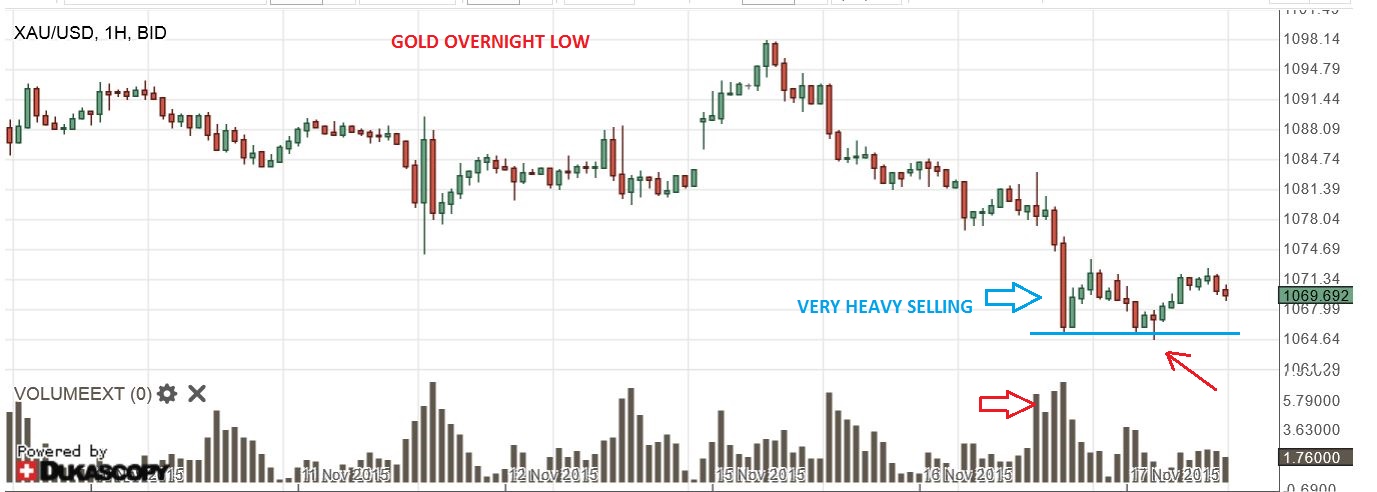
As GOLD broke down to new yrly lows, it is good to note that both SILVER & THE MINERS did NOT break to new lows (yet) . Silver & Miners usually lead moves down and up. Is this a sign of strength in the lead sectors, or will they play catch up in a final drop? We’ll know after we bounce.
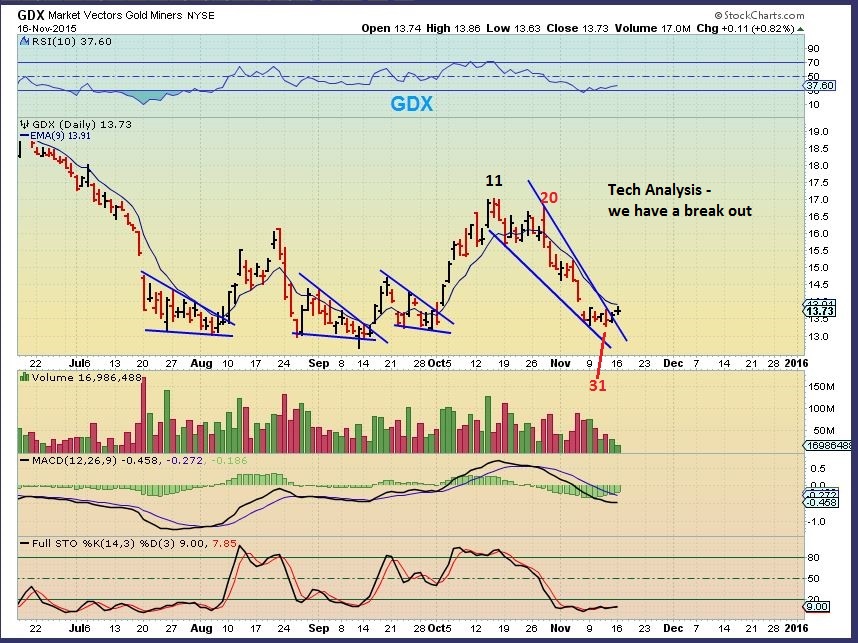
On the Nov 16 chart of GDX , I mentioned how we had a swing low in place in July, and then it got undercut (Shake out). I pointed that out so that if it happens again, we have expected that possibility and it doesn’t surprise us . We did undercut lows yesterday too. Lets review.
The chart from the Monday night report – read what was written on the left side about that low being undercut. Price was rejected at the 9 EMA Nov 16.
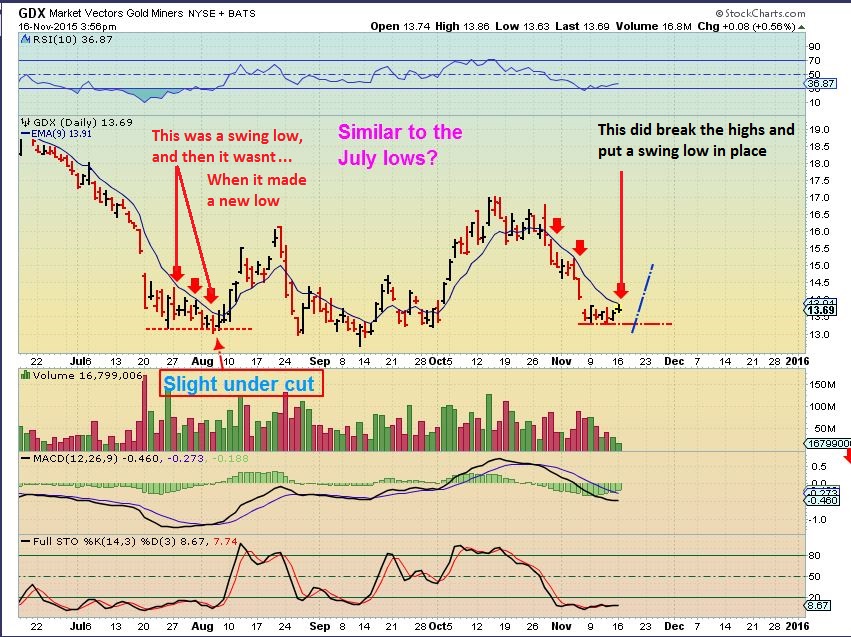
Another chart of GDX showed these wedges. I wrote in my report that these can drop and test the break out too.
GDX yesterday – GDX can drop further, but on day 33 I personally would not be shorting Miners now. They are due to move higher.
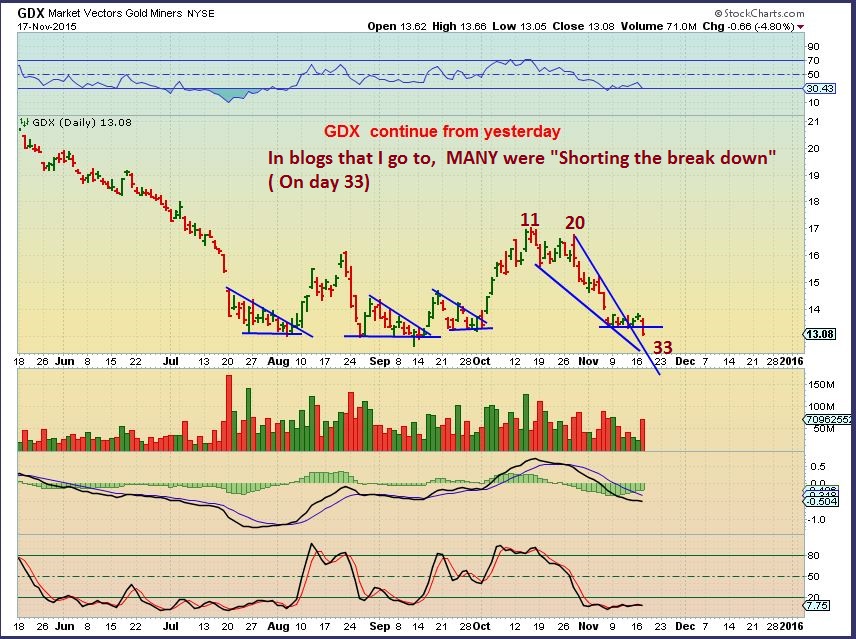
In conclusion – You may want to try to catch the lows for a trade , but remember that if this is a 4th daily cycle, it will roll over soon ( And DUST may be the trade at that point).
What would GDX look like if it just bounces and rolls over? Does it fit the big picture view? Yes. A bounce & Tag would lead to the Dec Fed Mtg.
Today the FED minutes are to be released. On that Fed Wednesday Gold reversed lower quickly and started its sell off. We had volatility. Wouldn’t it seem odd that the release of the minutes would now cause a reversal and a run higher? We are due for a low though, and odd things do happen in these markets.
So at this point I am advising patience to see what happens after the Fed Minutes are released. Some traders will buy the reversal with a stop below the lows. For conservative traders, even with an ICL you do not need to catch the lows the minute that they happen. I will discuss other options in the Thursday report. Experienced traders can use the above report and the weekend report as a guide of possibilities to enhance their own trading style. As you can see from this report, there are still a number of possibilities that lie immediately ahead. Best wishes!
~ALEX
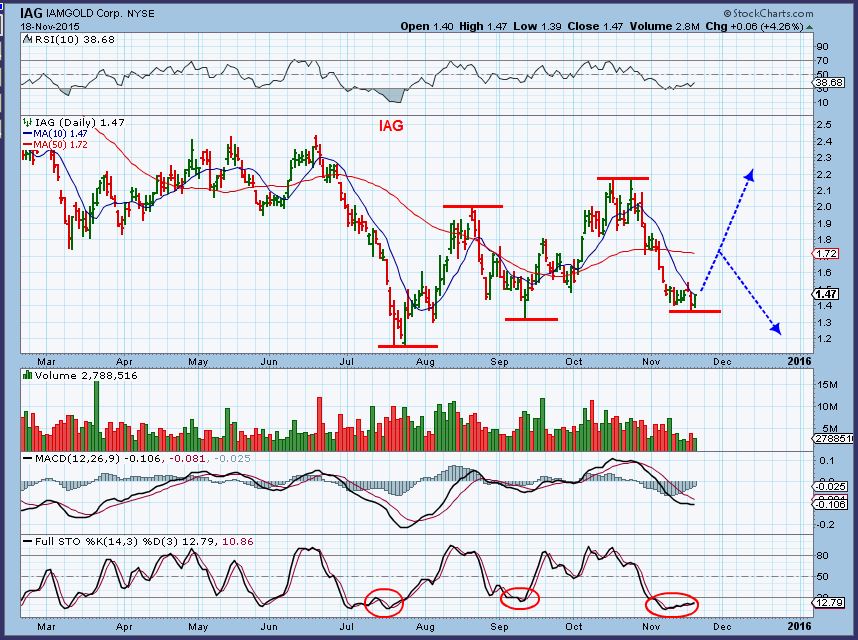
EDIT: We are currently experiencing the move higher in Gold & Miners that I was expecting. The above report is only part of the daily report for Fed Wednesday. I also covered the SPX, USD, WTIC, XLE, NATGAS, etc. A second set of eyes is often helpful in understanding the markets. If you think this type of analysis can improve your view of the markets, help you trade better, etc., I invite you to sign up for the premium reports. For only $37.95/ month you get 4 or 5 reports per week. When lower risk trade opportunities present themselves, I do point out ideas such as the below chart that was in this mornings report. The 2 arrows point out the idea of a possible bounce into a 4th daily cycle or a nice run similar to the one out of the summer lows ( With an ICL in place). Thanks for being here and best wishes in your trading!
I wanted to do a quick update on the Oil and Energy sector that was included in todays premium report. It is interesting that as we see Oil selling off toward the Aug lows and currently forming Lower Highs and lower Lows, many Energy stocks seem to be more or less holding up and basing out . Lets take a look.
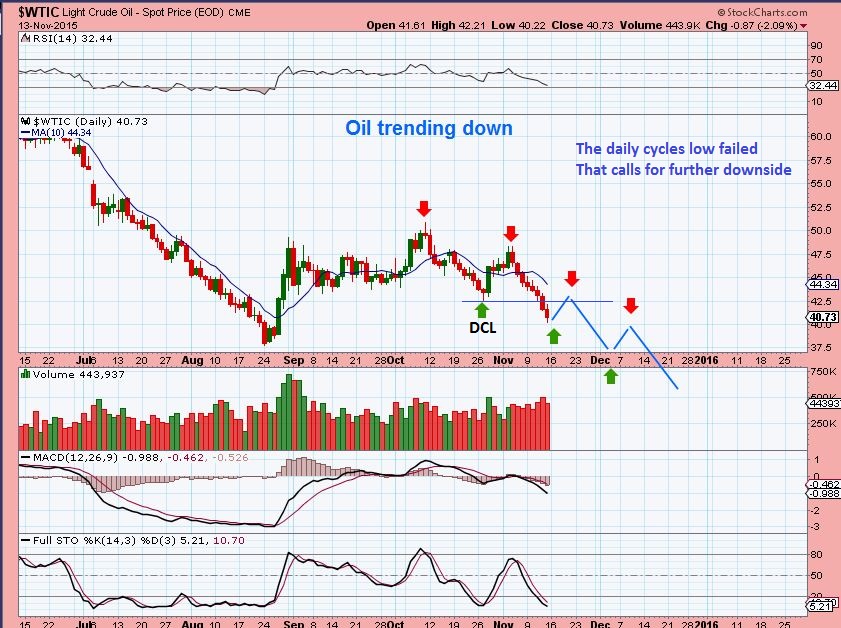
WTIC – Oil has been selling off, but it put in a reversal Monday. Will it hold? There were reports of “Oil trucks and Oil targets being bombed by France ” in response to the terrorist attack on Friday. This would be to target ISIS money ( Think “kill their oil supply”) . Wouldn’t that be Bullish for OIL? Possibly, but please be reminded that OIL is currently making lower Highs and Lower lows. Watch the Magenta line in the chart below for possible resistance when oil bounces.

From my weekend report: Notice that a longer term A-B-C-D Type move could target Oil in the high $20’s ( $26.09).
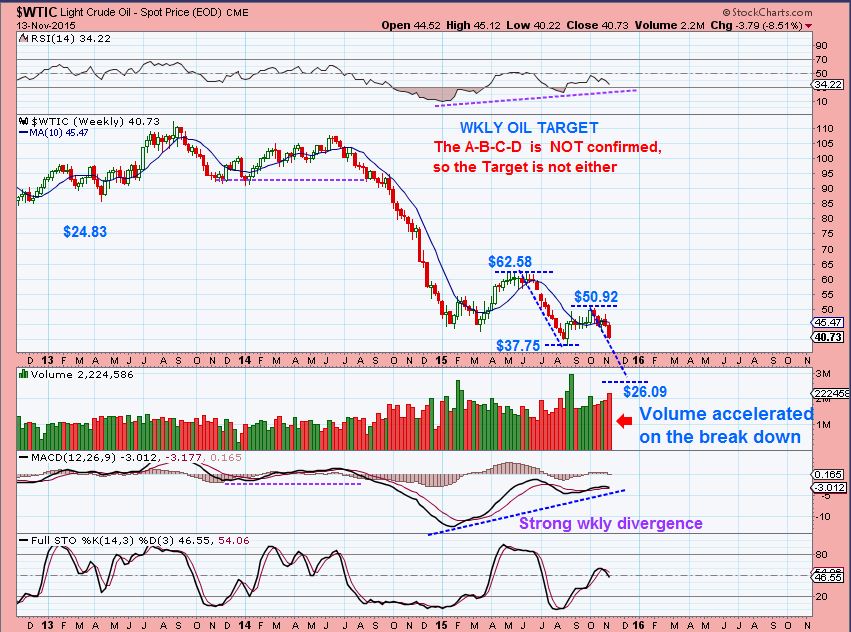
So Oils drop could stagger along something like this, with bounces along the way.
So with OIL down near August lows again, shouldn’t we would expect Energy stocks to be hurting too?
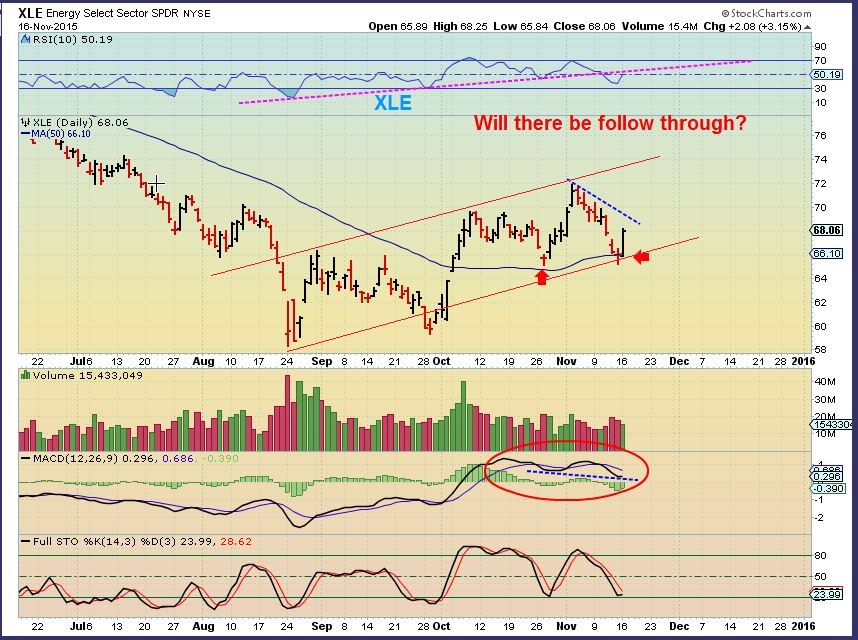
XLE – Notice that the XLE is not near the August lows like Oil. It didn’t look like it would stay above the 50sma with Oils sell off, but on Monday we saw a nice reversal at the 50sma.
I admit that it is a bit confusing seeing quite a few Energy stocks bottoming, basing out, and even looking bullish while Oil sells off. Maybe Energy stocks are sniffing out a coming bounce in oil.
So caution is still warranted with Oil making Lower Highs and Lower Lows , but some Energy stocks are looking interesting for the short term traders.
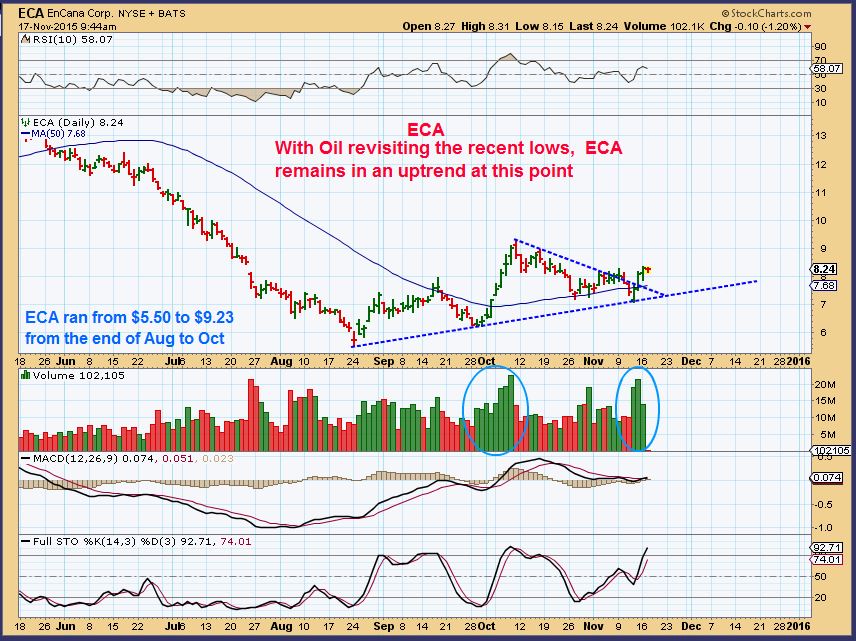
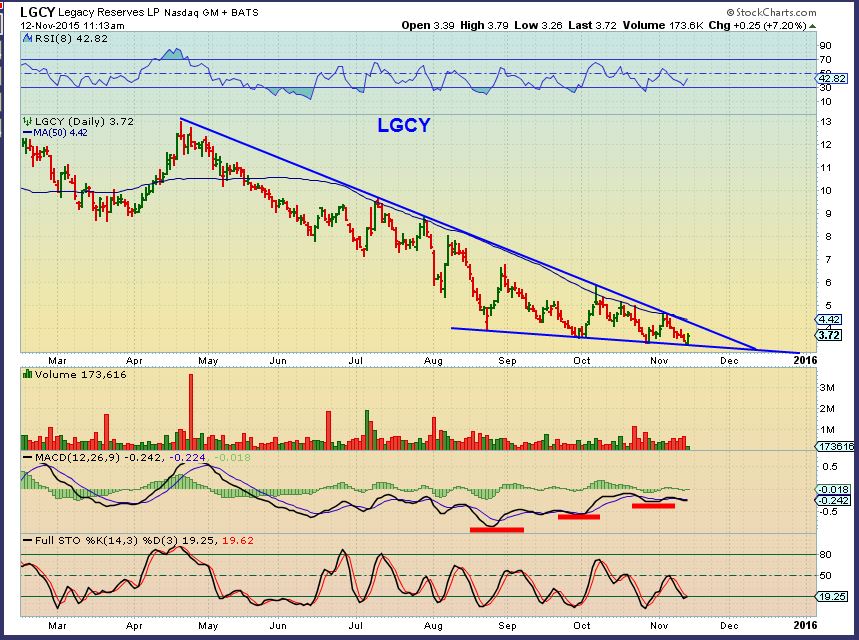
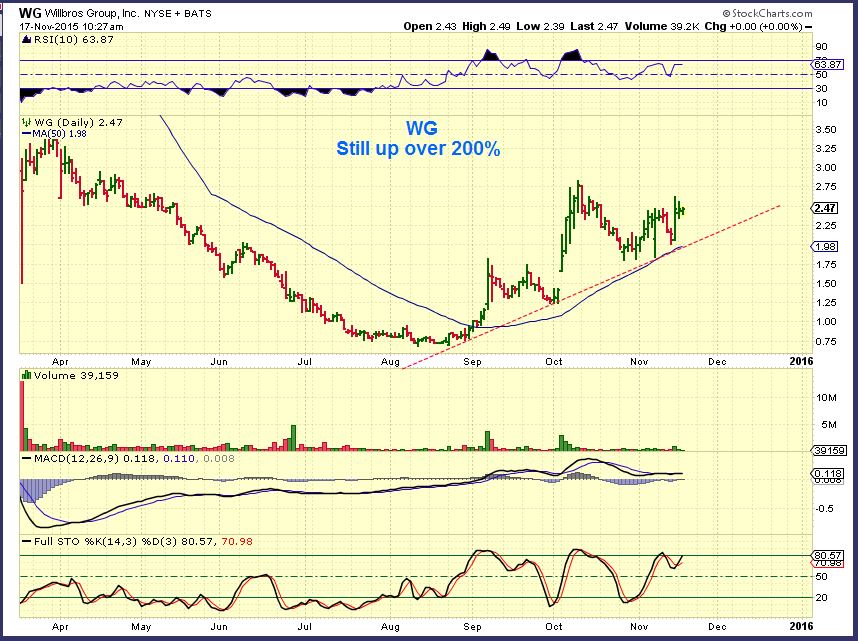
I repeat: Please see my OIL chart above again and the MAGENTA line . Then you can also take a look at some Energy charts like WG, ECA, ERF, CJES, BBG, BTE, SGY, CVI, LGCY, EXXI, ETC. Those charts and many more look quite trade-able shorter term. Buy support and sell resistance is one approach. Lets look at a few charts mentioned above …
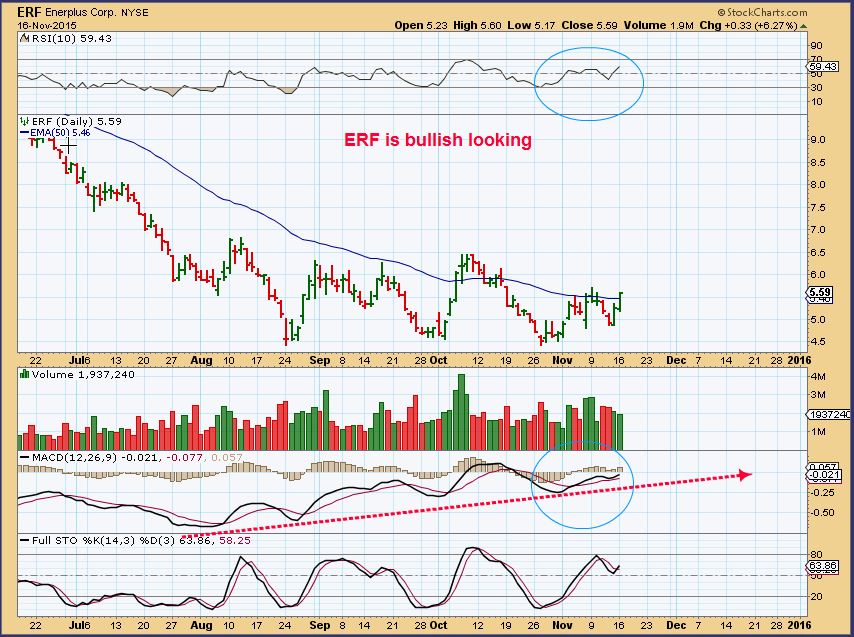
ERF – ERF moved higher Friday with OIL down and continued above the 50sma Monday.
ECA – Almost ran up almost 100% from Aug to October, it continues to make higher lows here.
This was my longer term possibility for LGCY. It too is making lower lows, but it may be forming a bullish descending wedge longer term. It has reliable support and resistance at this point. One could monitor it going forward for a possible break out.
WG – After deeply selling off this spring, WG & CRK ran up over 200% from the lows. They have been consolidating gains instead of giving them all back.
So with Oil near the AUGUST lows, we see many Energy stocks and the XLE pulling back a little less. They are trade able for the nimble trader in front of his/her screen fairly regularly . If Oil recovers in the future, many of these stocks may be basing and should benefit with very strong gains over time. On the other hand, what if Oil does fulfill that A-B-C move to $26 ? Energy stocks may begin to experience additional losses, so always use stops and monitor those positions often. Along with regular market commentary, in the premium reports we have been monitoring this possible basing action in Energy and also in the Precious Metals sector. I am anticipating some meaningful lows in the coming months ( Or possibly last July for Gold? ). A monthly subscription is only $37.95 / month. If you enjoy following the type of analysis that you see here in the public section of Chartfreak, Why not join us and give us a try? I write 4 – 5 reports a week. Thanks for being here!
~ALEX
Scroll to top