
PUBLIC POST – PROGRESS
Lets review the movement in various areas of the market that we at Chartfreak have been charting. We will look for Progress in what we have expected.
.
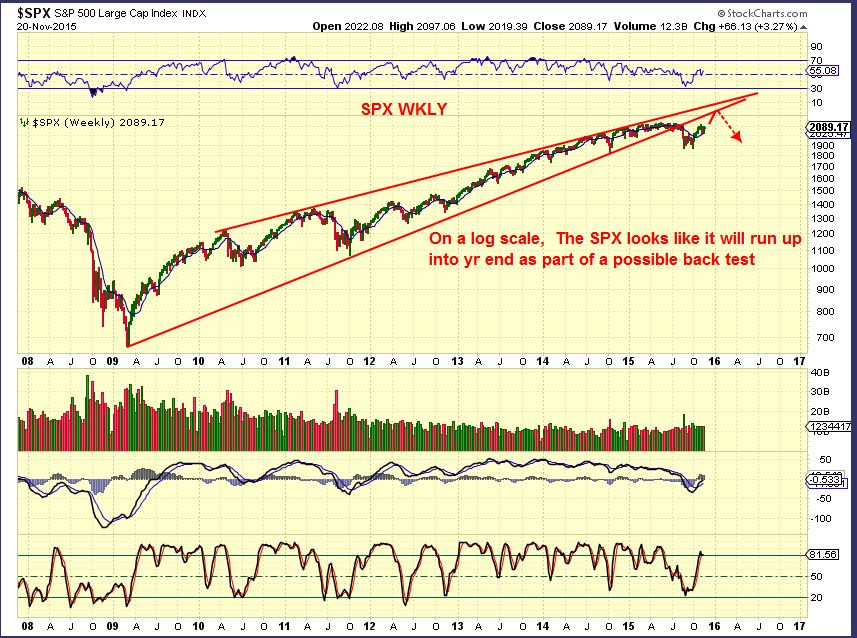
SPX Nov 20- We expected a back test and drop months ago when it seemed like EVERYONE was uber bullish
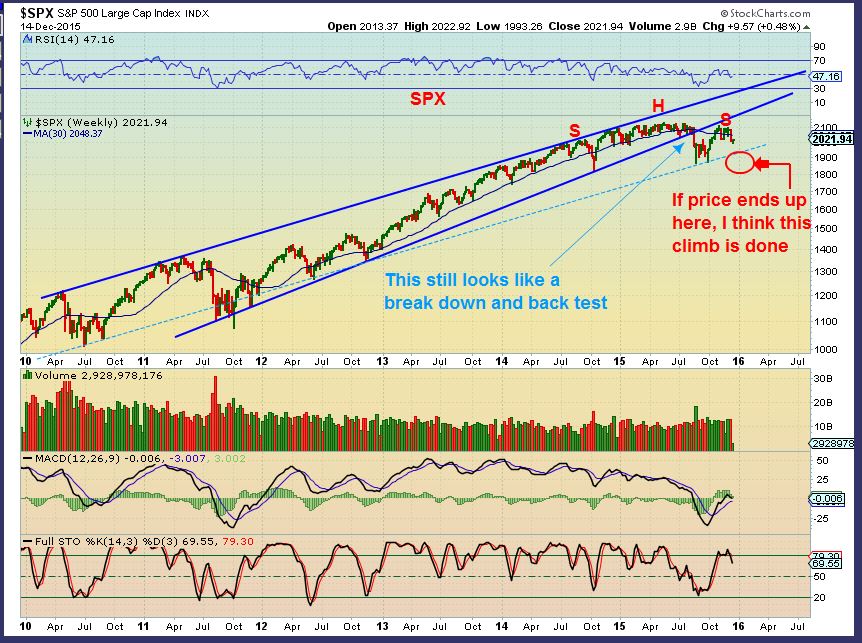
DECEMBER – H&S
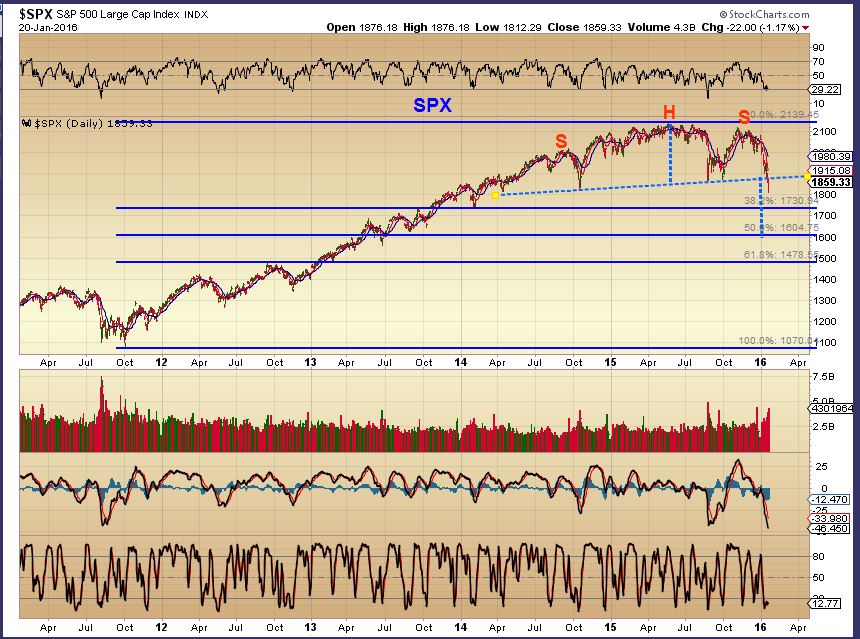
Obviously we all know that January has been brutal for “longs’, great for those “shorting”. Is it over? Well I do expect a good size bounce soon ( multi week even) , but when everyone becomes bullish again, I’ll be watching the downside …
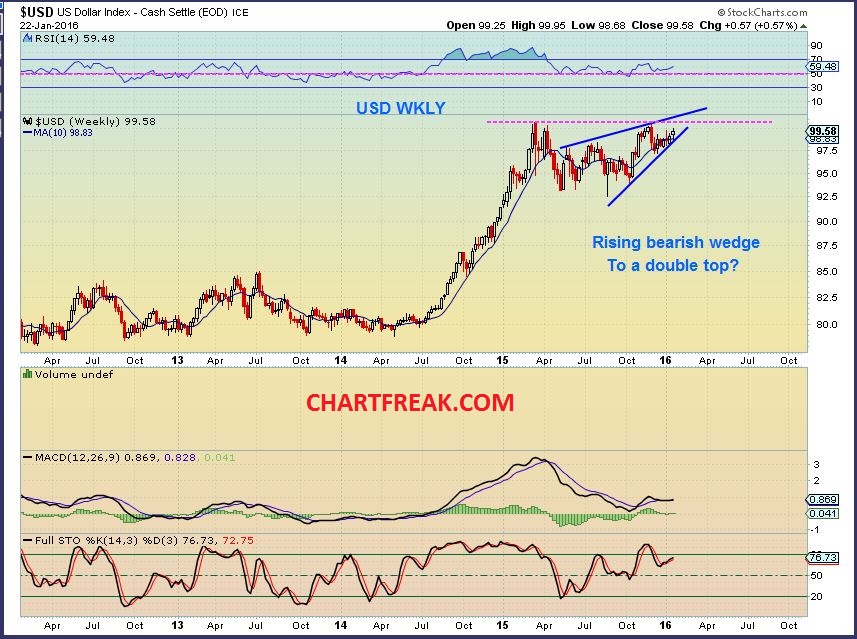
What about THE DOLLAR…
I’ve been pointing out another double top like last spring, and that makes a monthly double top too. A drop in the dollar in 2016 would be bullish for commodities and precious metals. A much hated area in the past 5 years.
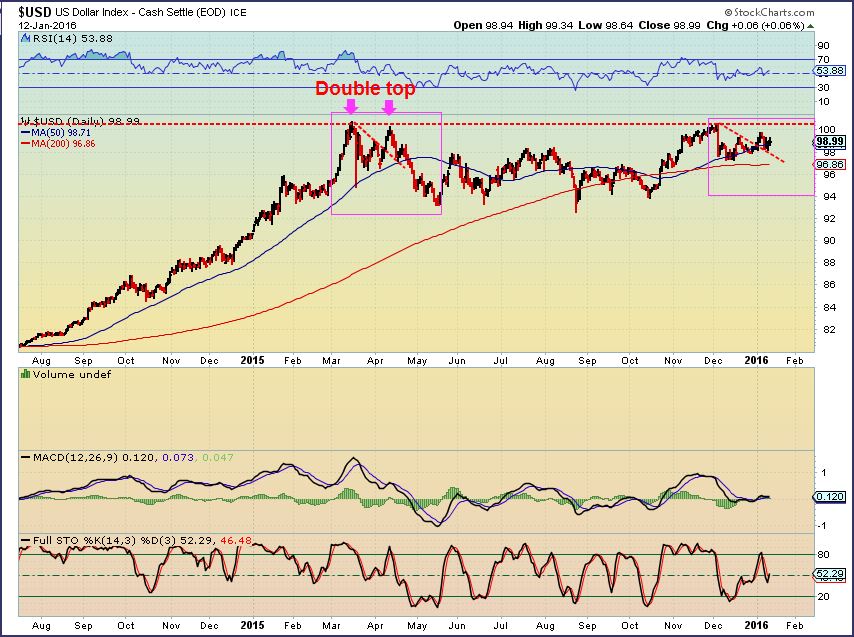
Currently this is my recent view of the Dollar.
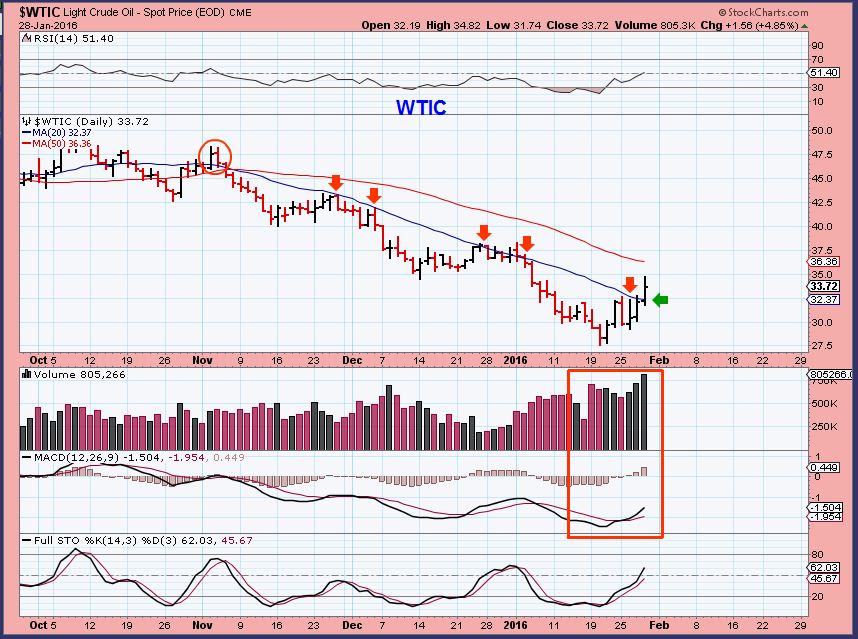
OIL – I’m looking for LOWS. We have short term lows in place, and I pointed out in my report that we CLOSED above the 20sma for the first time in months. PROGRESS.
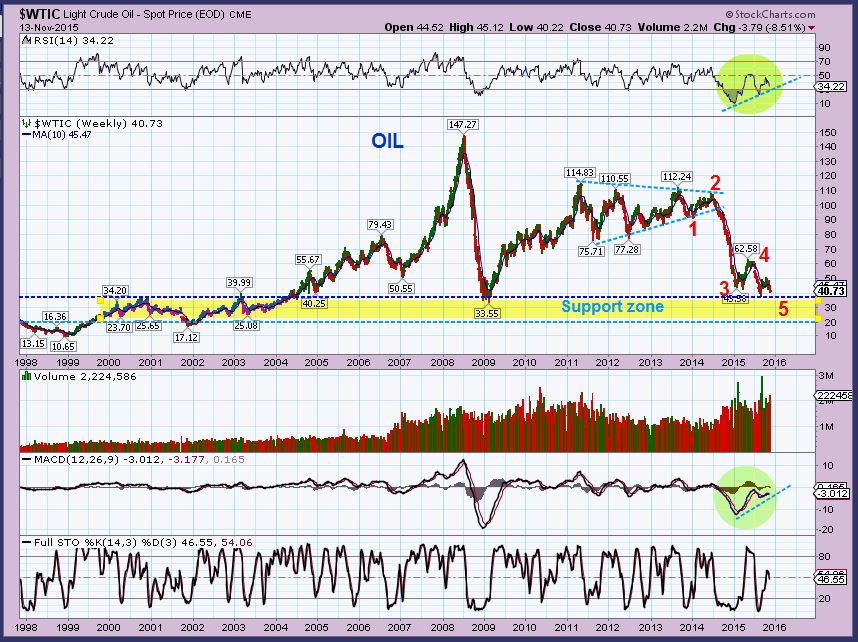
but it may be LONGER TERM lows too. WHY? My November chart . ‘5’ may be completed now . PROGRESS.
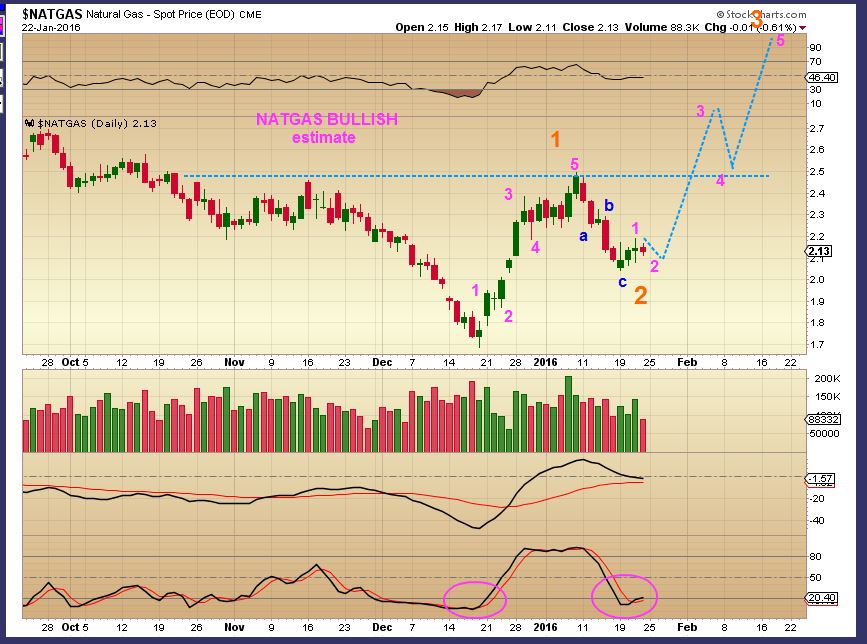
NATGAS – We’ve been watching NATGAS. It too is making progress. Remember when everyone was extremely bearish and thought it would drop to $1? I believed a low was imminent.
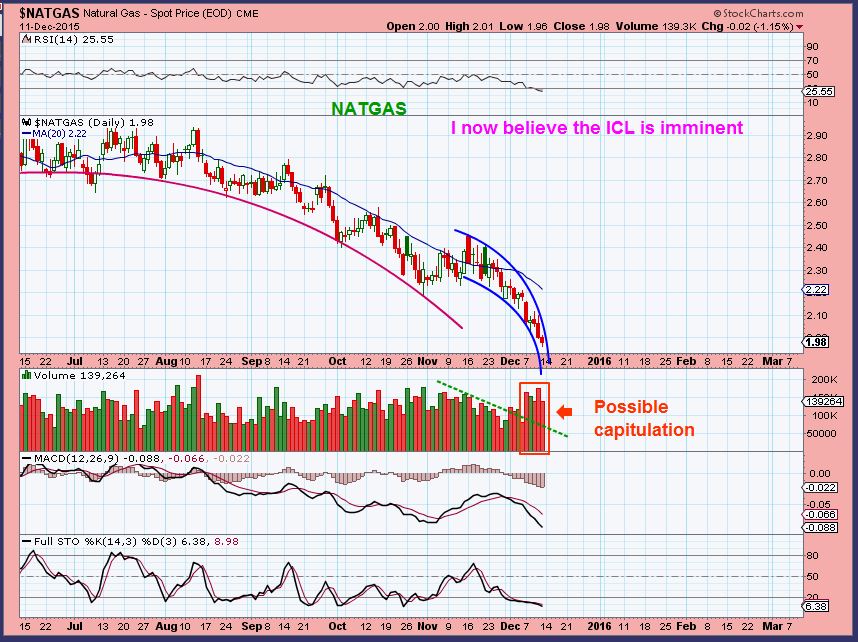
To be honest – I did not expect the type of snap back rally that we had however. That was strong short covering and buying. I expect higher price, but recently it did dip and then looked like a bear flag MIGHT be forming. SO I drew this with a cautionary note. Yesterday NATGAS made some important PROGRESS.
.
GOLD SILVER & MINERS
Lets just look at charts of progress that I posted as time went onward. Many were very nervous with Gold lingering at lows, thinking we must drop to under $1000 first. Here is what we at Chartfreak were watching .
.
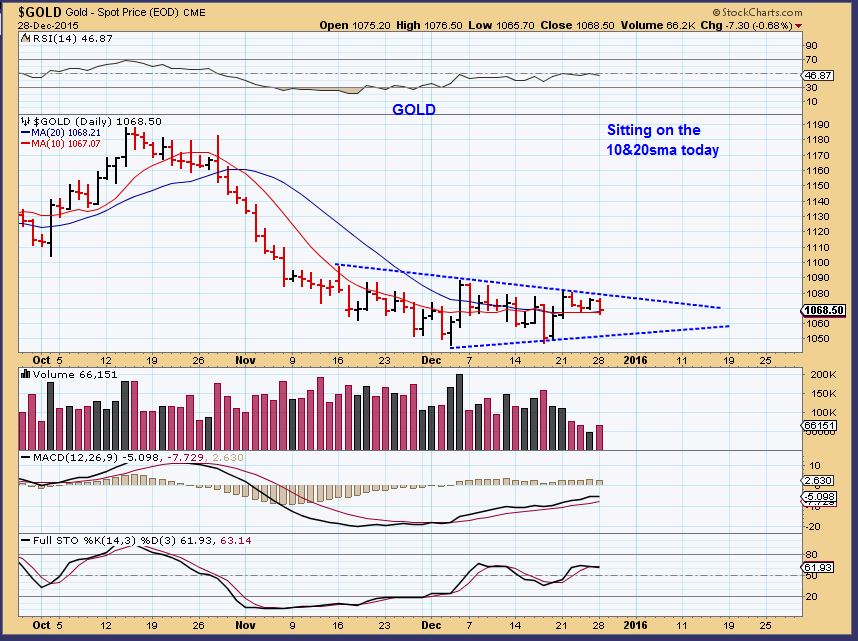
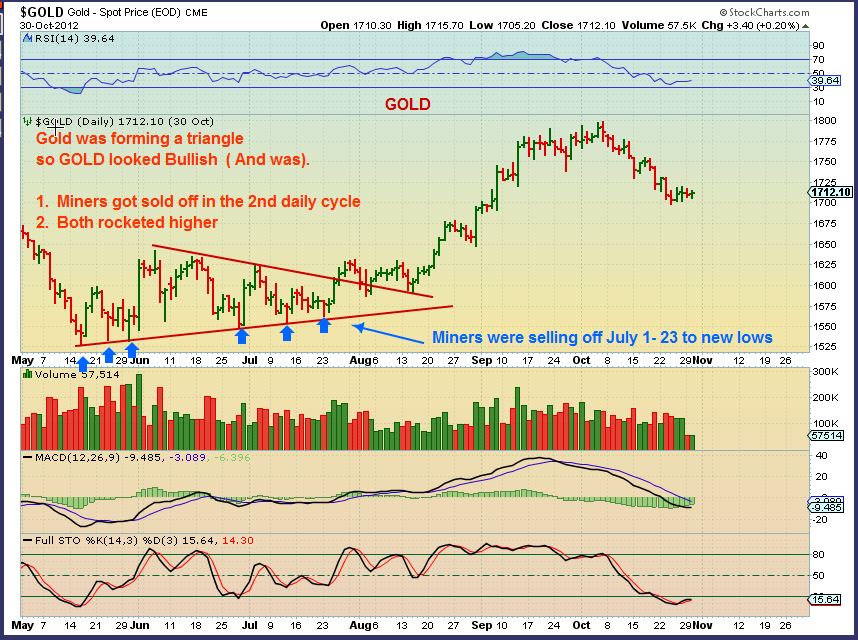
GOLDS TRIANGLE BOTTOM identified as of DEC. Bullish MACD & RSI.
 .
.
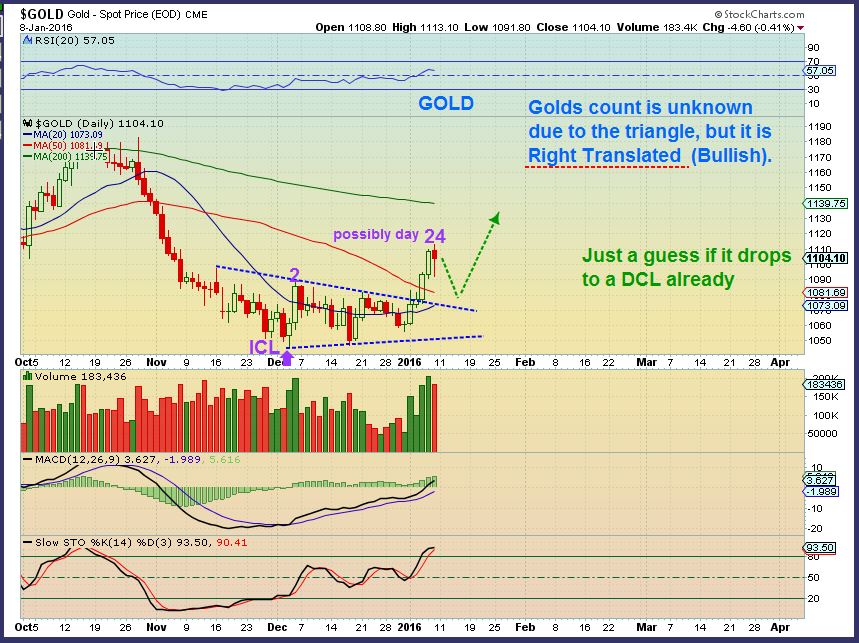
Break out – I was also looking for a back test of that triangle, as drawn.
We got the BACK TEST. That was a 2nd BUY opportunity in Gold. The 50sma was tested. ( Progress)
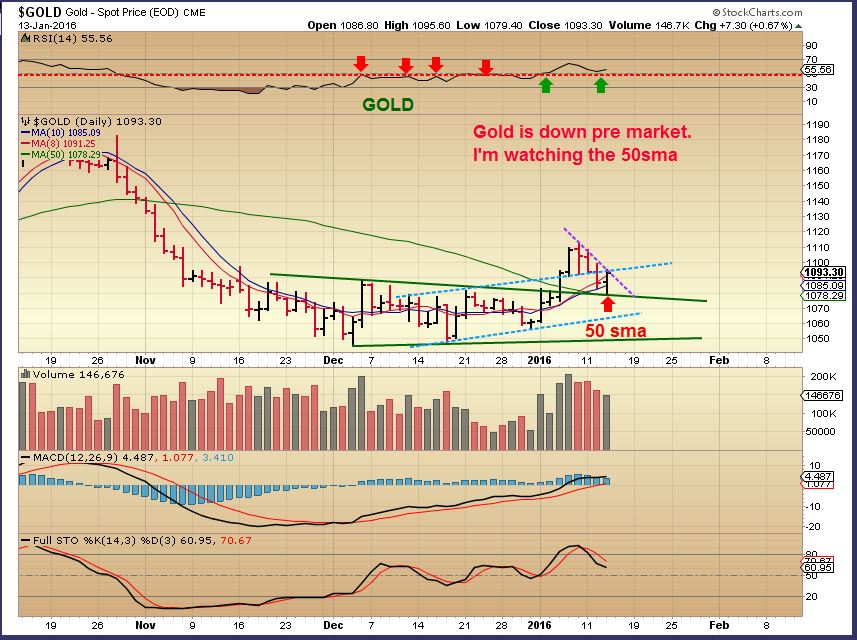
I pointed out that in this GOLD Triangle of the summer of 2012, GOLD back tested/ Miners tested lows , and both took off. That just happened now too.
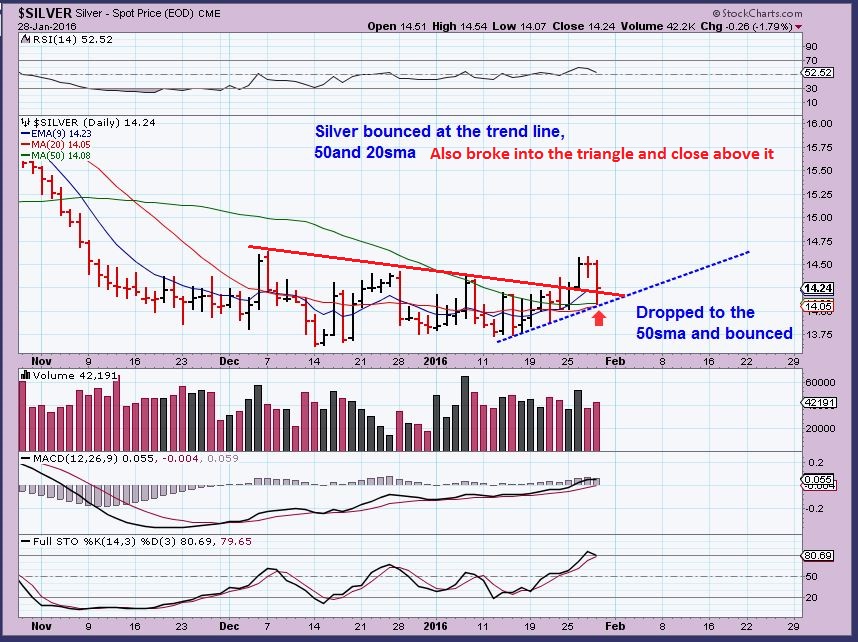
SILVER JAN 28 – Silver has formed a sort of triangle too. It back tested it yesterday . Will it hold? I gave confidence in my weekend report and mid week that shows an indicator that I use is bullish for Silver. Slow Progress , but Silver can get explosive when it makes its move 🙂
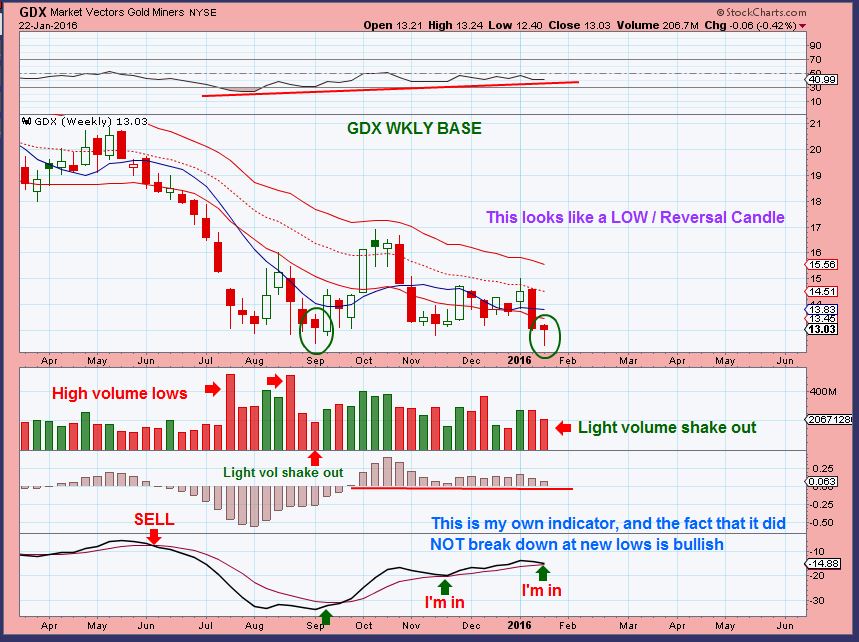
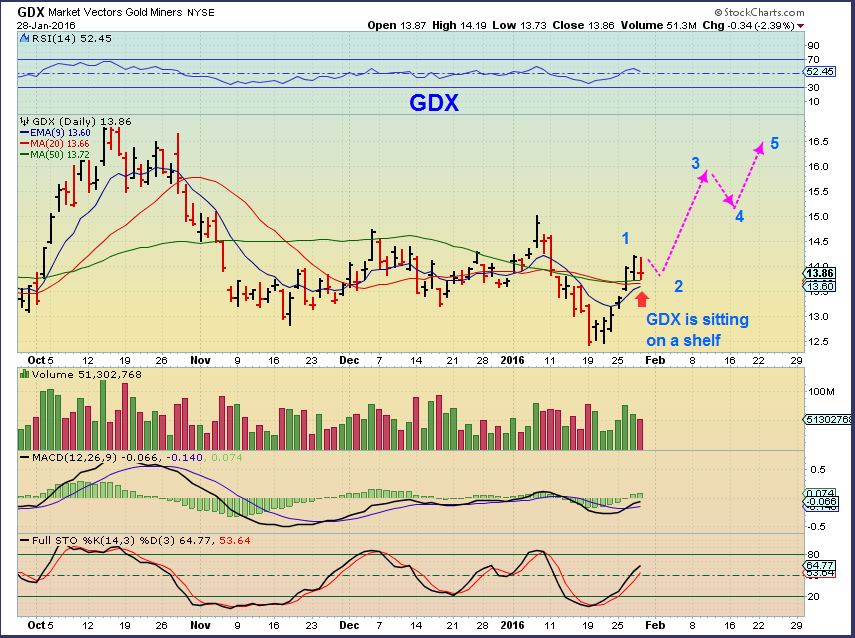
MINERS WKLY CHART- Gold was looking good, Miners sold off to lows ( Like 2012 triangle). This was a “Shake out & recovery ” candle . This was a BUY for miners.
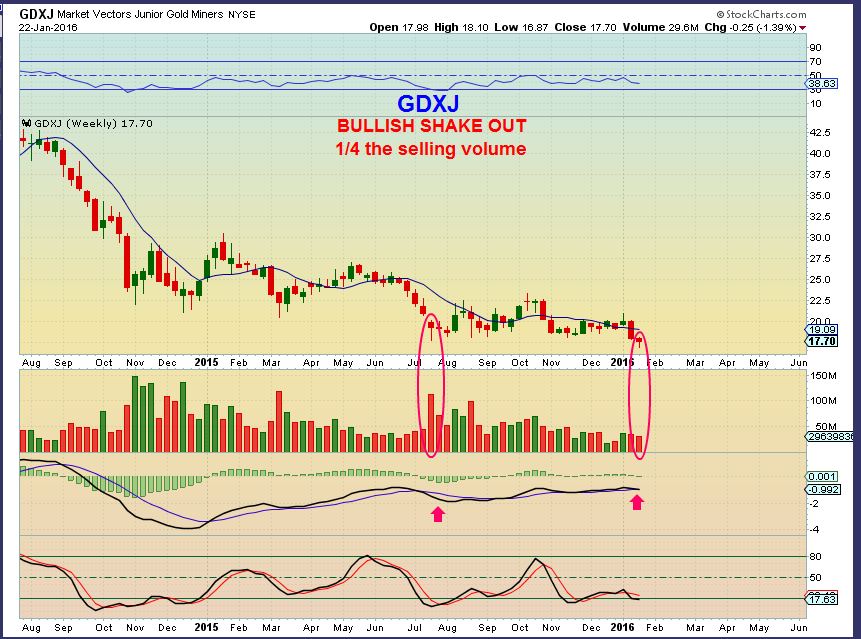
GDXJ was a buy last Friday too.
We started a pullback in Gold and Miners yesterday after a nice run higher this week. IS this run done? Was it just a short covering frenzy? Or is it making progress, possibly following this track?
I will be covering that in the weekend report along with other ideas in other sectors of the markets.
.
You can sign up for 1 month at the rate of $37.95 which includes a weekend report (usually 30 charts or so) and my daily reports. The daily reports usually include 10 – 15 charts covering the various sectors of the markets and some possible trade ideas if the set ups develop. If this type of analysis would help you with your current trading plan, why not give us a try? Whether you are an experienced trader or just need help with a 2nd set of eyes looking at the markets, The chartfreak subscription may be value added to your market review. As always, thanks for being here .
Happy trading ,


I’ve heard it said that Bernanke was a friend of Wall Street, and Yellen is the friend of Main Street.
If that’s true, I wonder, how will it be manifested in the markets?
Broad market more bubble-icious? (now BoJ is helping with that)
USD index lower?
Commodities flat-lining and commodity stocks going higher with the broad market?
GLD / SPY is trying for a trend change; not a convincing move just yet.
http://stockcharts.com/h-sc/ui?s=GLD%3ASPY&p=M&yr=5&mn=0&dy=0&id=p11334477368
Hey Irvin – I feel that the bigger picture is slowly changing ( But you knew that )
Have a great weekend! : )