

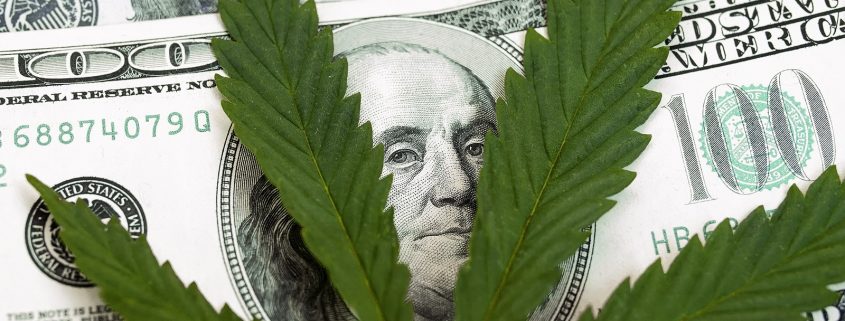
 Read More
(The following is a sample of Alex’s work from the week. This is more of a sophisticated trading technique best served for traders with some experience under their belt.)
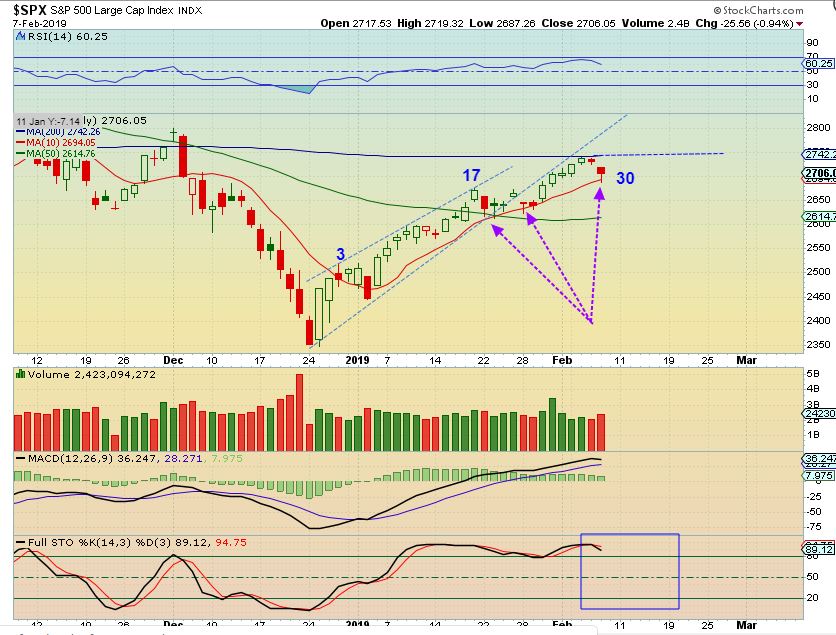
(From 2/1/19)
This example is a case where a trader is holding several positions and while active trading them, notices that one is beginning to run while the other is maintaining its bullish nature; but, it is ‘crawling’ along. Alex mentioned in the comments yesterday that he was planning to roll part of his position, here is his explanation:
.
(From 1/31/19)
For the experienced trader, playing the ‘bounce.’
Alex has been successfully writing a daily newsletter service for nearly four years now and is considered one of the best traders of precious metals miners, energy/uranium stocks, and biotechs. This is your opportunity to join his service as a member and follow along as we enter the next bullish gold Cycle higher.

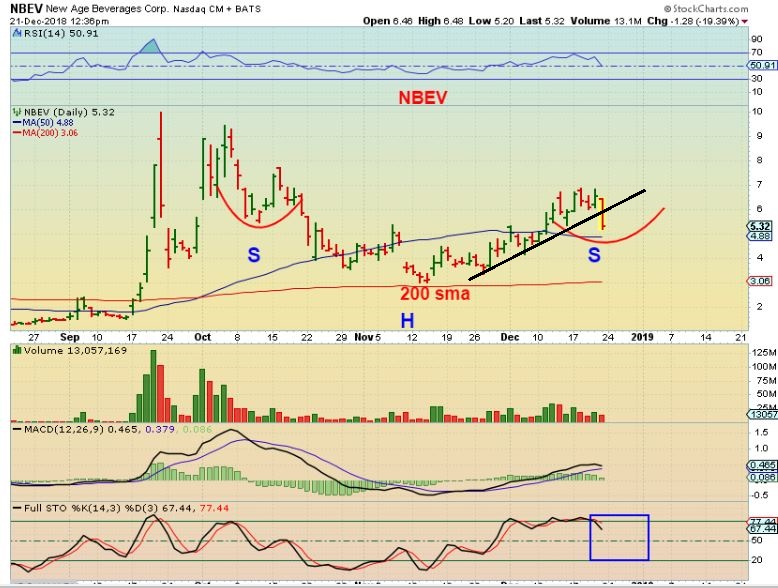
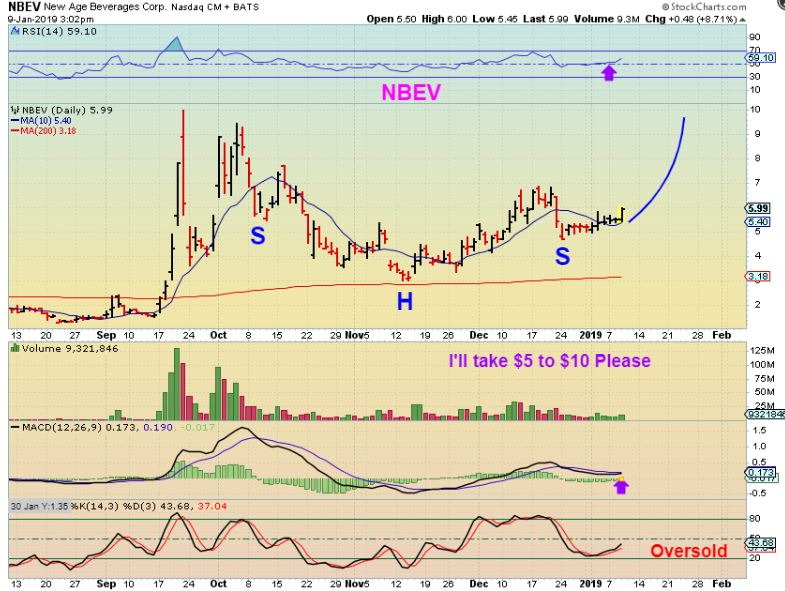
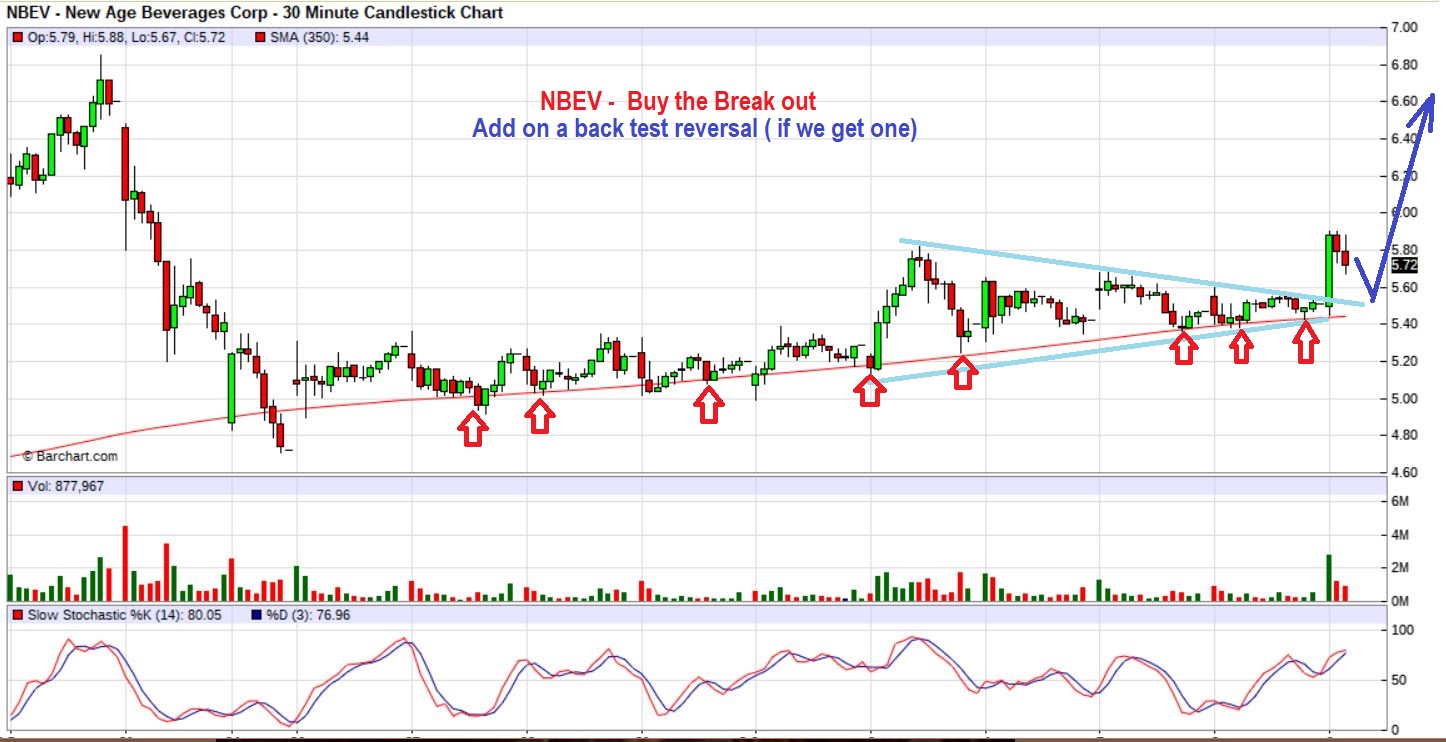
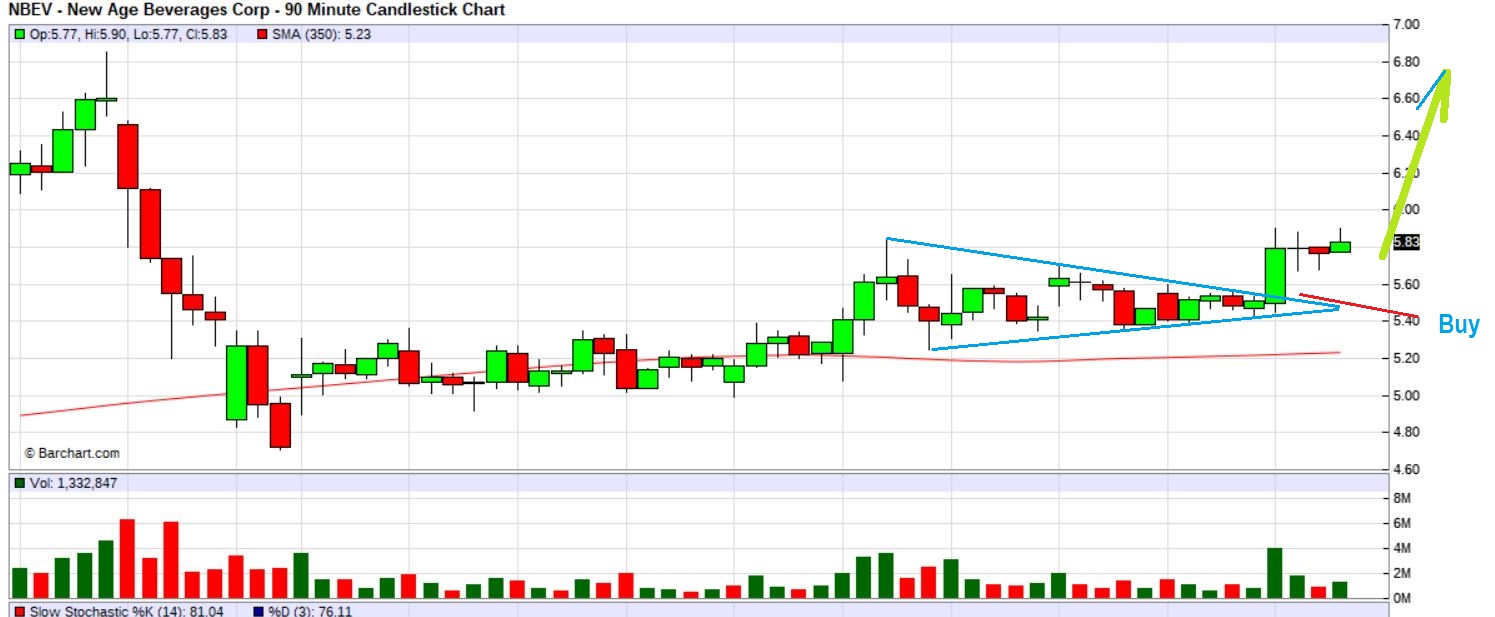
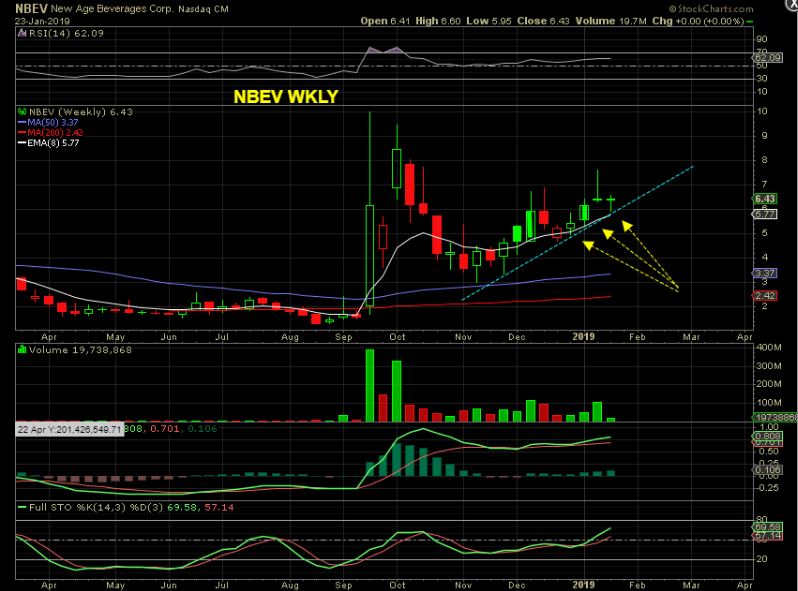
I want to show you how I follow individual stocks over the course of a month. In this post, I’ll show you how I have been covering NBEV.
[The following is a sample of Alex’s work over the past few weeks]
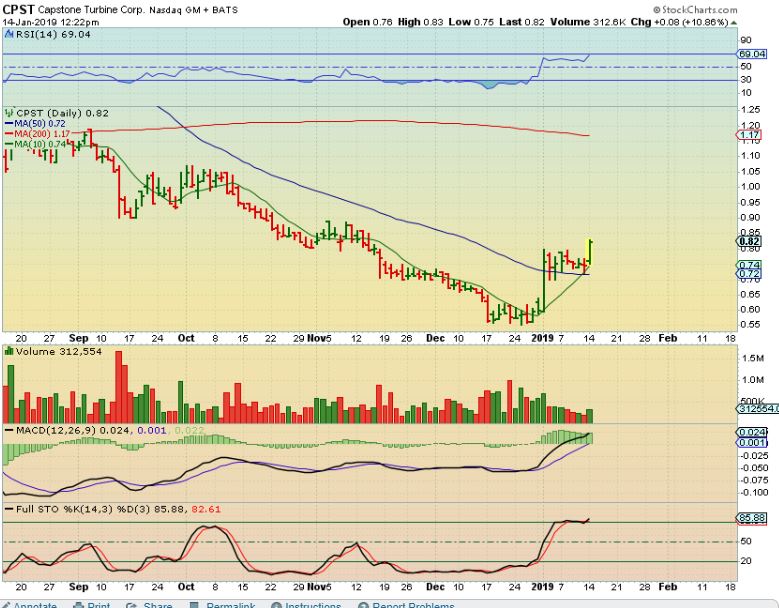
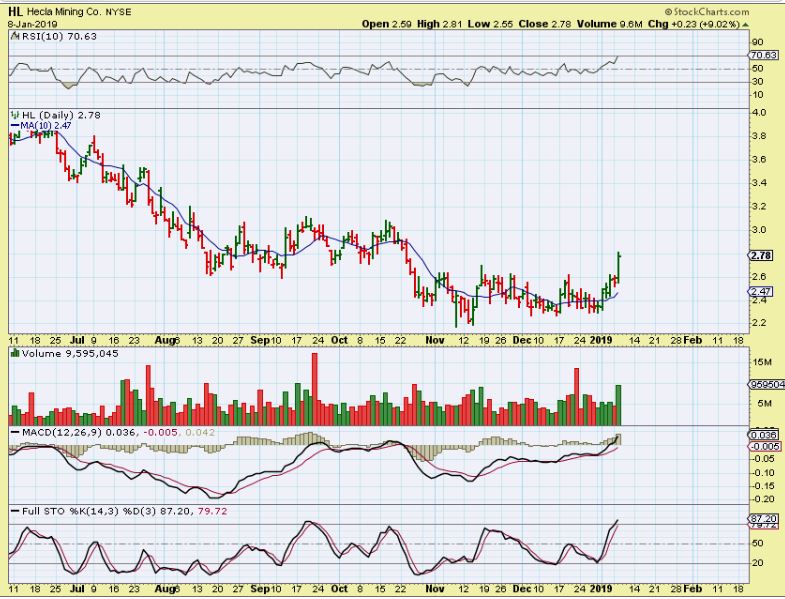
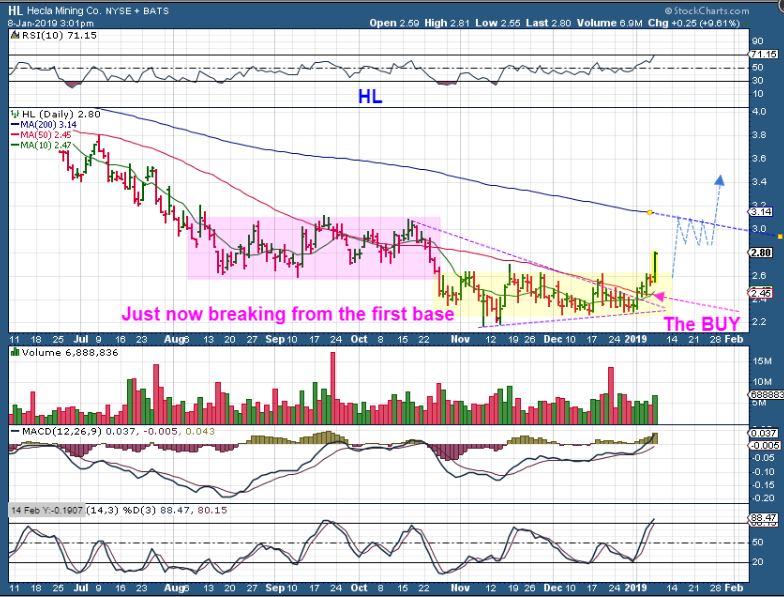
(1/10/19)
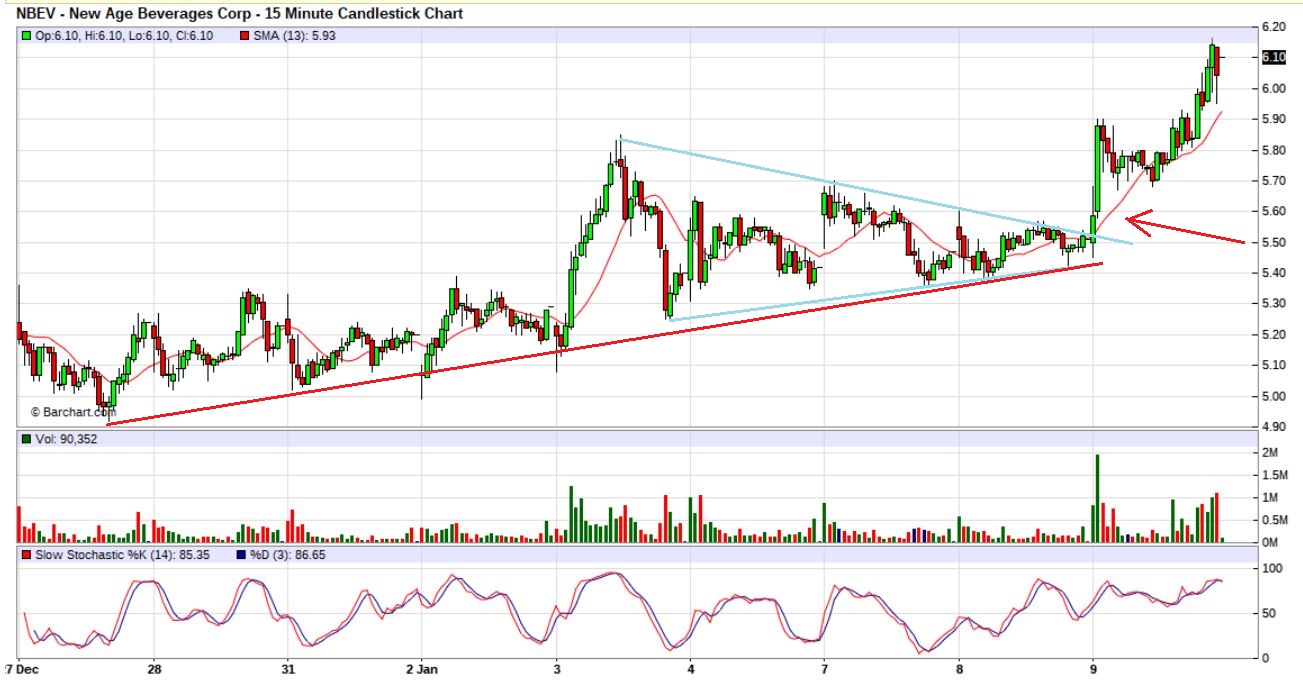
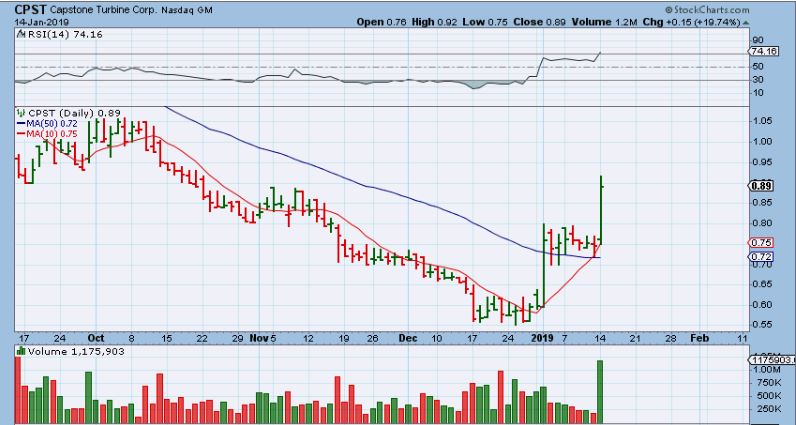
(1/18/19)
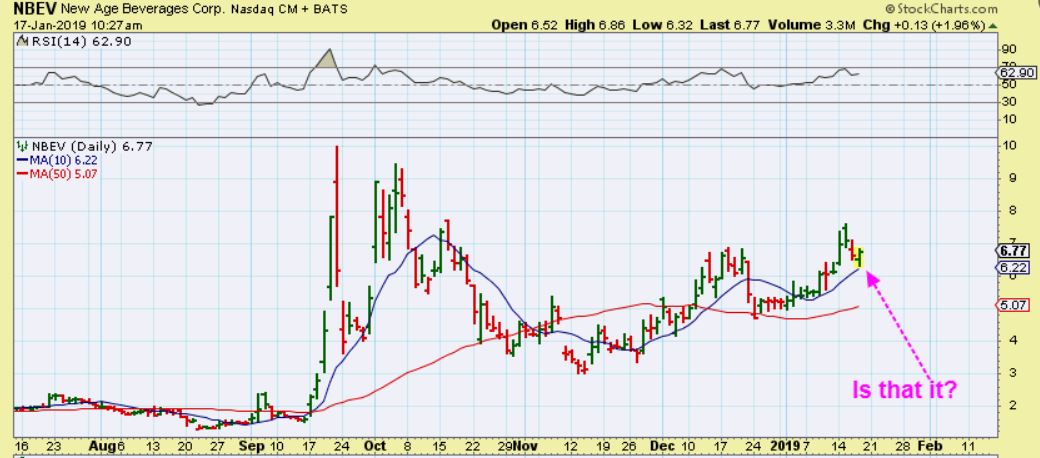
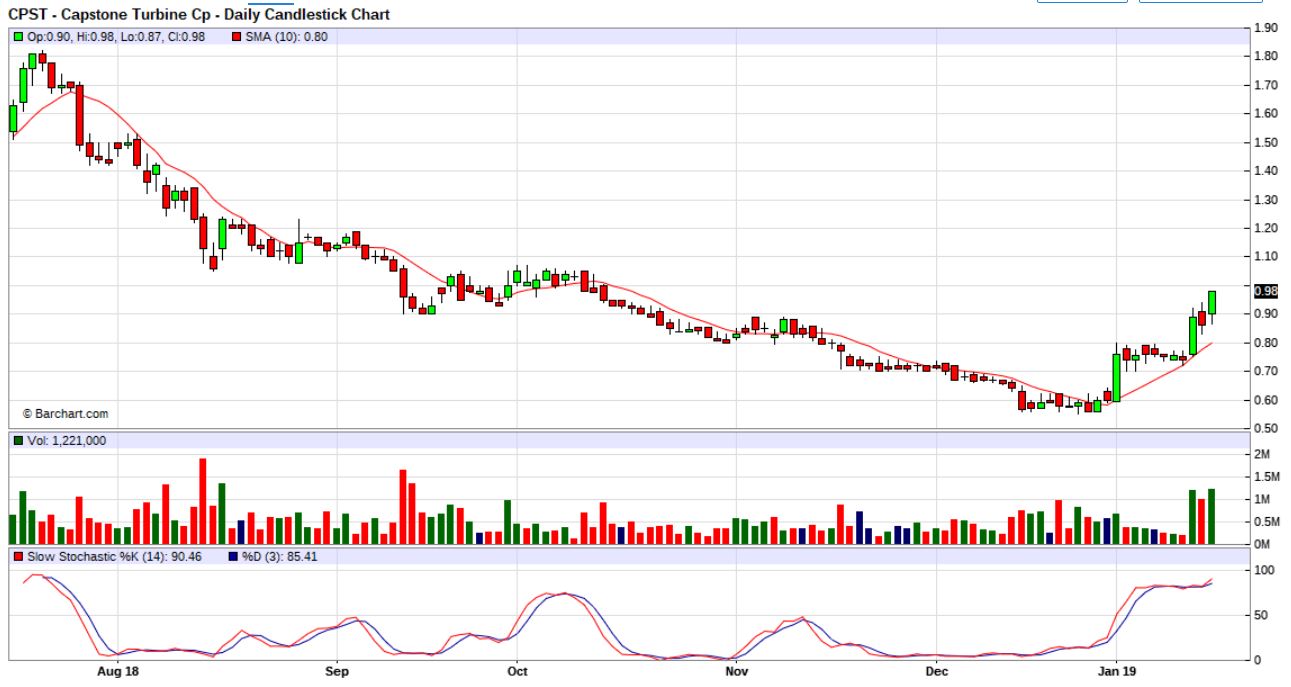
(1/24/19)
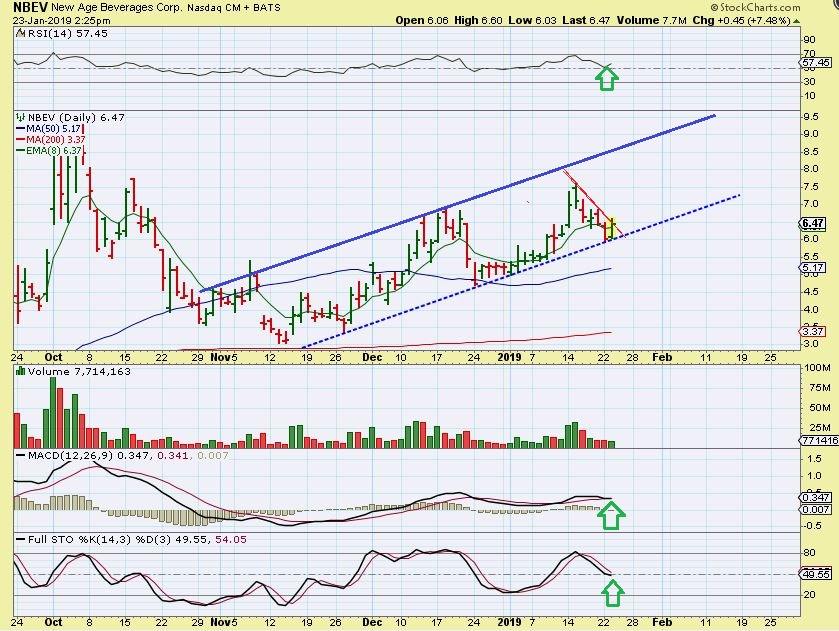
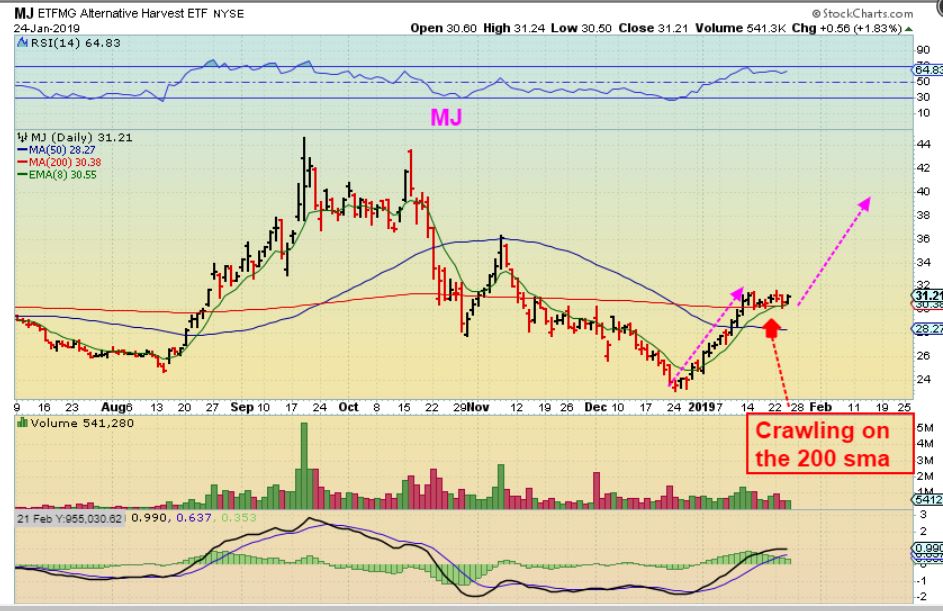
As a bonus, the $MJ etf from 1/25/19
Alex has been successfully writing a daily newsletter service for nearly four years now and is considered one of the best traders of precious metals miners, energy/uranium stocks, and biotechs. This is your opportunity to join his service as a member and follow along as we enter the next bullish gold Cycle higher.
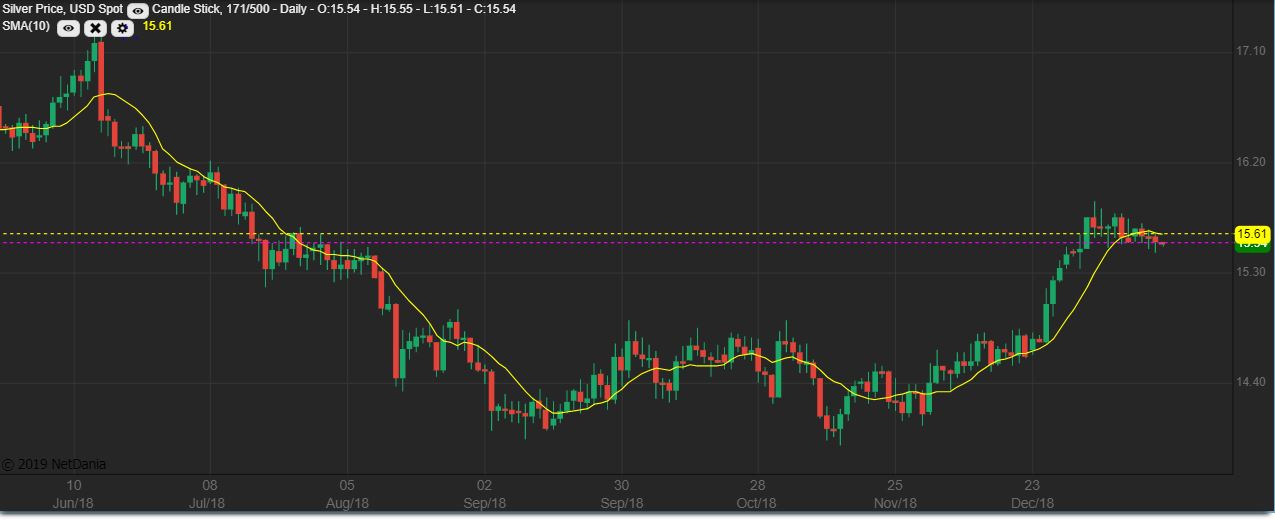
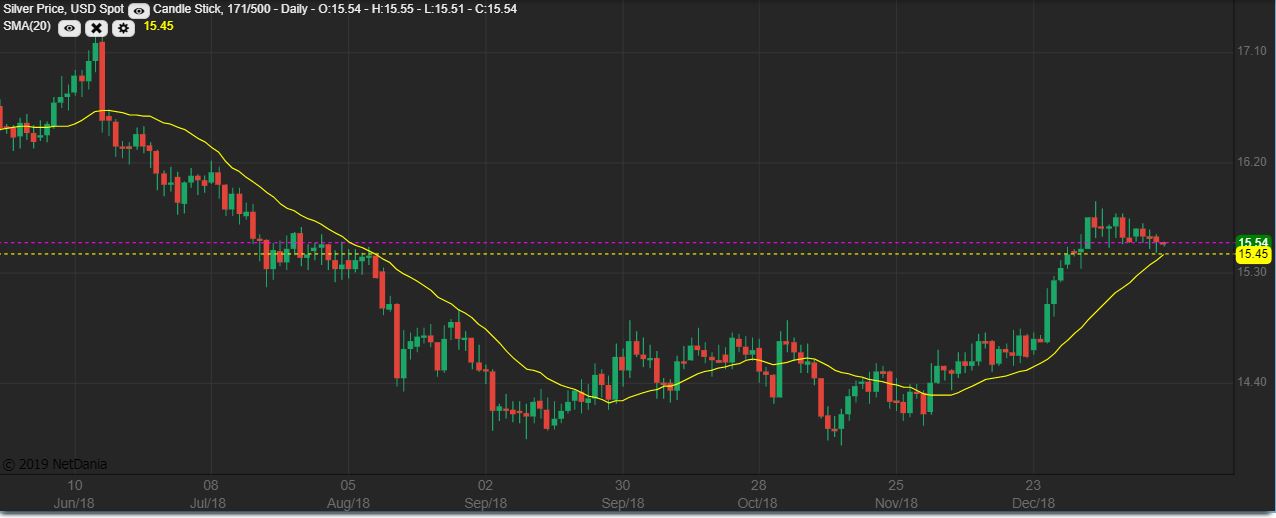
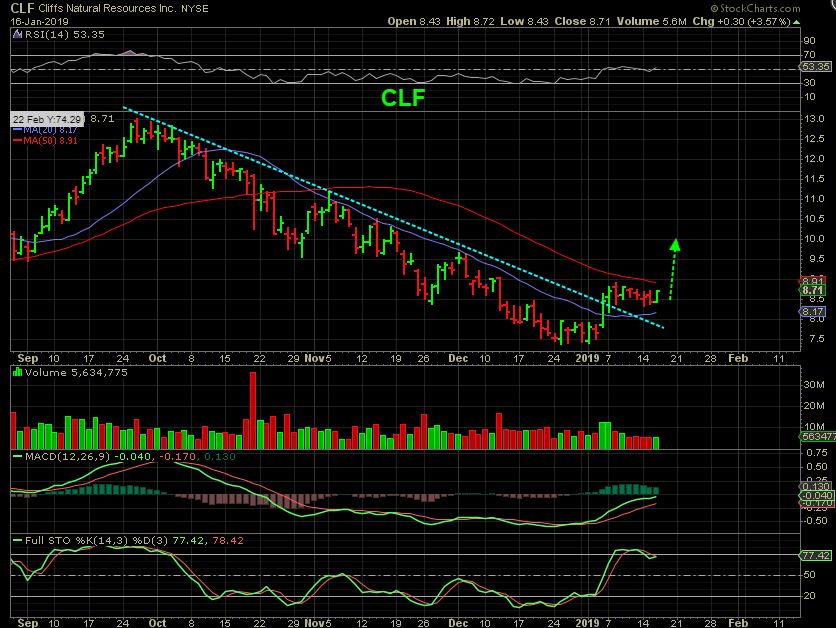
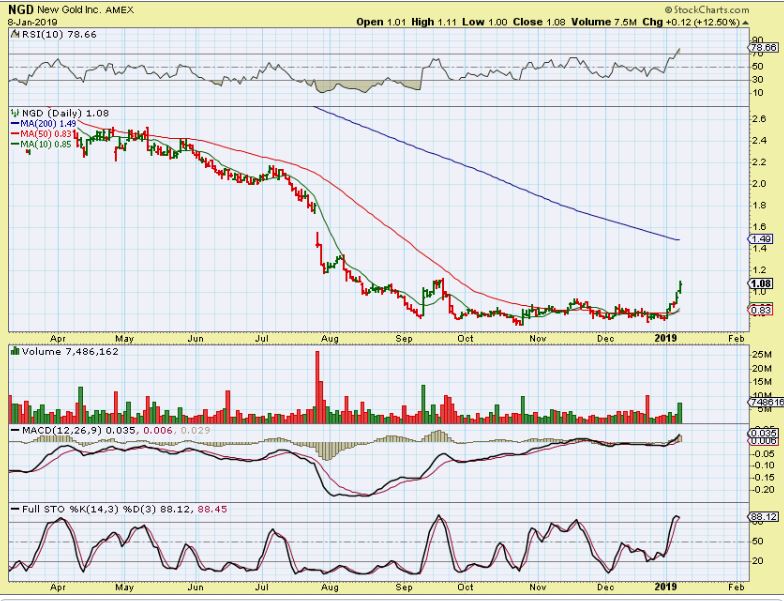
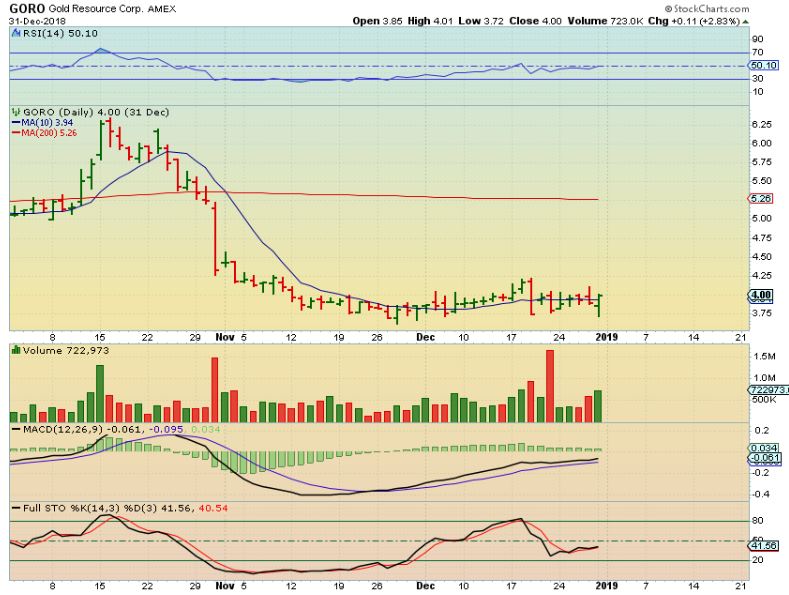
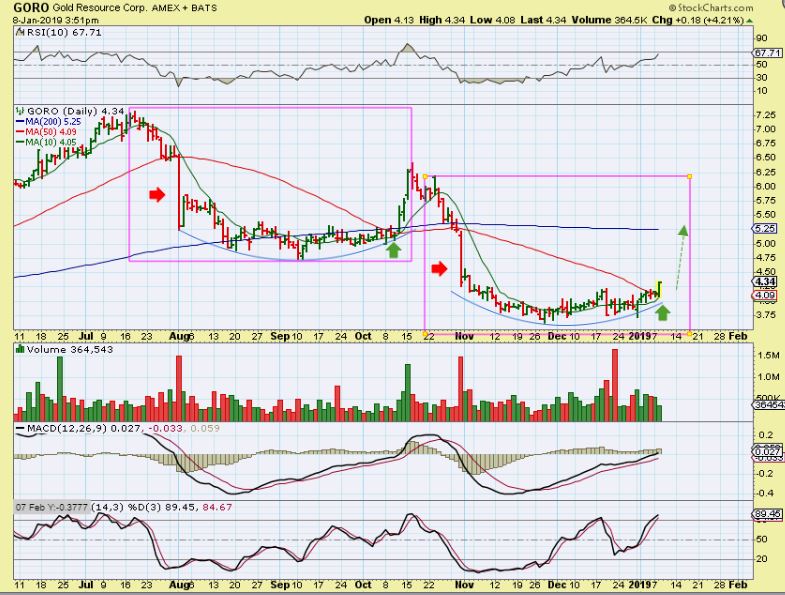
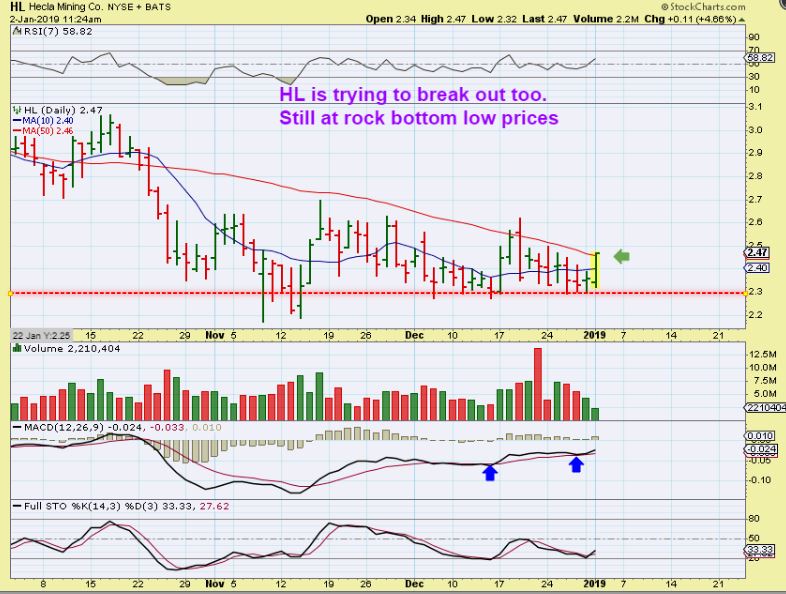
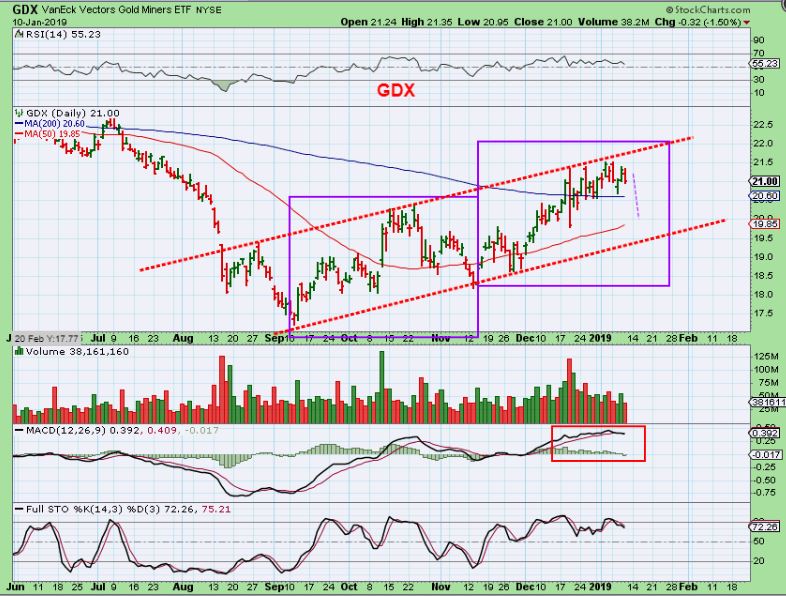
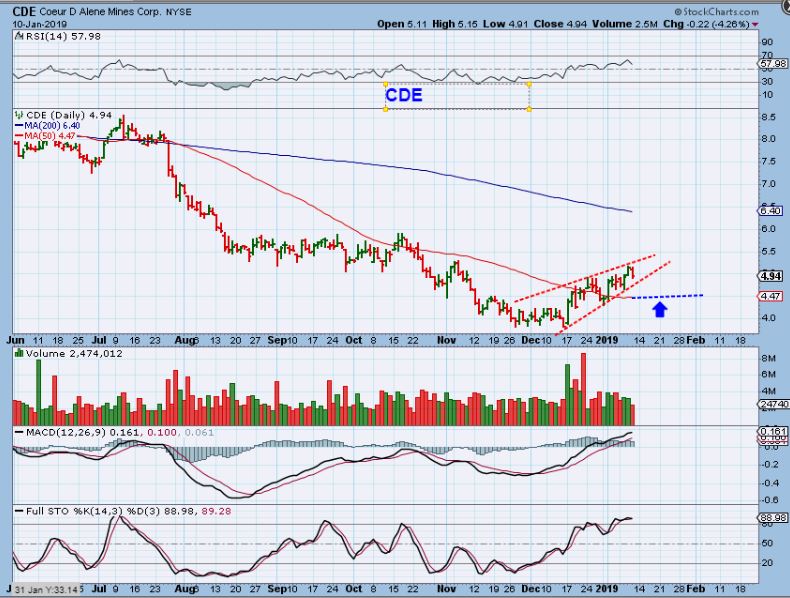
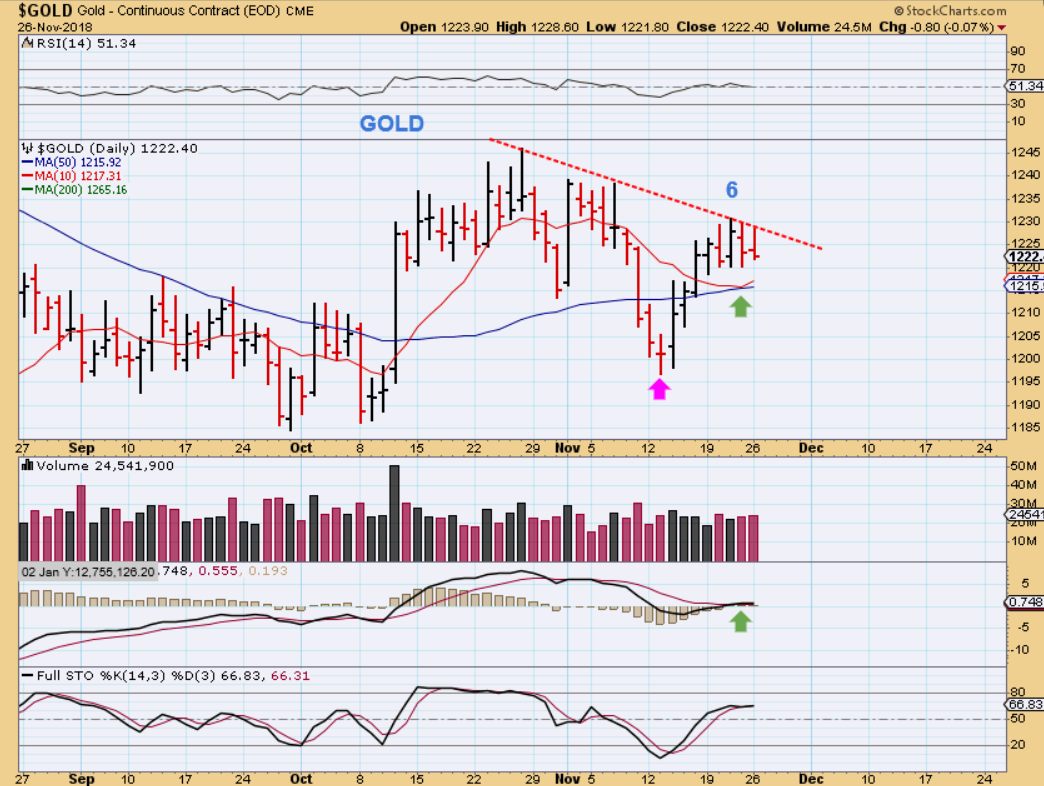
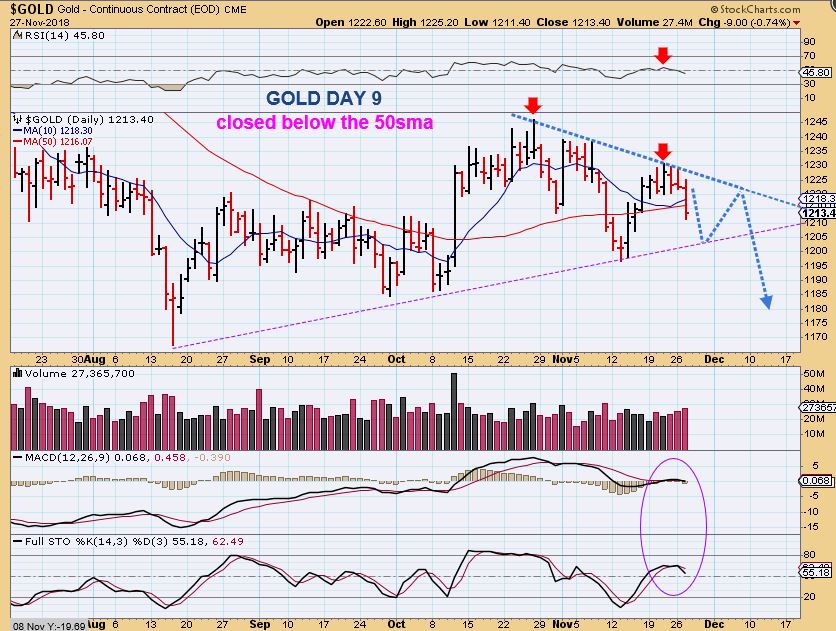
Let’s take a look at Precious Metals
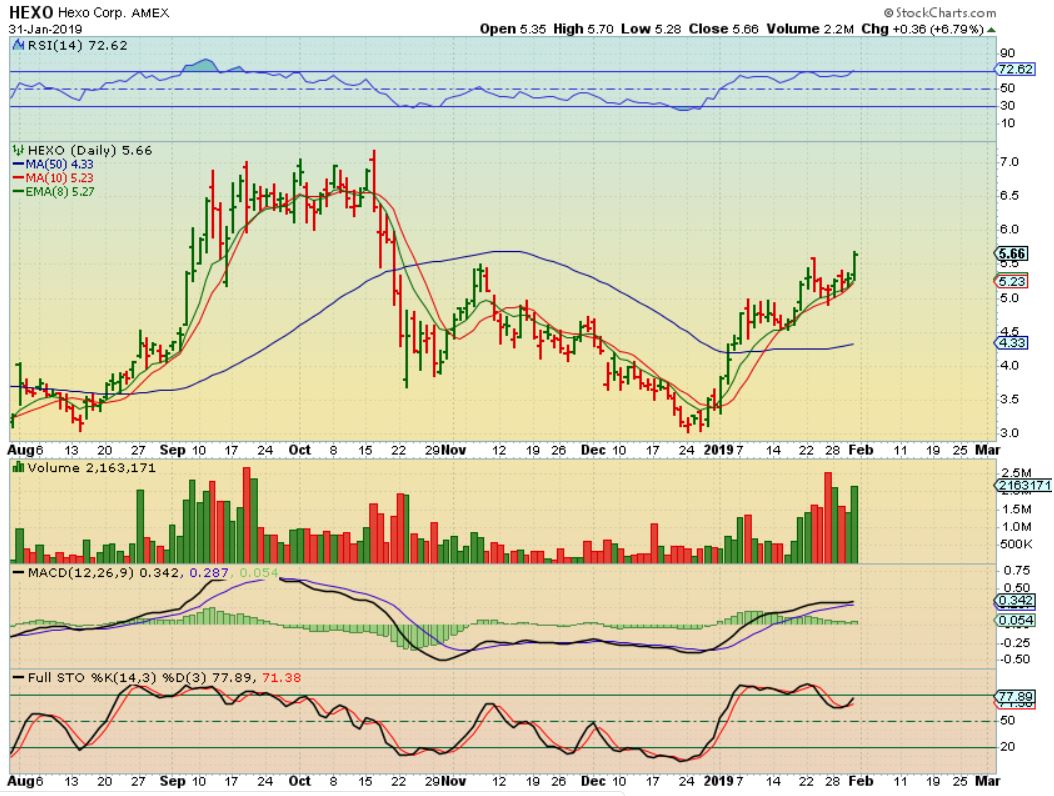
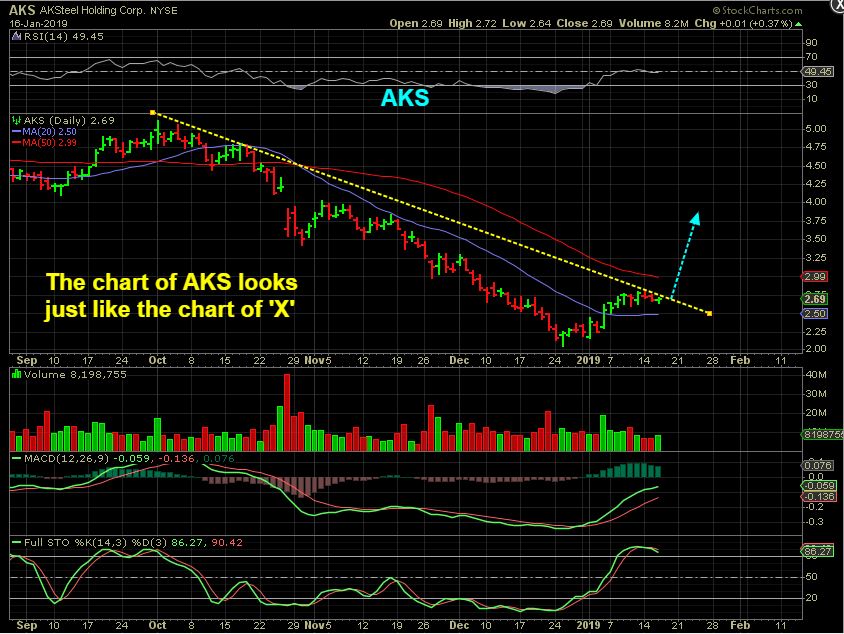
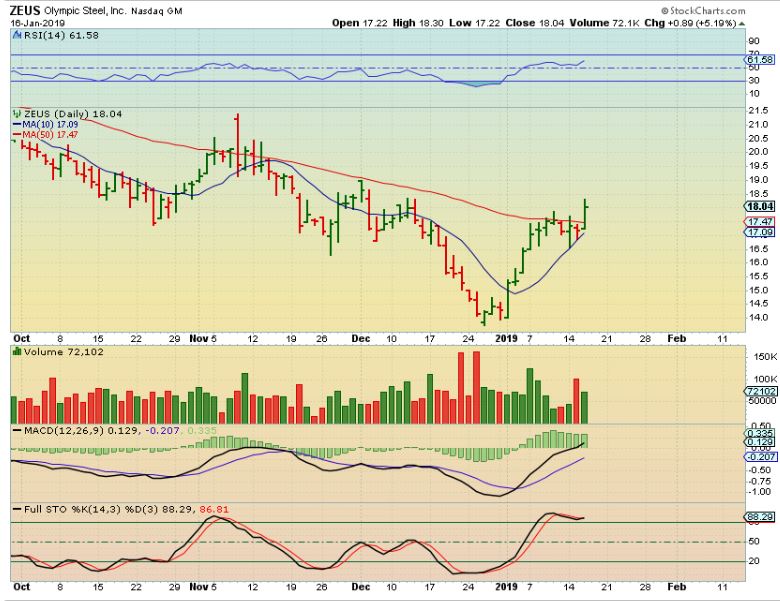
(Below is a sample of Alex’s work from the week)
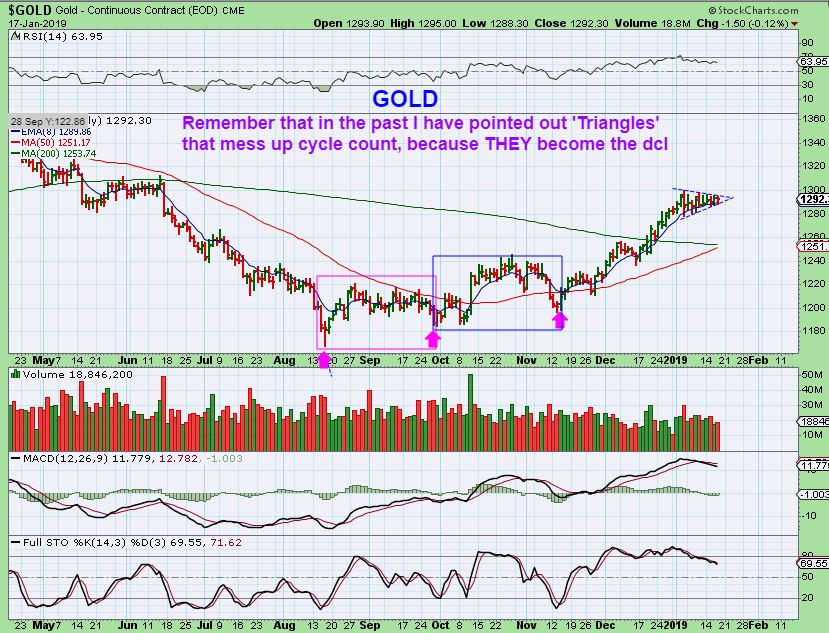
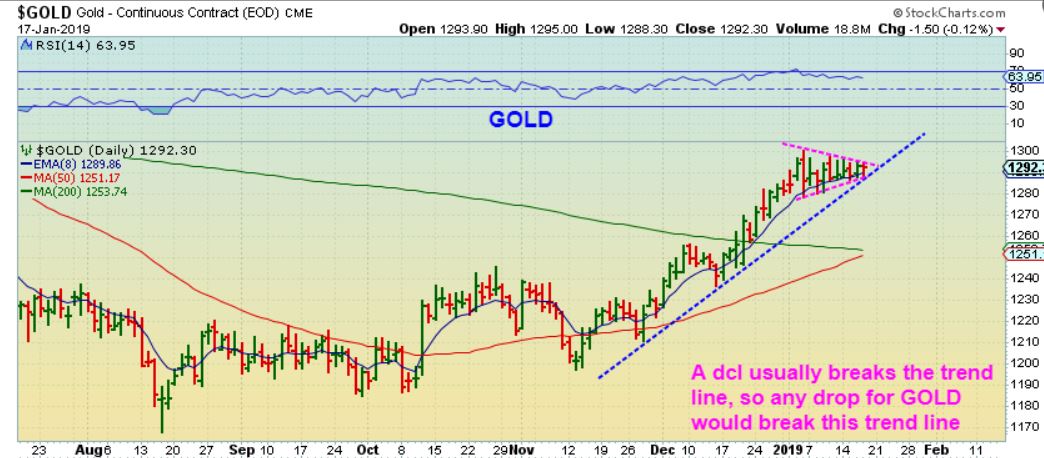
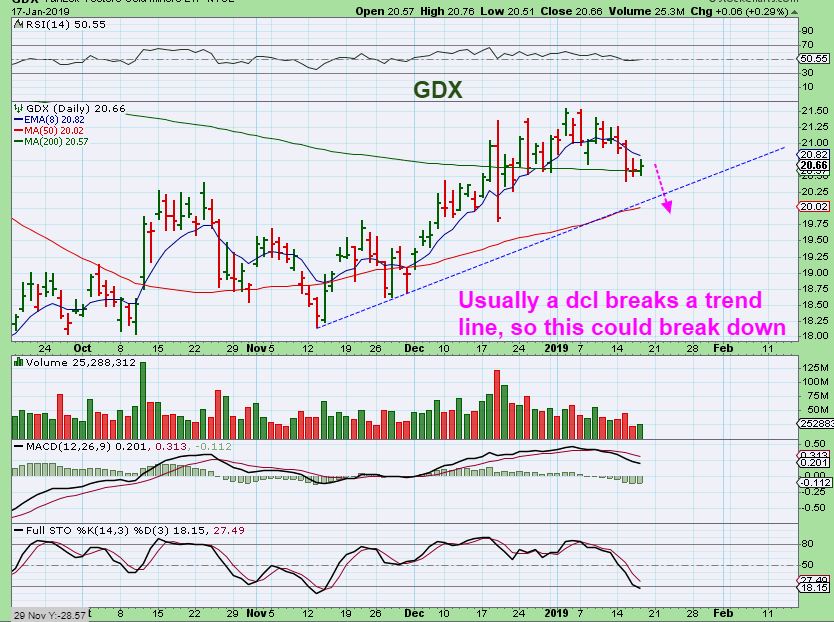
(from 1/17/19)
.
Alex has been successfully writing a daily newsletter service for nearly four years now and is considered one of the best traders of precious metals miners, energy/uranium stocks, and biotechs. This is your opportunity to join his service as a member and follow along as we enter the next bullish gold Cycle higher.

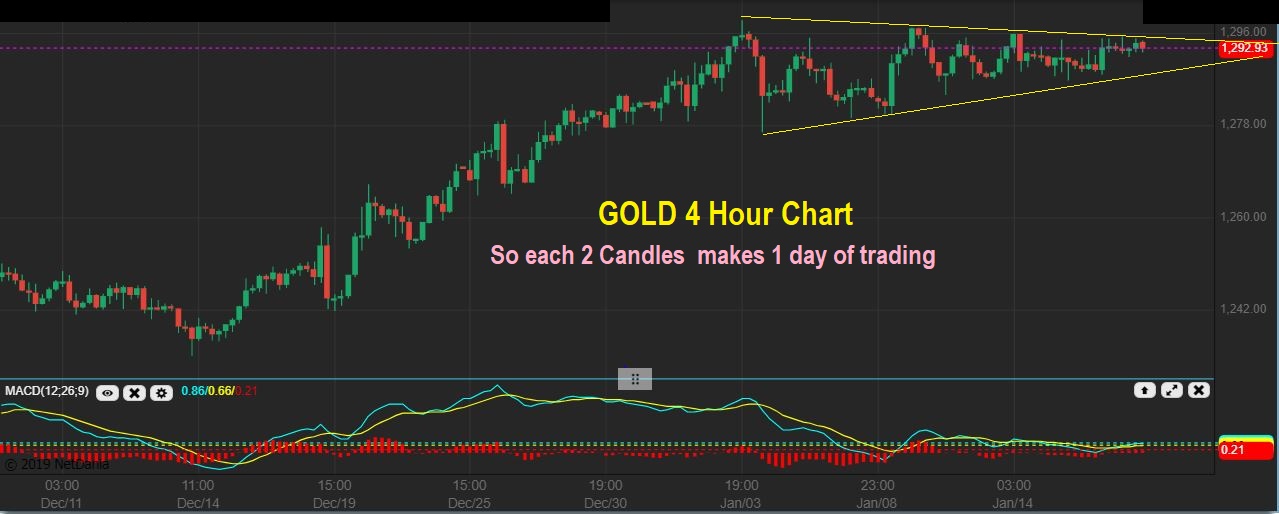
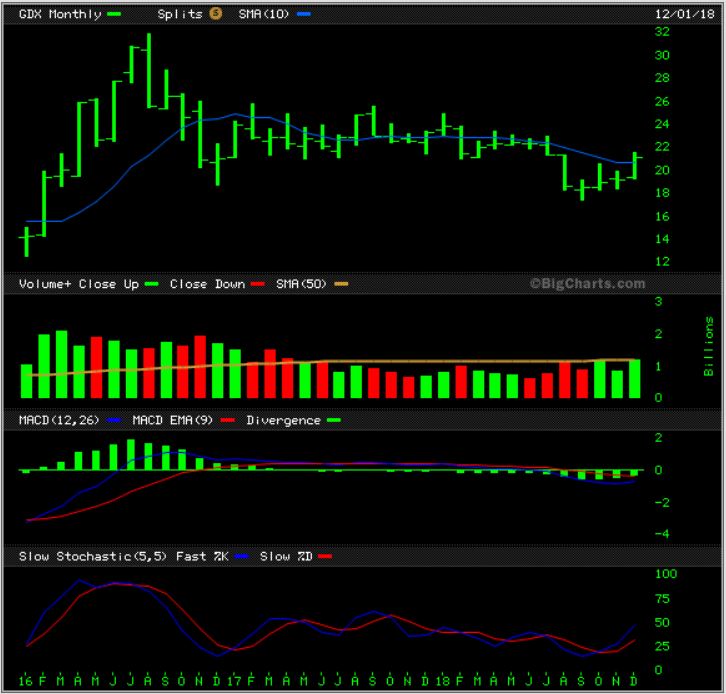
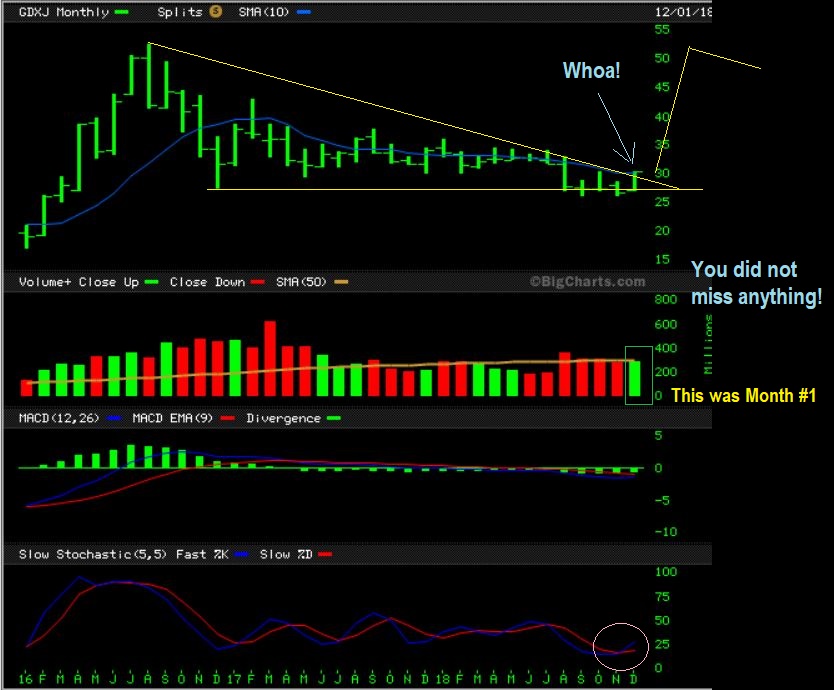
Gold has been on a run during this market correction. There is more to the story and I’d like to show you.
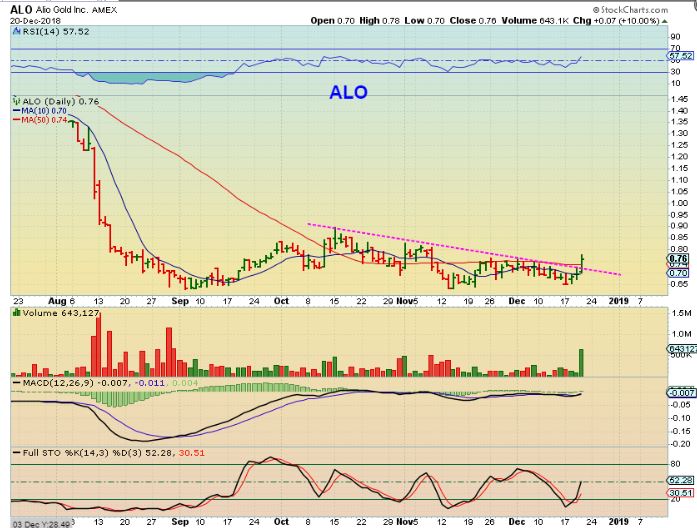
Before we get started, lets look back at $GDX and $GDXJ how they closed out 2018…
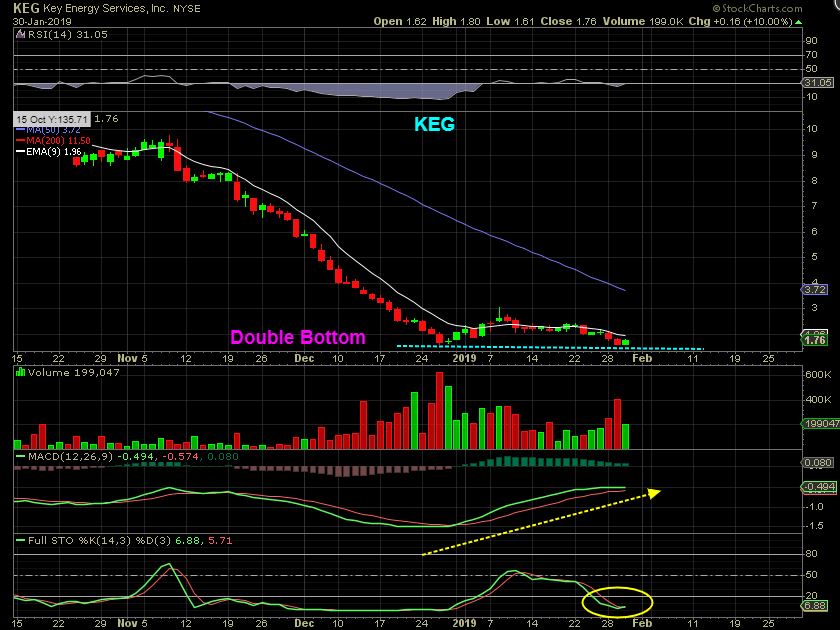
(The following is a sample of Alex’s work from the past week)
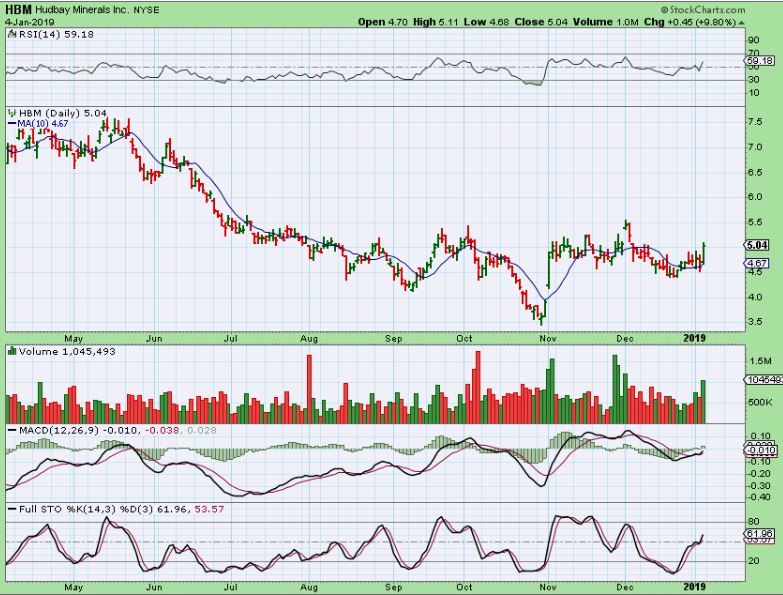
(1/9/19)
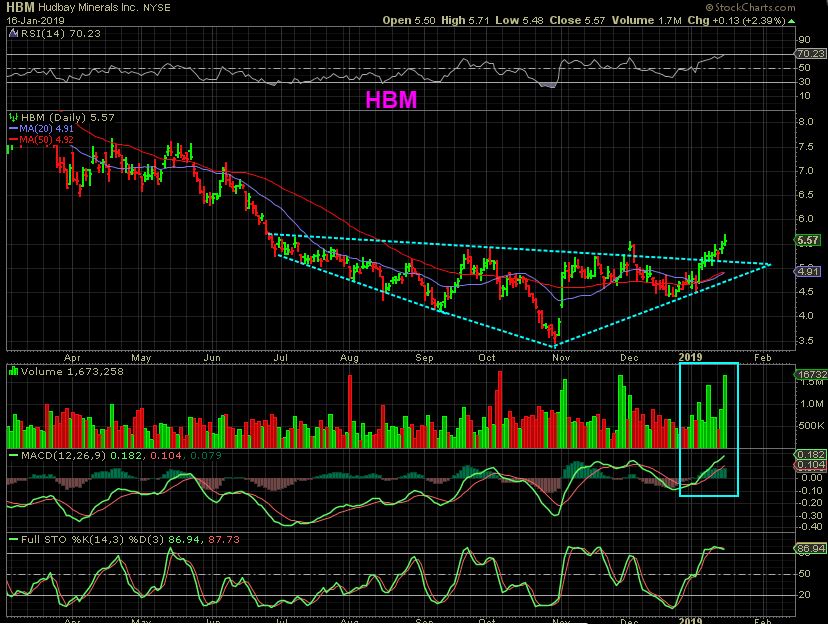
(1/11/19)
Alex has been successfully writing a daily newsletter service for nearly four years now and is considered one of the best traders of precious metals miners, energy/uranium stocks, and biotechs. This is your opportunity to join his service as a member and follow along as we enter the next bullish gold Cycle higher.

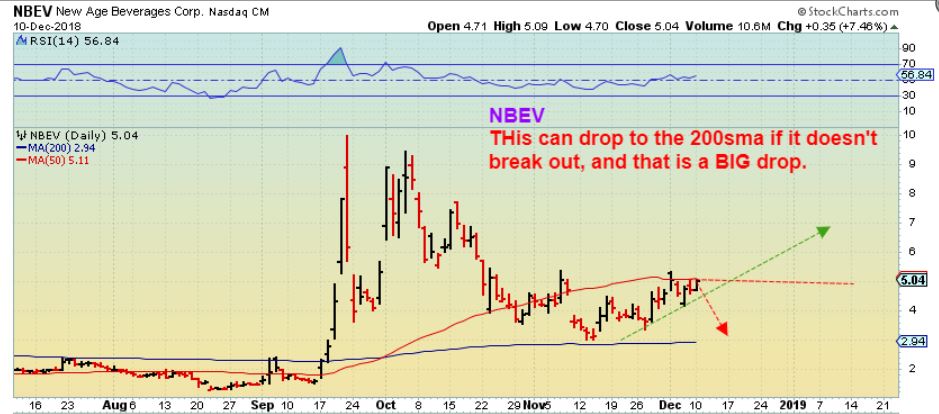
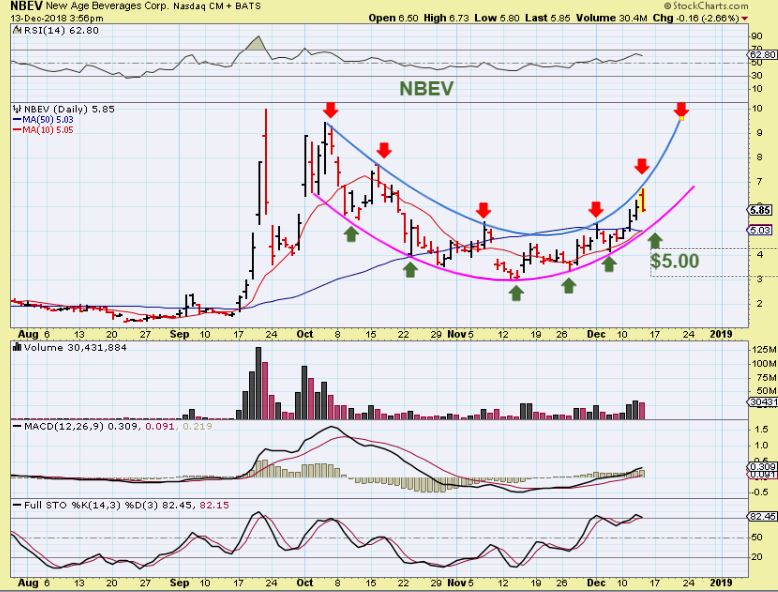
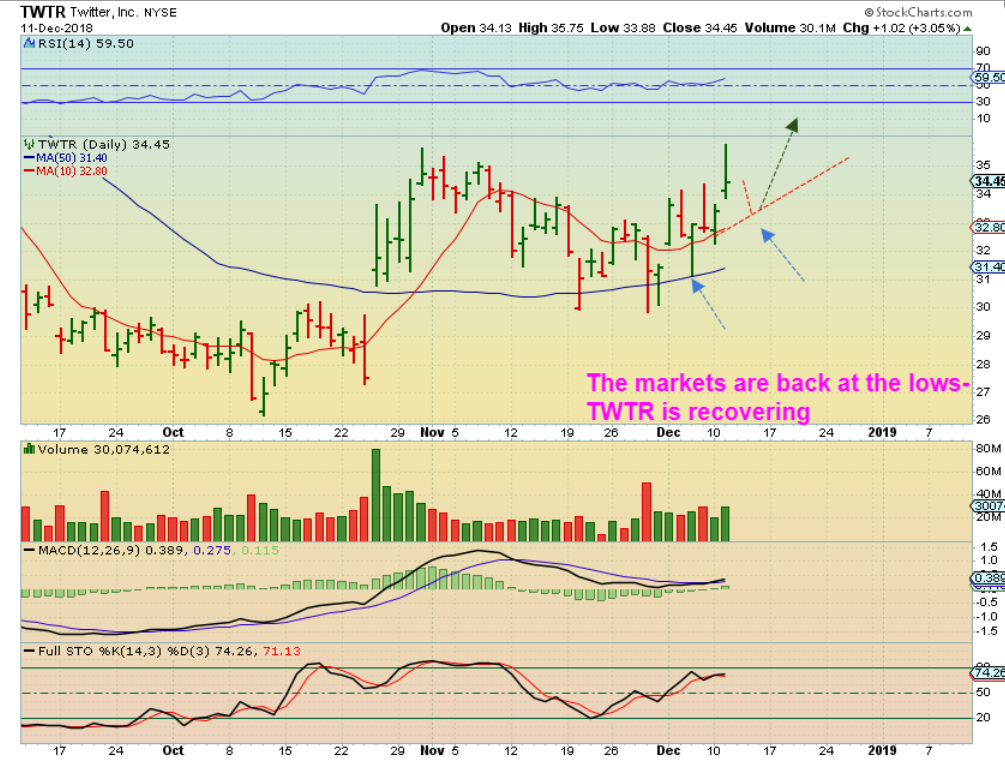
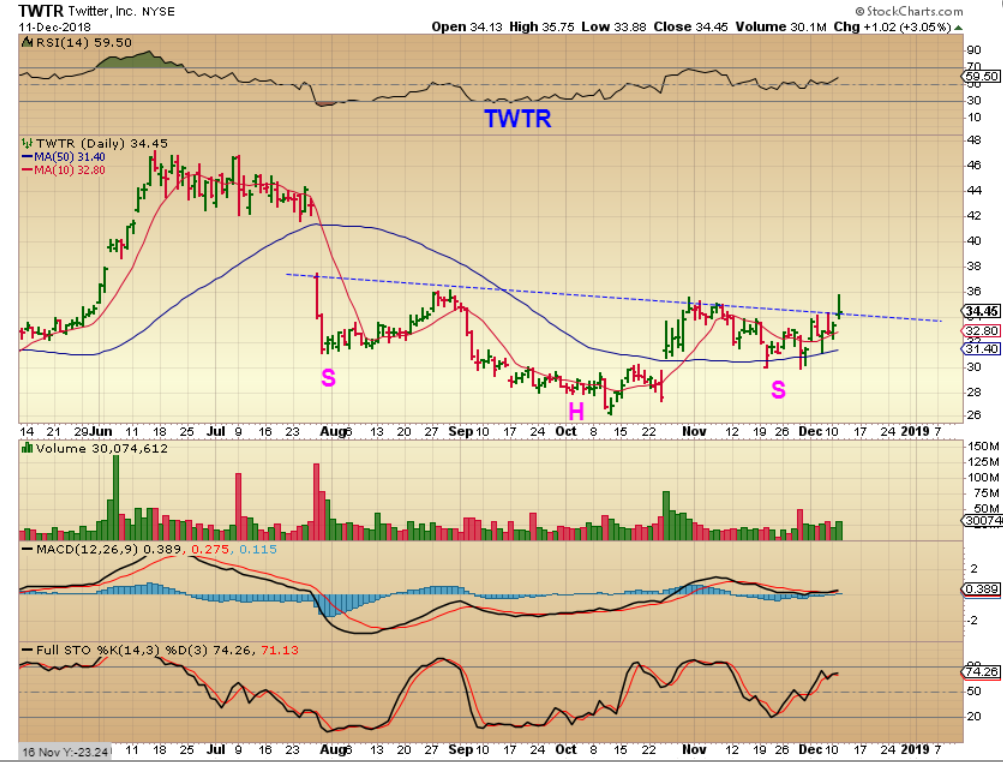
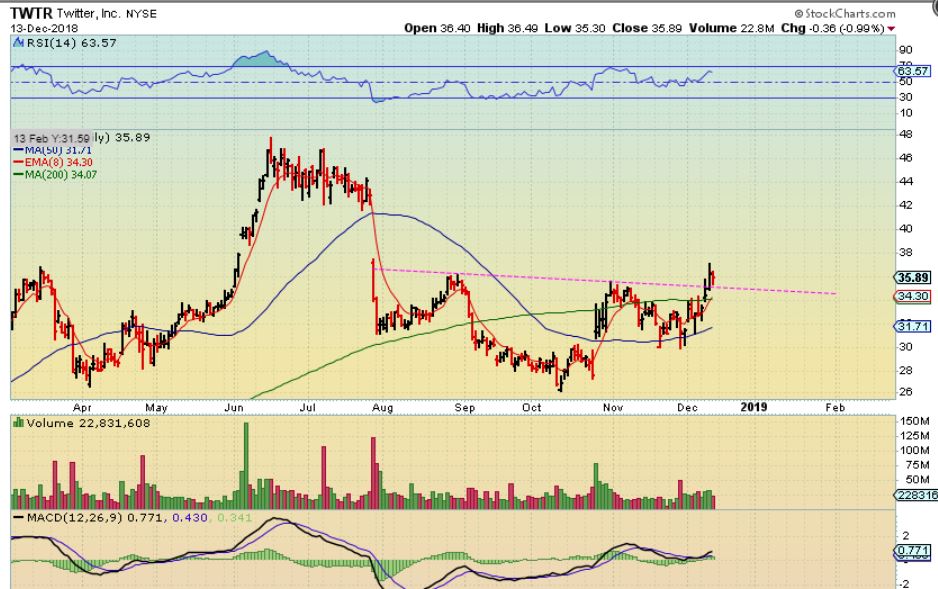
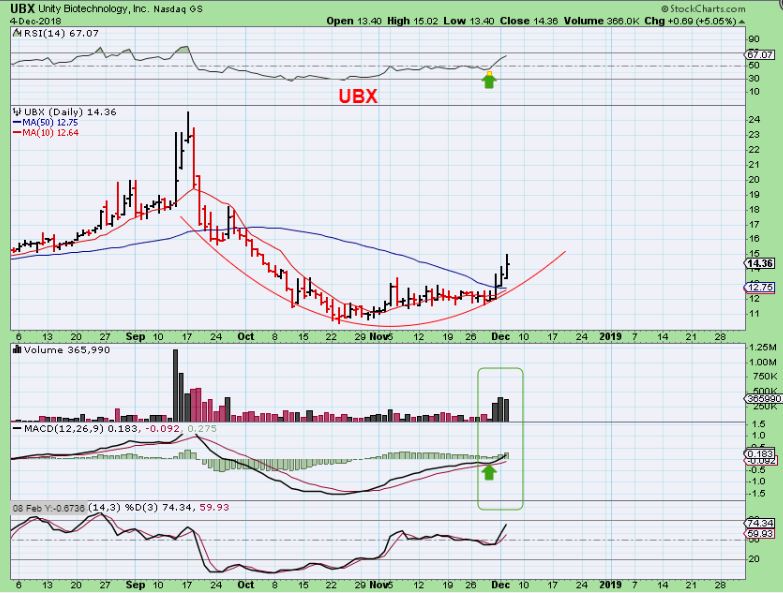
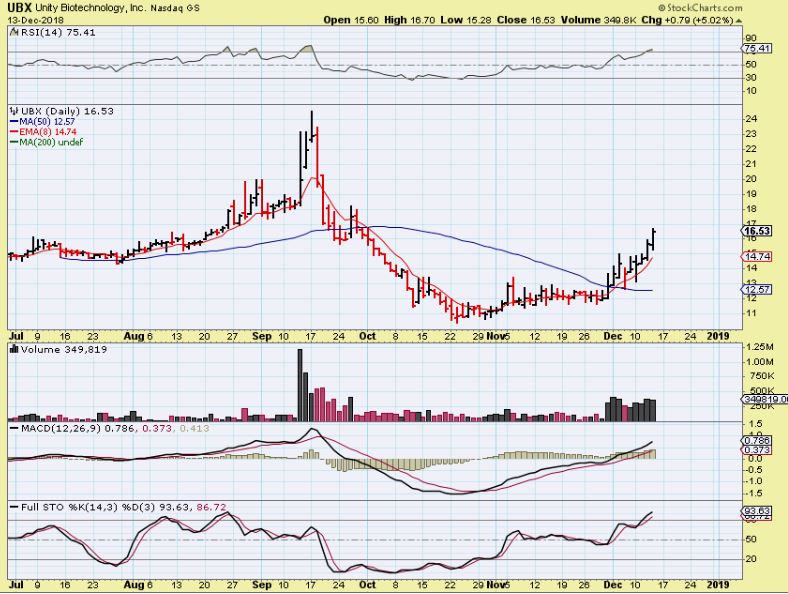
The overall market has been very choppy and that an be frustrating for a lot of traders. However, there were some real winning stocks this week. Did you catch them? Some of the highlights were $NBEV $TWTR $UBX
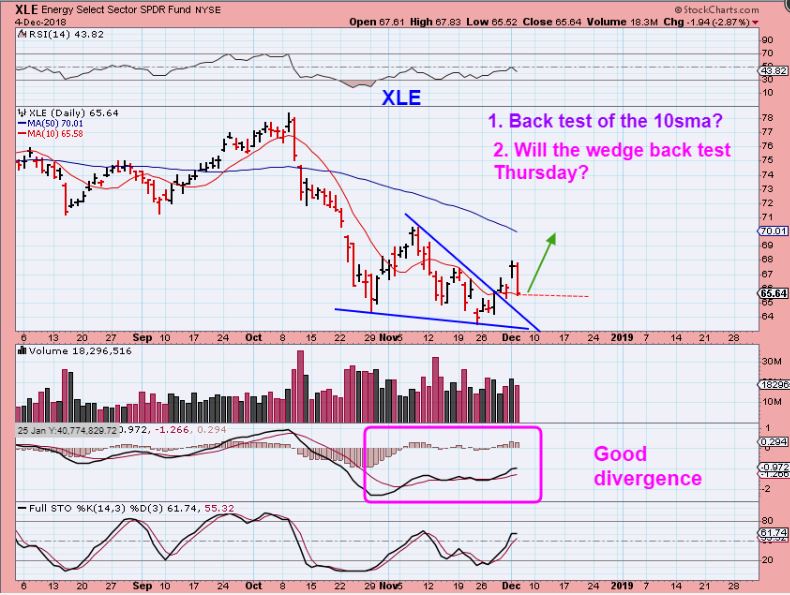
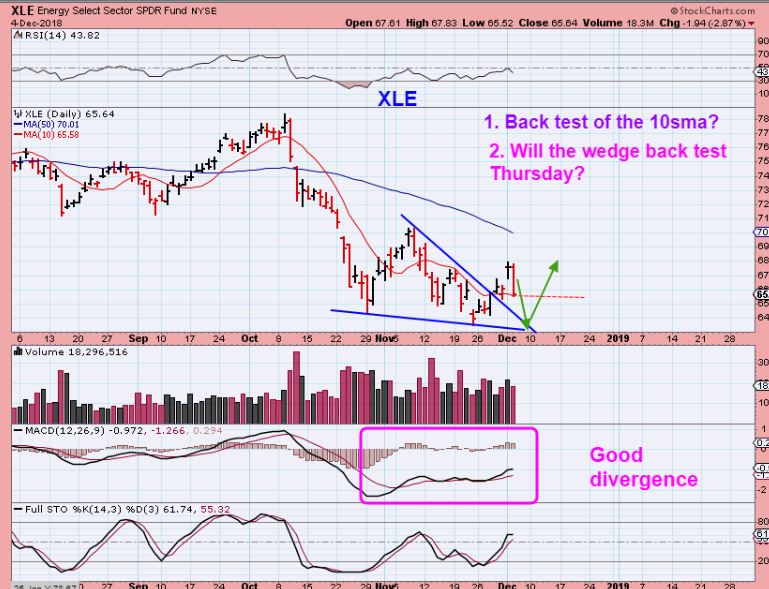
(Below is a sample of Alex’s work from throughout the week. )
(Below chart from 12/11)
(Below chart from 12/14)
(Below charts from 12/12)
(Below chart from 12/14)
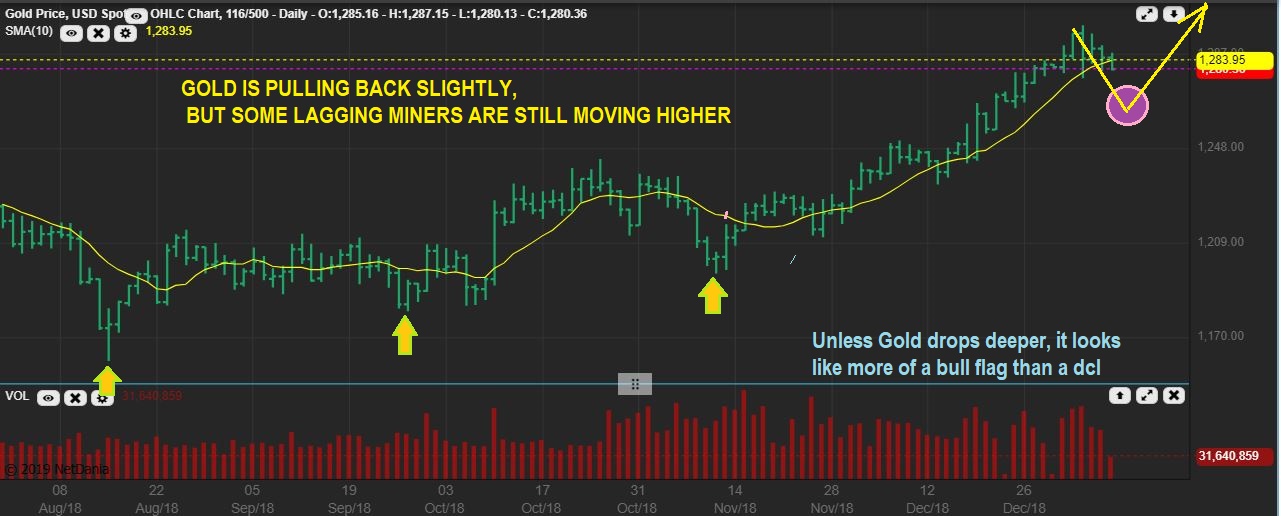
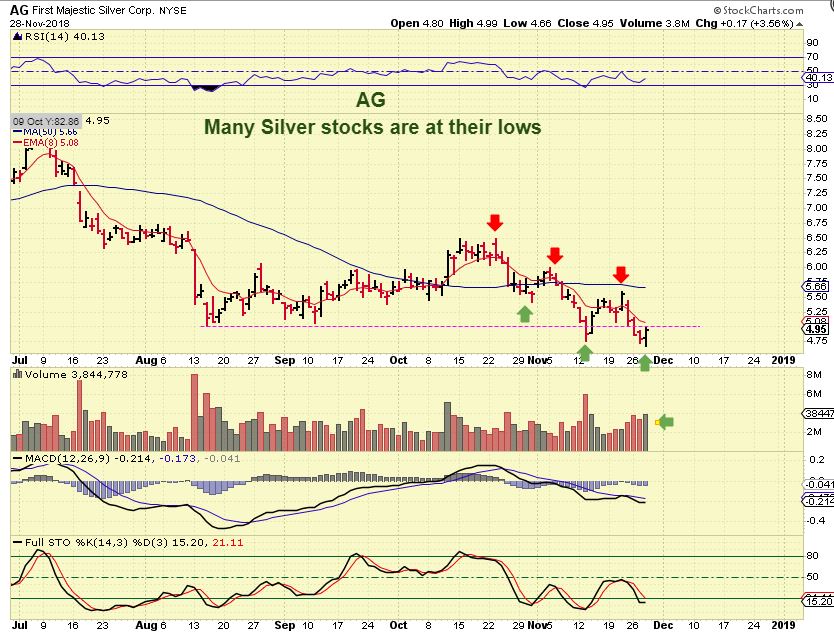
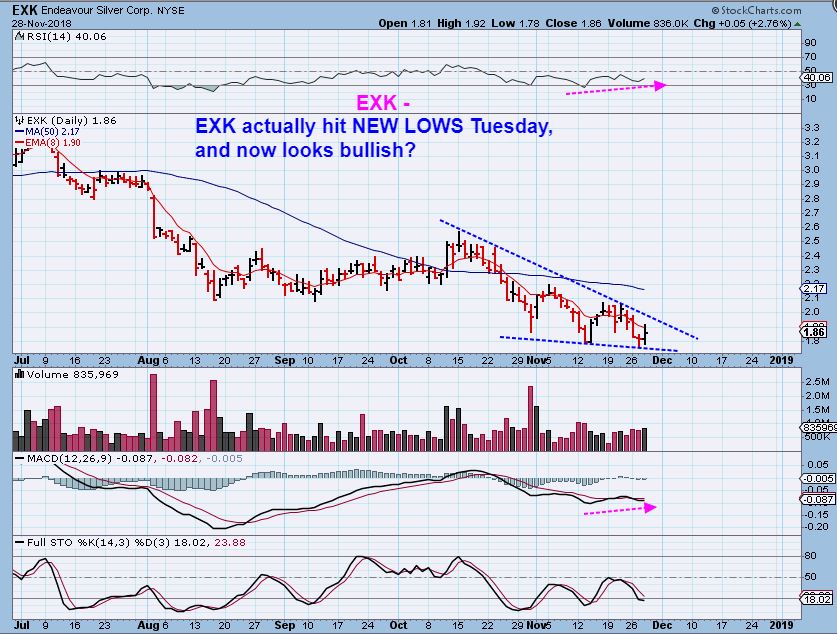
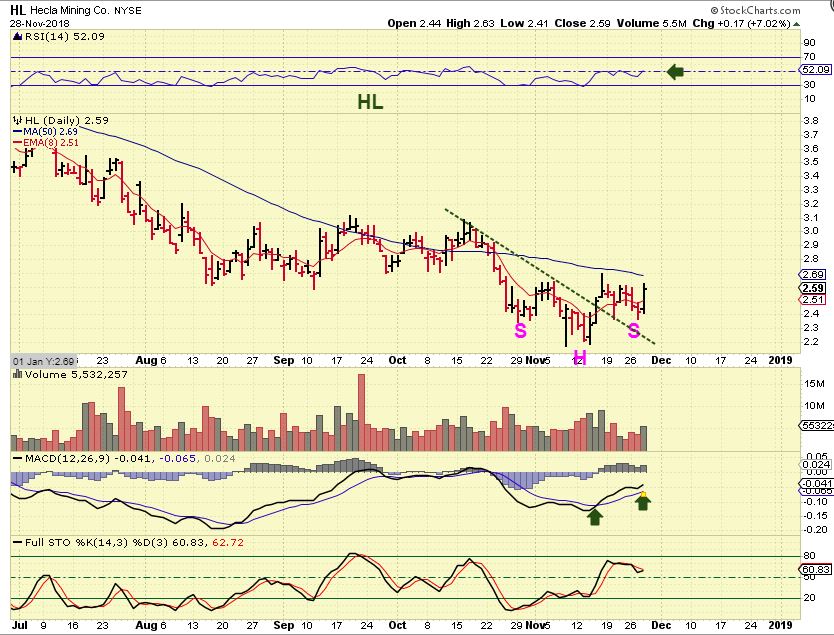
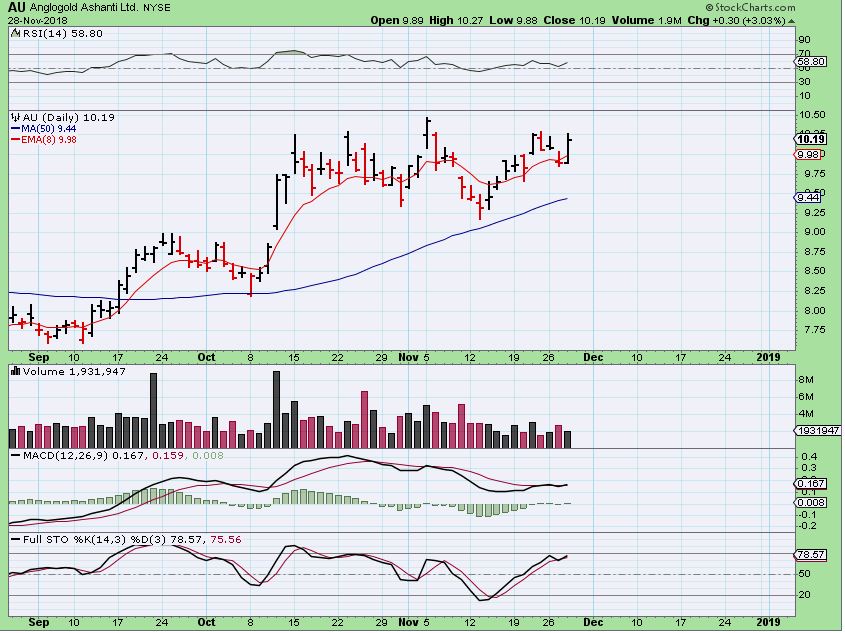
(Below chart from 12/6)
(Below chart from 12/14)
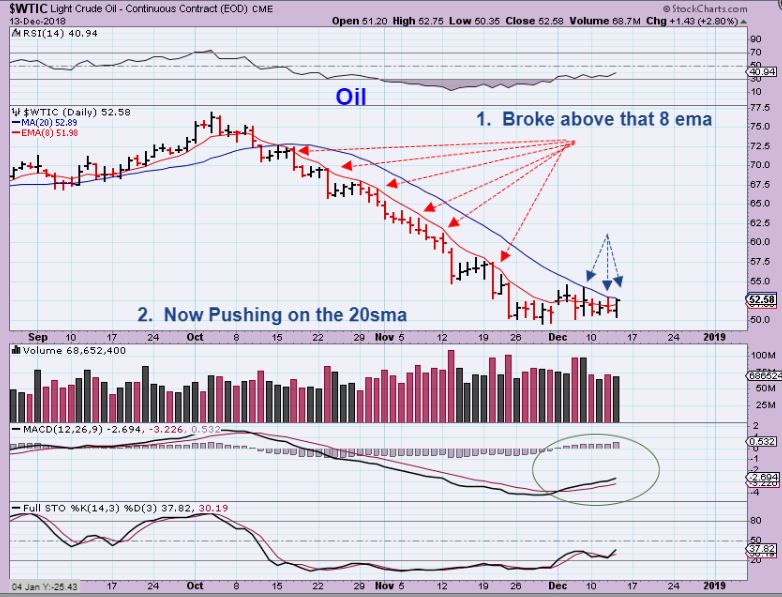
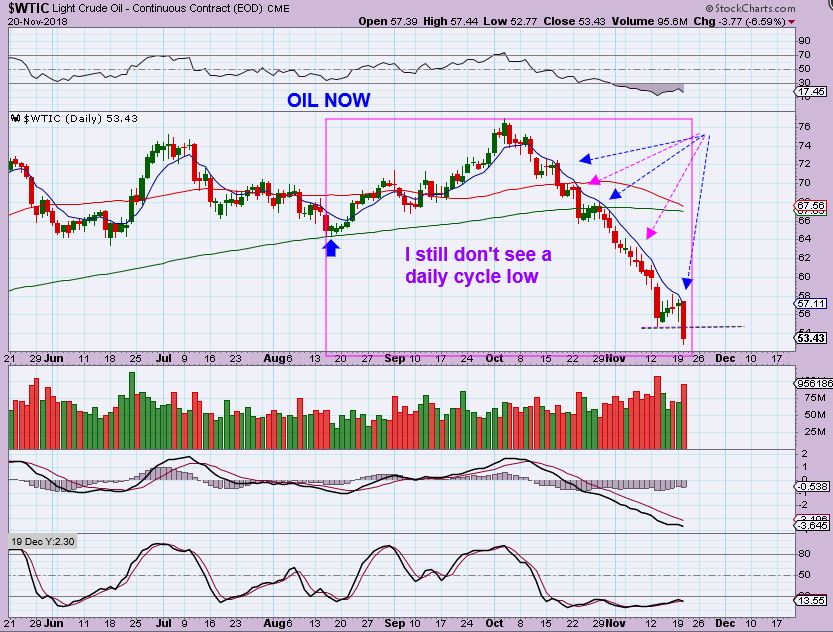
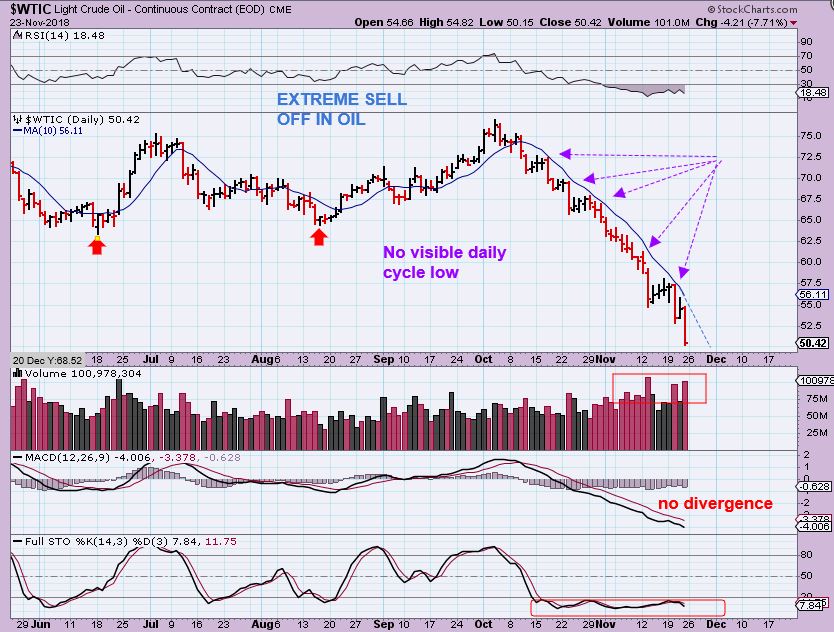
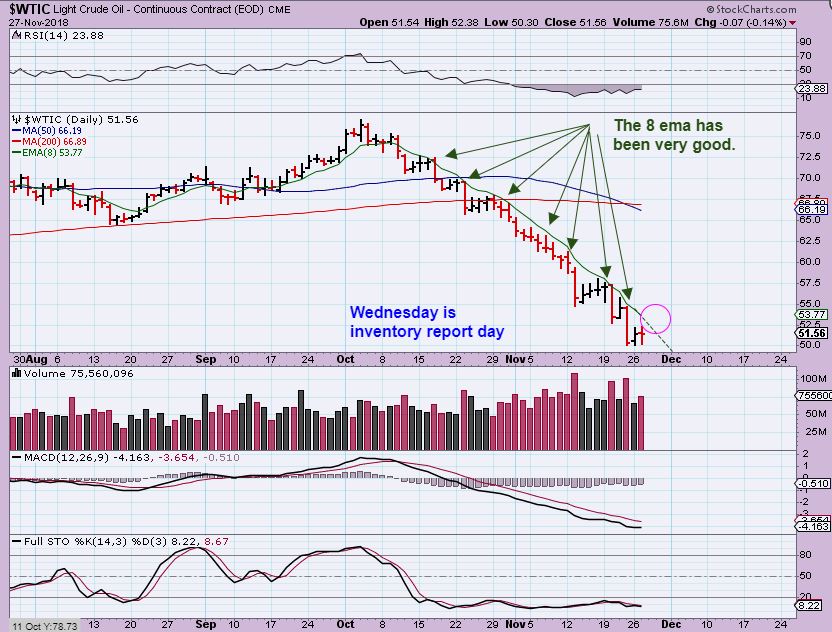
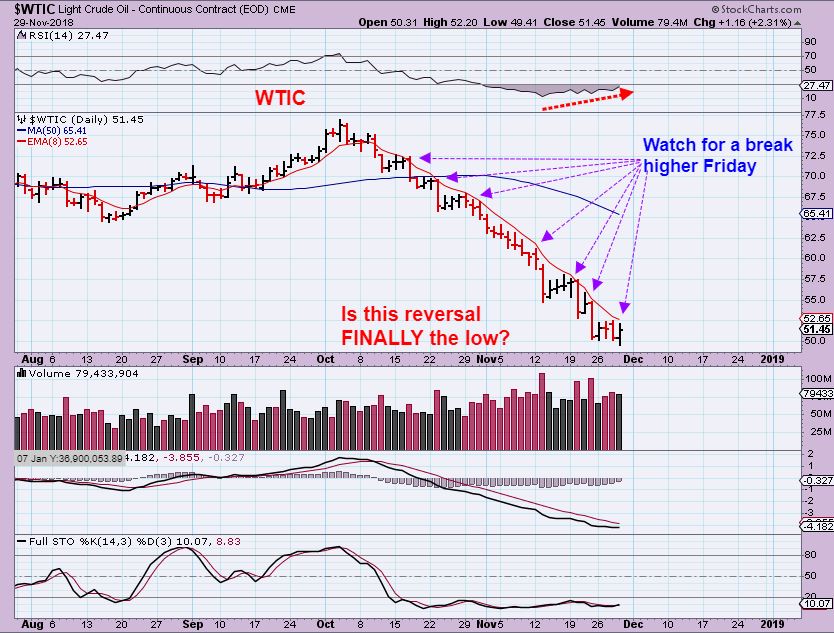
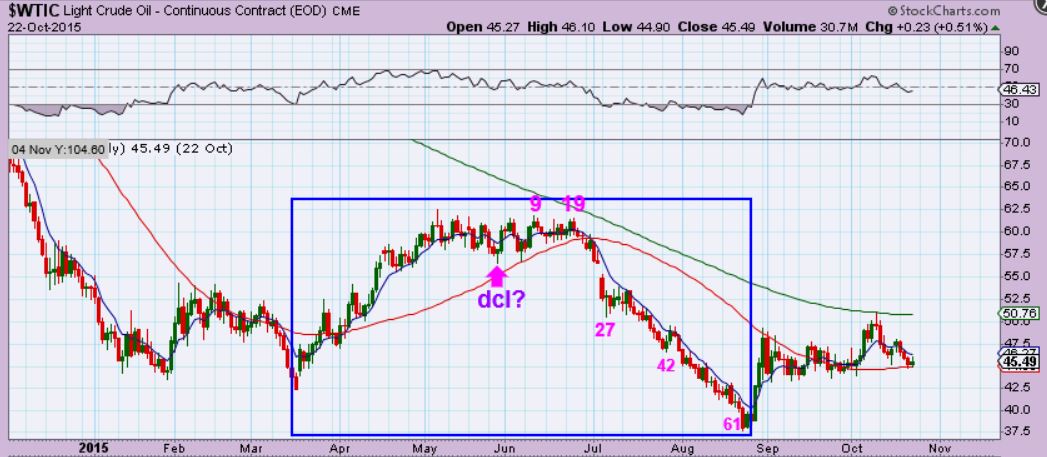
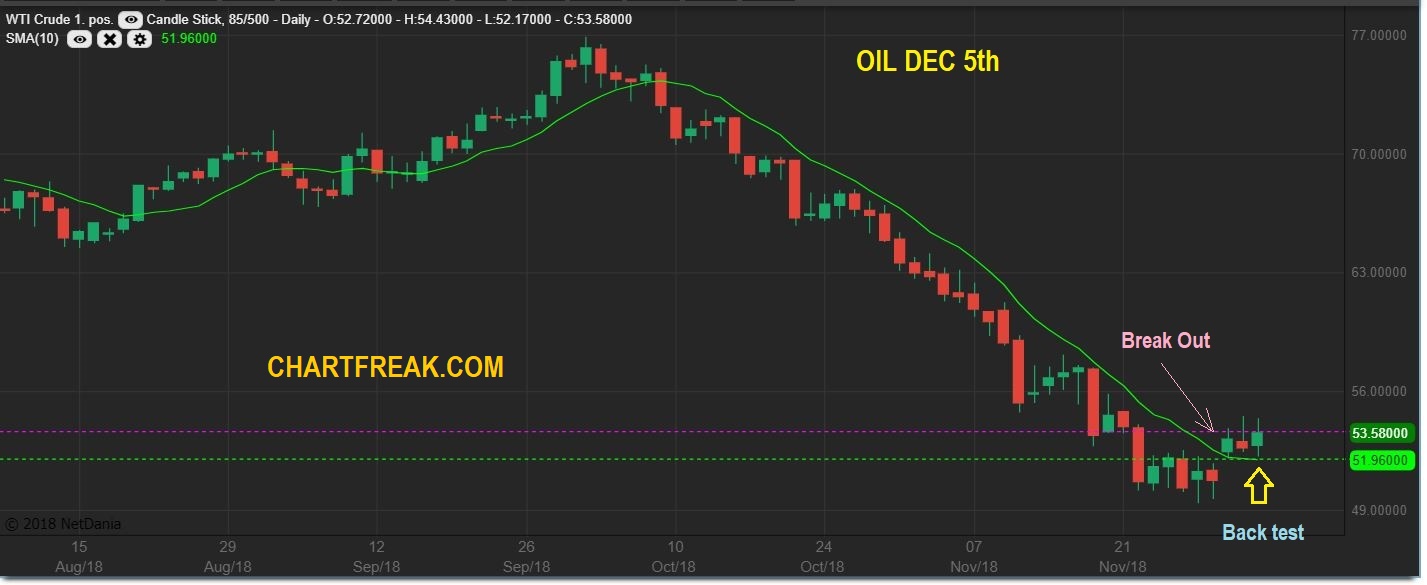
As a bonus: Keep an eye on Oil.
(Chart from 12/14)
Alex has been successfully writing a daily newsletter service for nearly four years now and is considered one of the best traders of precious metals miners, energy/uranium stocks, and biotechs. This is your opportunity to join his service as a member and follow along as we enter the next bullish gold Cycle higher.

.

,
.
.

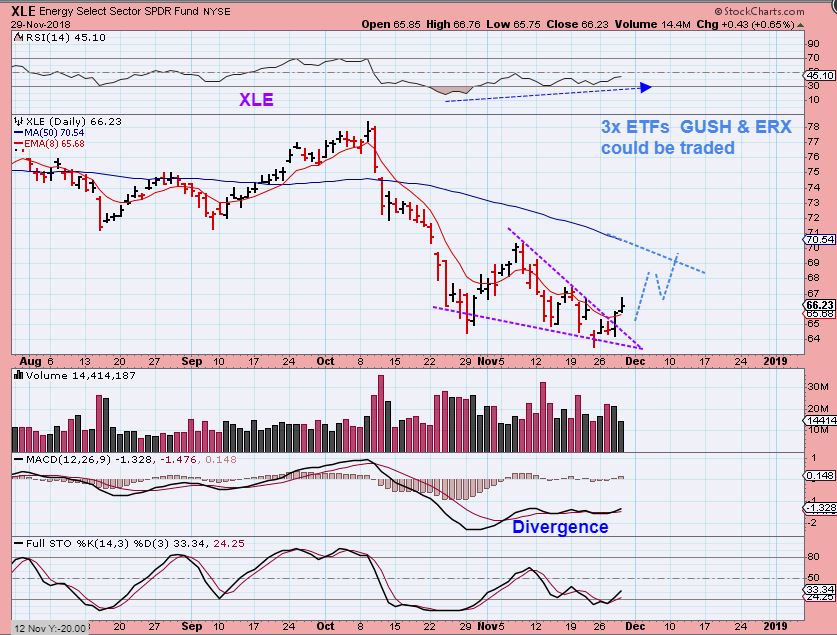
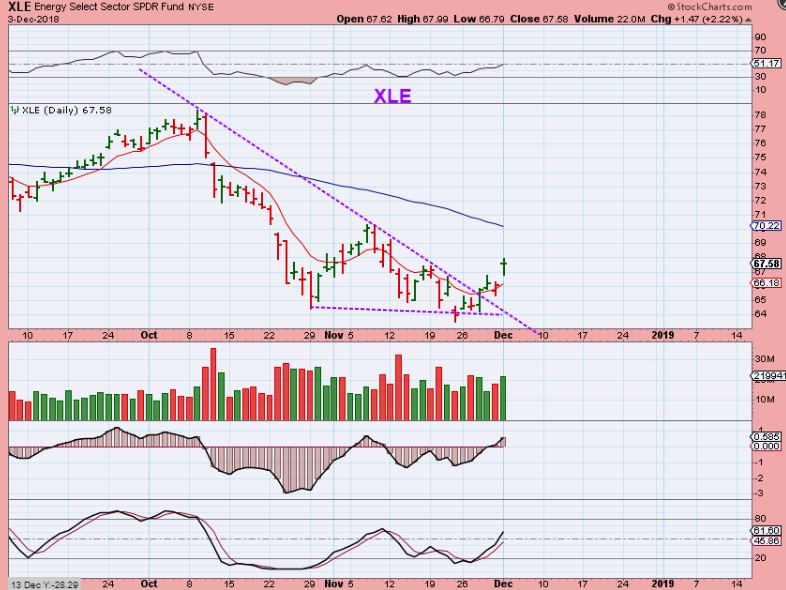
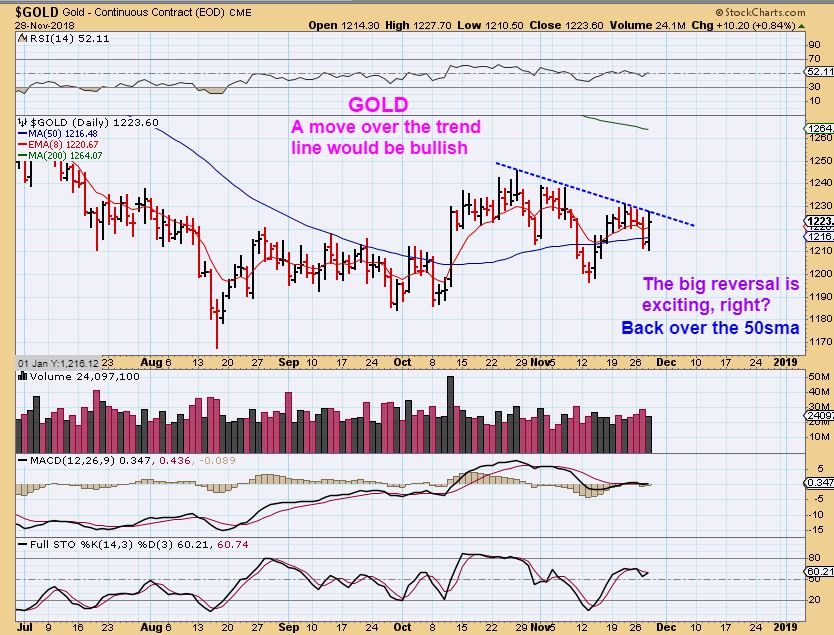
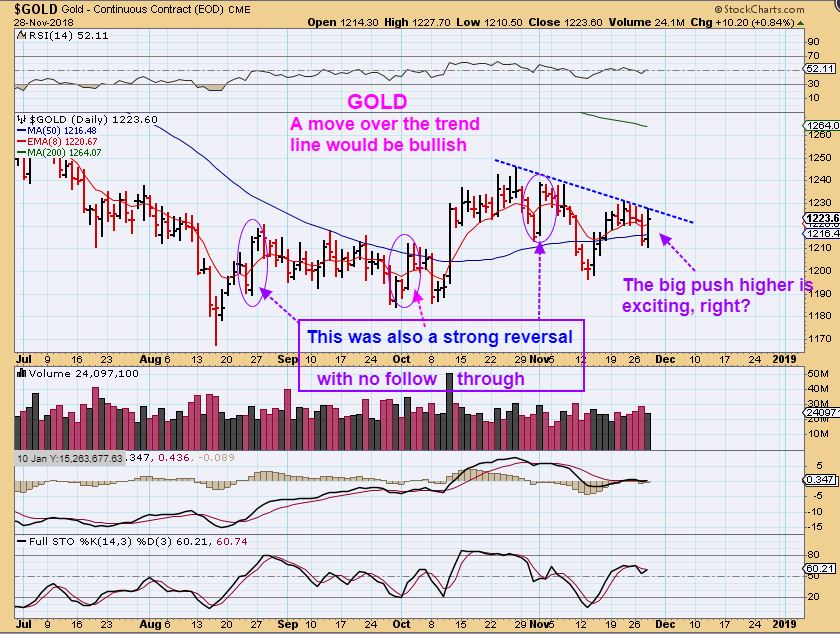
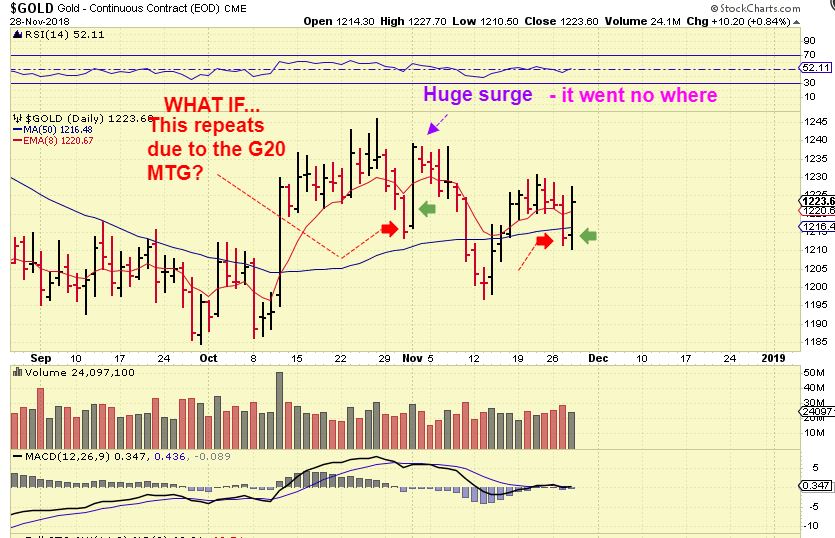
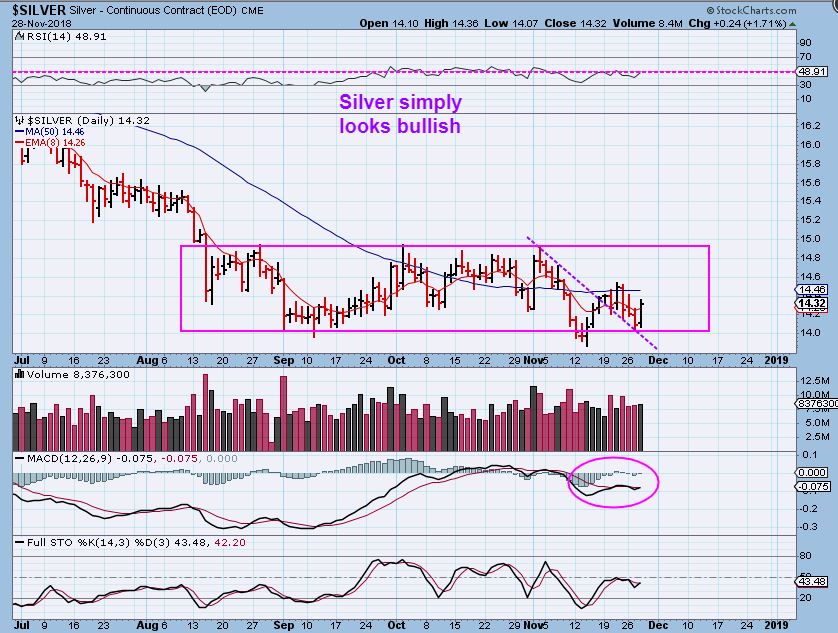
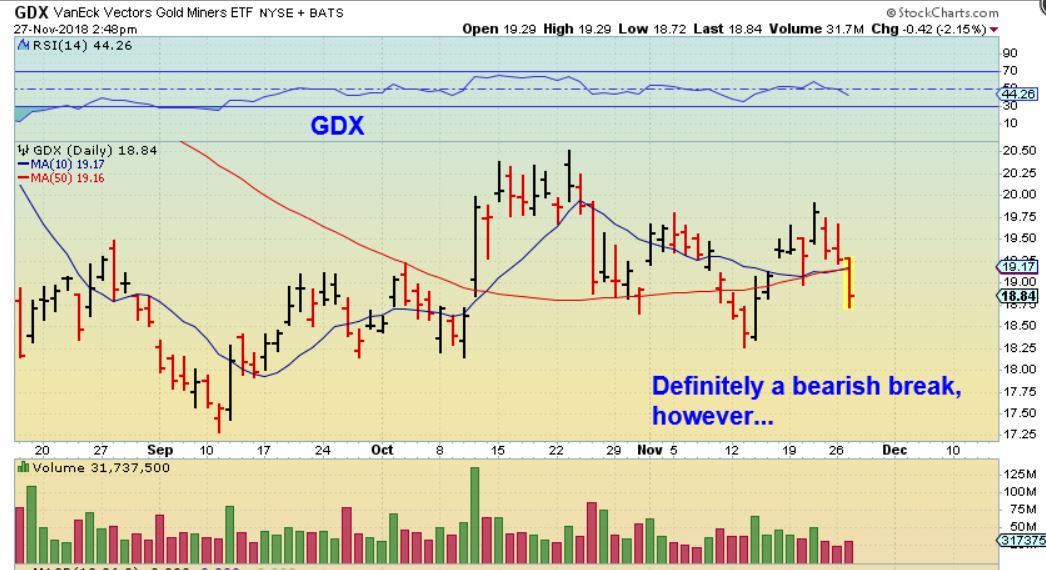
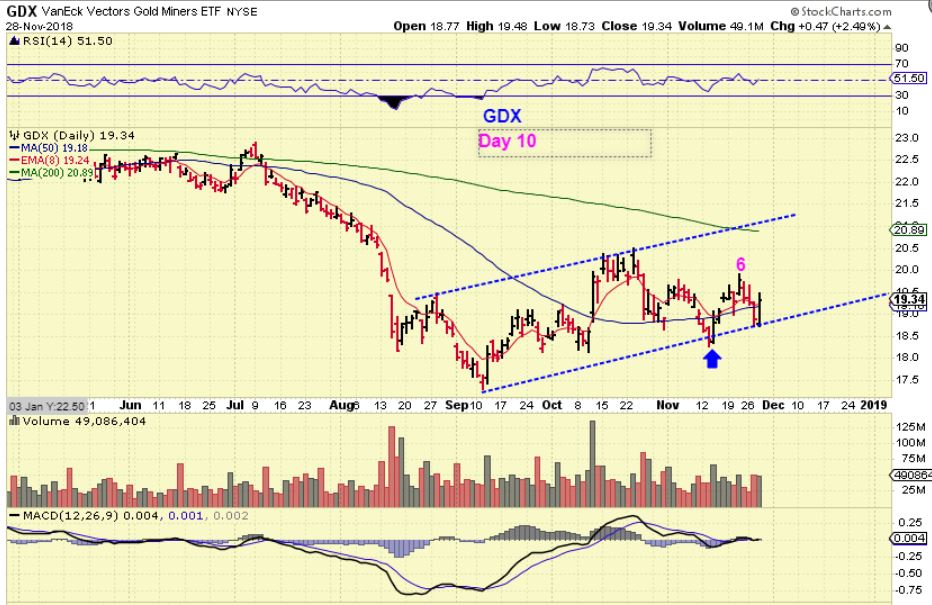
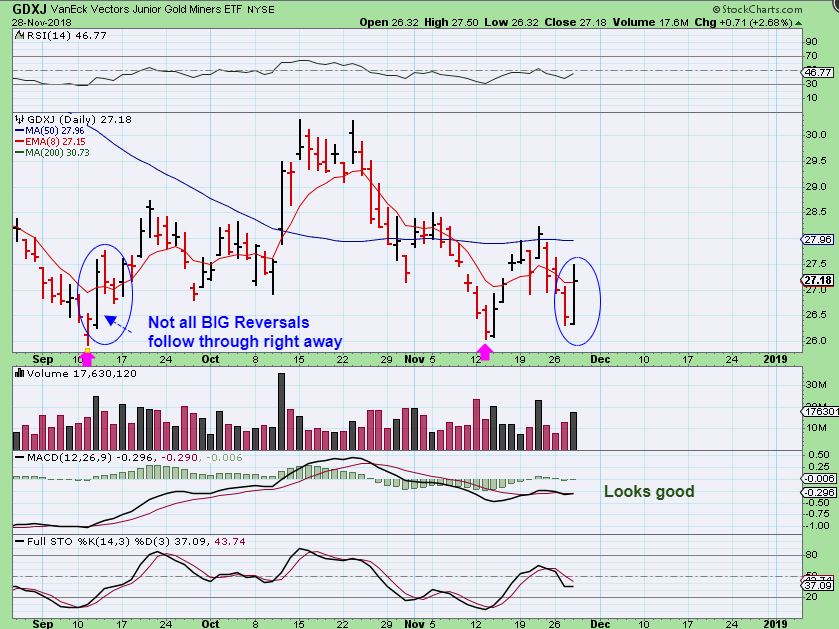
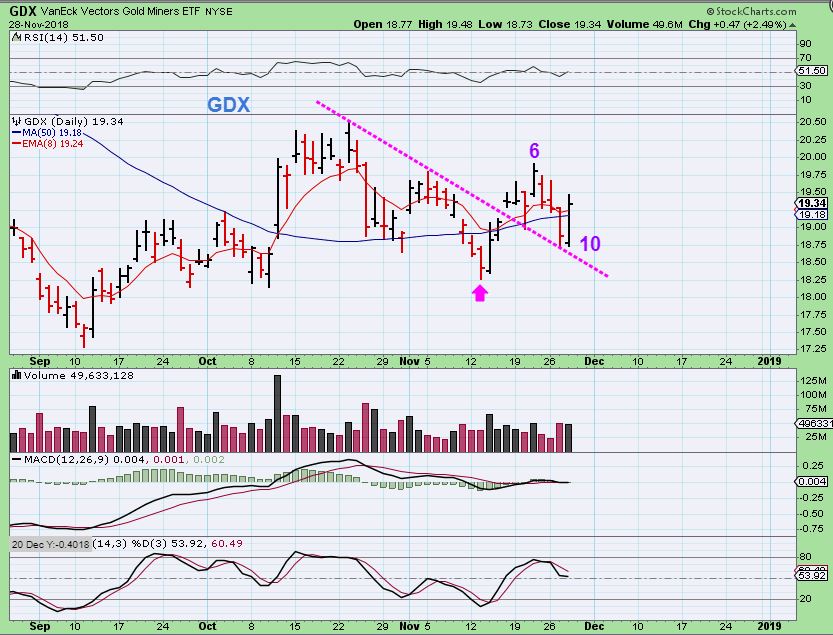
(Below is a sample of Alex’s work from the week. )
.
.
.
.
.
.
Alex has been successfully writing a daily newsletter service for nearly four years now and is considered one of the best traders of precious metals miners, energy/uranium stocks, and biotechs. This is your opportunity to join his service as a member and follow along as we enter the next bullish gold Cycle higher.