June 3rd – DIGGING FOR GOLD
My last Public Report was posted on May 11th, where I discussed the big Picture of the General Markets, and what it could mean for the GOLD, SILVER, & The MINERS, and I covered Bitcoin too. I will do a quick review here using charts from my last public report, and then an update from this weekends premium report. Since my last May 11th Public Report, we’ve continued to dig in to the Precious Metals charts, have taken positions, and are finding that things are now playing out very bullishly for Gold, Silver, and Miners (As expected). Todays public report will include a good portion of my recent weekend report.
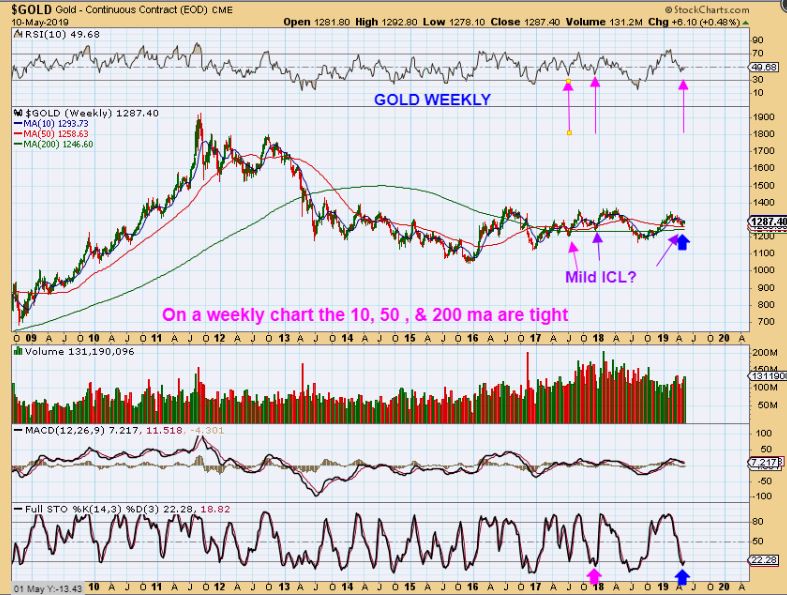
TO START THE BIG PICTURE VIEW : I discussed on May 11 that were either going to drop and make new highs again in a runaway higher, or more likely, we were going to roll over and allow the Precious Metals sector to make a strong run higher. I expected a Meaningful low ( ICL in Cycles) For GOLD, so I posted these 3 Big Picture charts of May 10.
.
SPX TOP- If this breaks to new highs and rolls over forming as Left Translated, it will be a ‘Bull Trap’. It can roll over until that period of selling ends with our next dcl. The 3rd daily cycle drop and especially the 4th can drop quickly too.
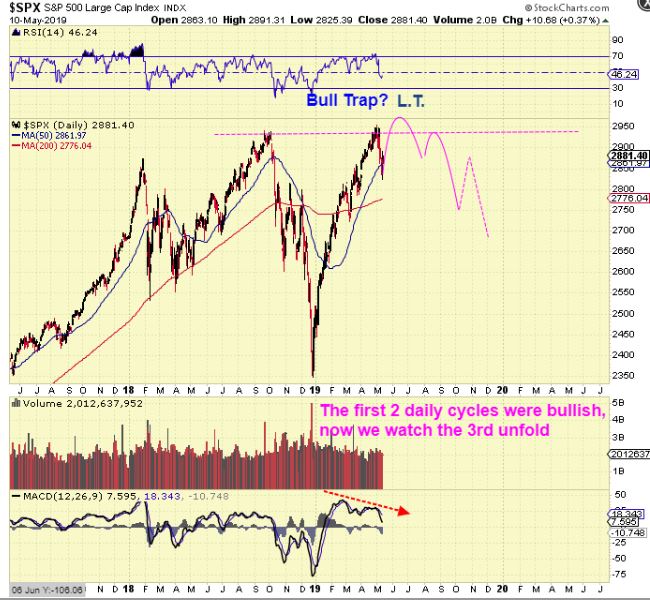
SPX DAILY – Look how sharply the SPX dropped from Oct to Dec. That could repeat in our 3rd & 4th daily cycle.
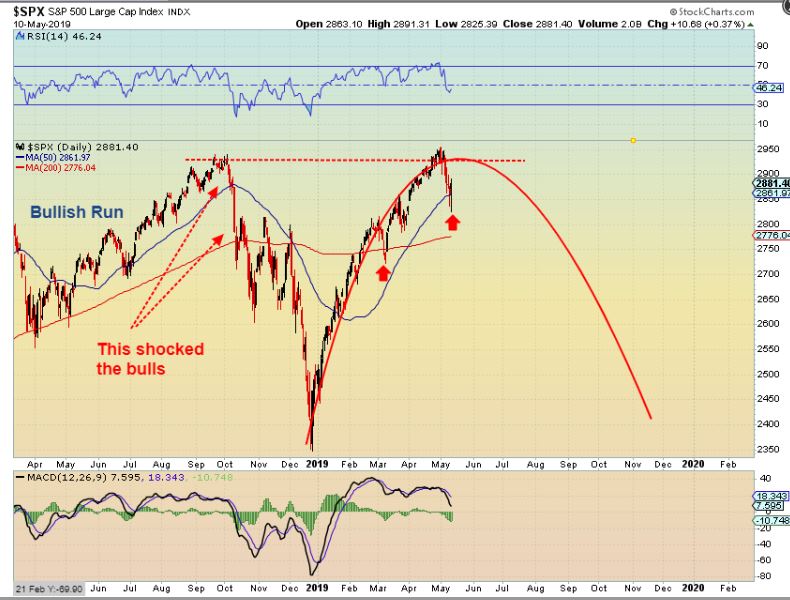
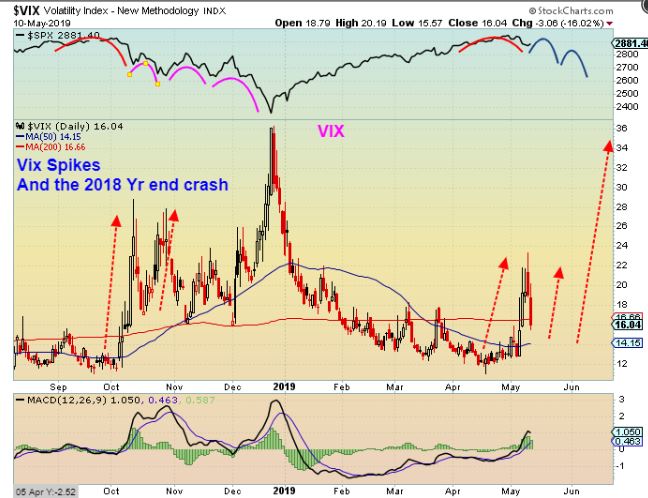
SPX – I see that RSI was a bit weaker than prior times at these highs. I warned that a DCL was coming due and that things could also get choppy and sell off. This looks like a triple top . THIS COULD BE GOOD FOR GOLD.
NOTEWORTHY VIX- we also discussed the VIX
.
MY CURRENT UPDATE FROM THE JUNE 1 PREMIUM WEEKEND REPORT :
.
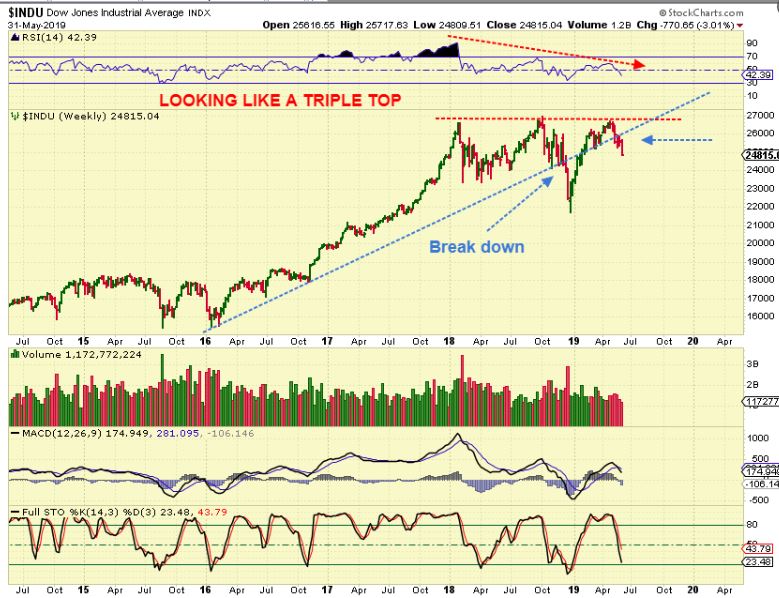
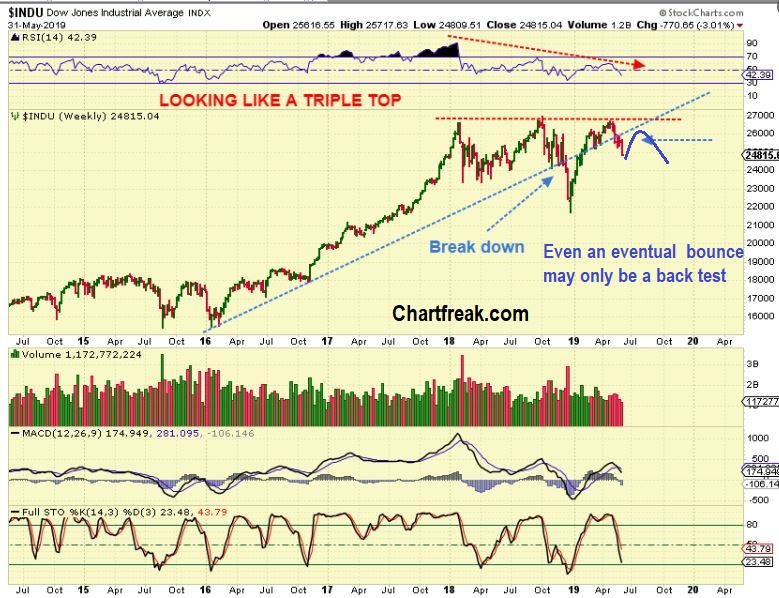
DJIA WEEKLY – This is looking like a Triple Top and breaking below the upward trend line again. This has helped GOLD.
Even if we see a relief rally at any point (maybe some progress on Tariff talk or something like that), it may just lead to a back test before the next leg down.
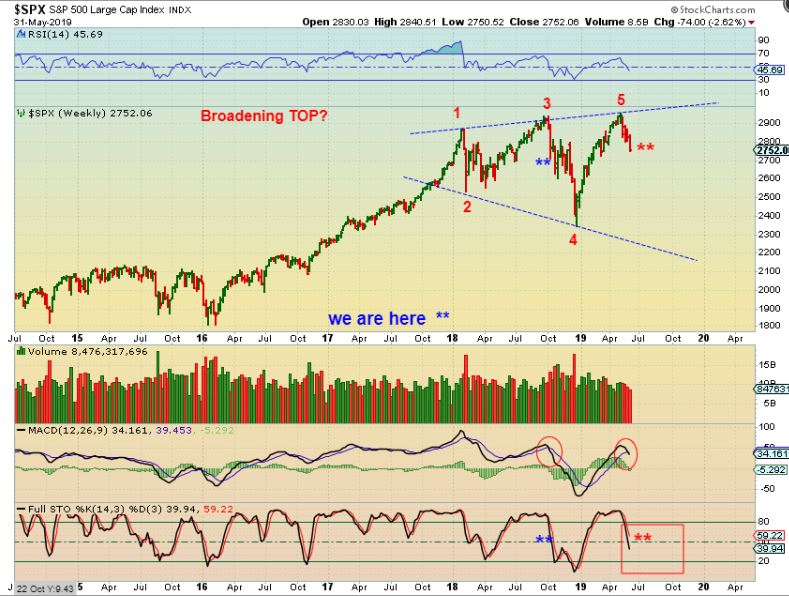
SPX WEEKLY – This would also indicate that a top is in place for the General Markets. This kind of Drop could cause Gold to do the opposite ( safehaven). Take a look at these ** marks for similarities to a recent crash in 2018, this has room to drop.
My daily reports will monitor it along the way on a day to day basis, and The Big Picture weekend report always focuses on the Bigger Picture.
.
FROM THE MAY 11 PUBLIC REPORT- you can still read that whole report, but here are some excerpts OF WHAT I EXPETCED …
.
The Precious Metals Sector MAY 10
We have really been focused on this area. The Timing is complete for a meaningful low. In past Bull Markets, I have found cases of Milder ICLs so I pointed those out in past reports recently. The way I see things, we must be VERY CLOSE to a meaningful low here, and a strong rally should follow.
.
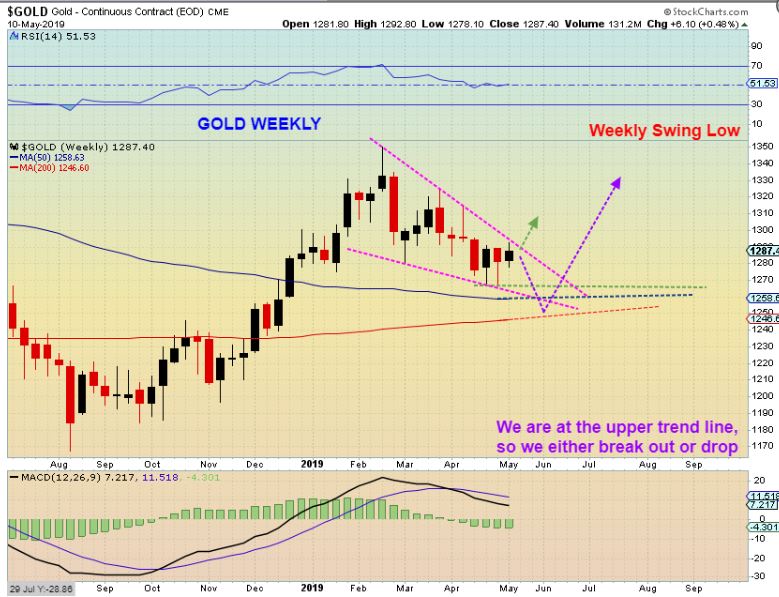
GOLD WEEKLY BIG PICTURE – The Milder ICLs pointed out on this chart look similar to what we see now. We have a weekly swing low now, so this may be THE LOW as of early May.
.
GOLD WEEKLY – Gold sits above the 50 & 200 weekly ma in a bullish descending wedge. A short quick slam to those are possible, but a break out higher is a buy.
.
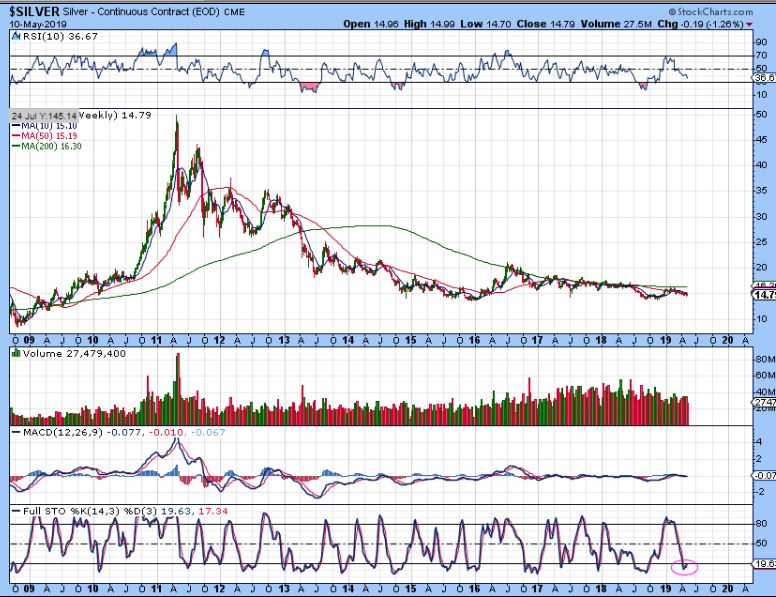
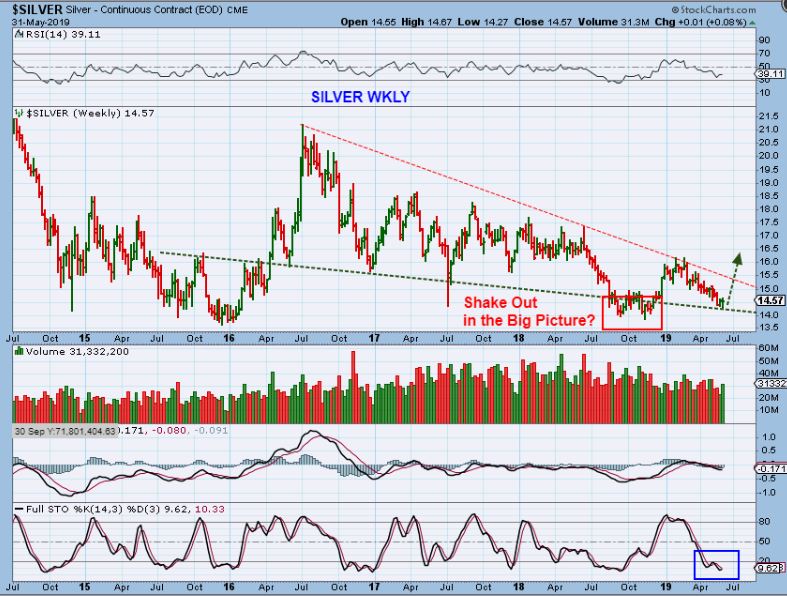
SILVER WEEKLY BIGGER PICTURE MAY 10 – This very large base should have Huge upside potential. I have discussed Silver in detail in many of my past reports and not much has changed this week.
.
MINERS MAY 10
,
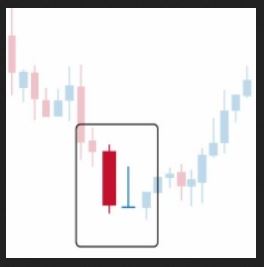
GRAVESTONE DOJI – The 2 candles on the right are 2 that I have pointed out many times. Though it is a ‘bearish looking candle’ to many, it often is NOT bearish. After a sell down, it closes at the lows, but it is quite often actually bullish.
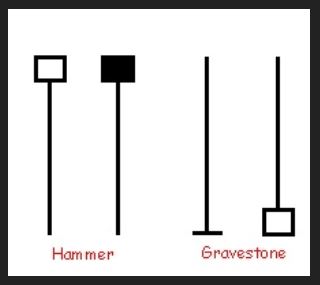
As seen on this chart, price can drop below the gravestone doji, but it is usually a reversal soon after, since selling has dried up. Well…
.
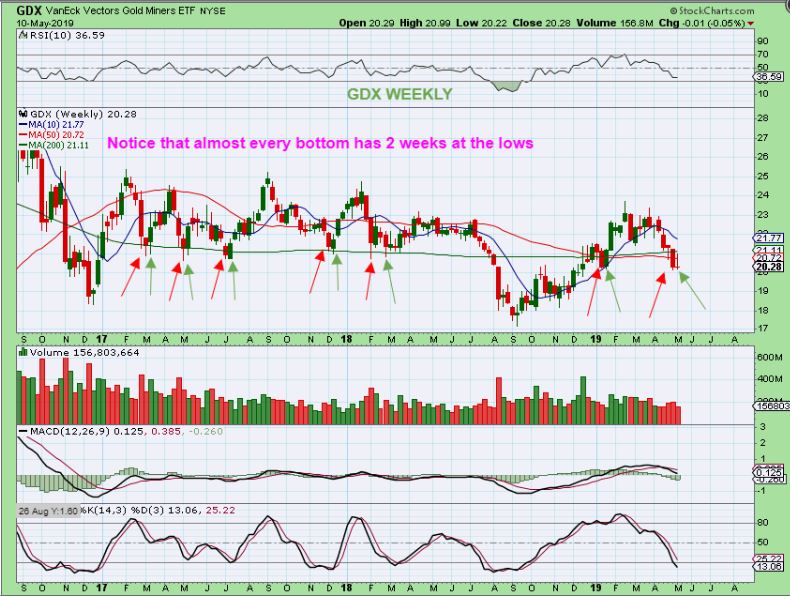
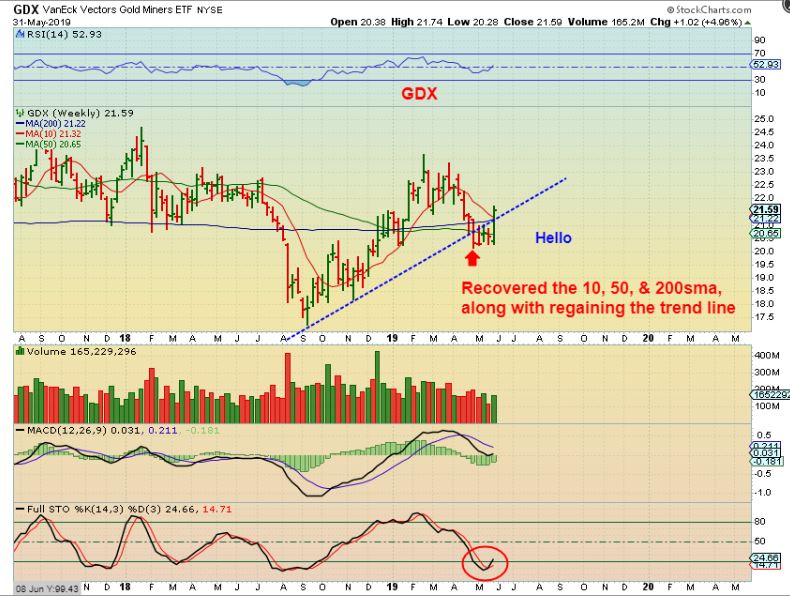
GDX WEEKLY – Fridays sell off caused a Gravestone Doji on the weekly charts. The lows may be in. So this makes things a bit more interesting heading into next week, right?
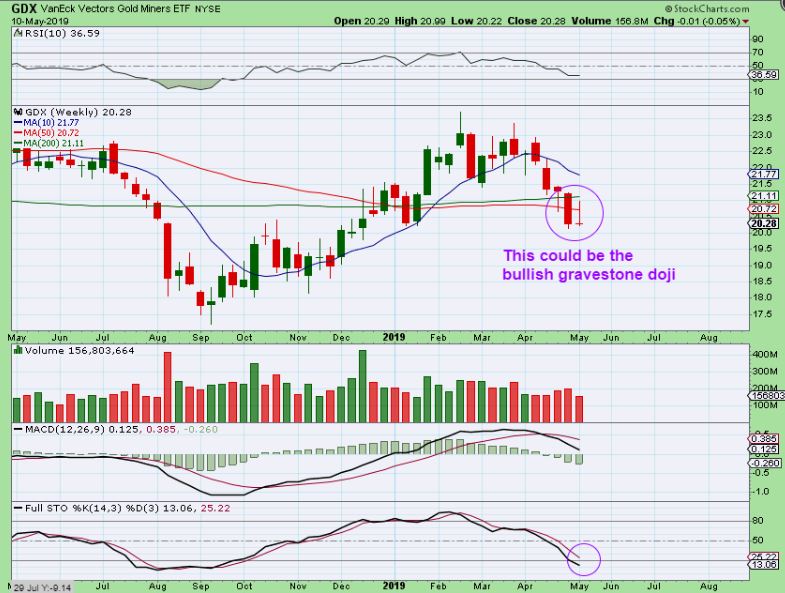
GDX WEEKLY – This is an area that we have been looking for a low to possibly form…
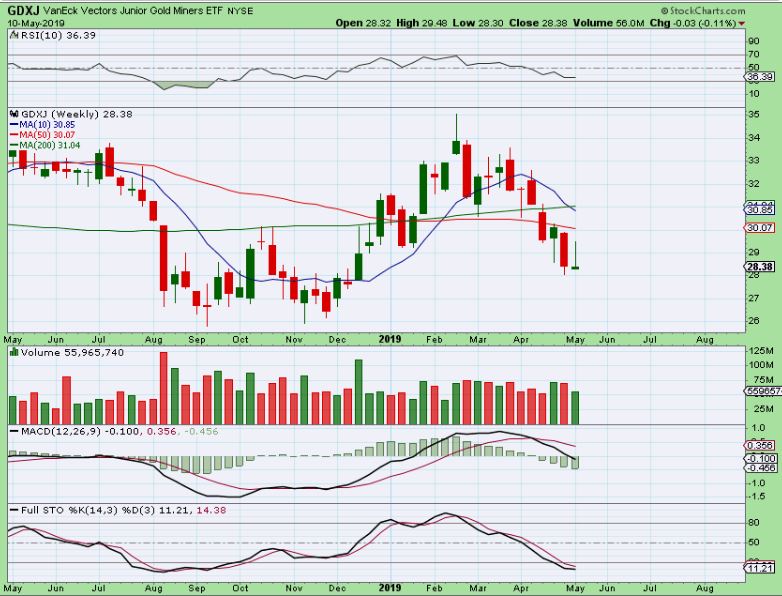
GDXJ WEEKLY – Another gravestone doji for the GDXJ, HUI, and XAU WEEKLY too.
,
NOW A FEW UPDATES FROM MY CURRENT WEEKEND REPORT JUNE 1, 2019
.
USD DAILY – Short term cycles indicate that the USD topped on Day 8, but the BIG PICTURE tells the real story!
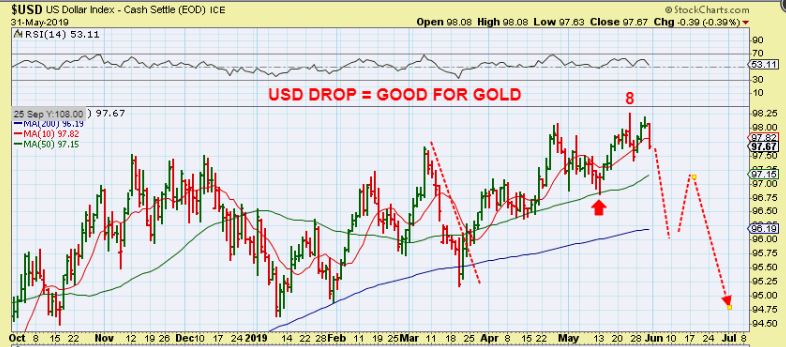
USD WEEKLY BIG PICTURE – When distribution ends, Selling takes over. This is a rising bear wedge of distribution for the Big Picture USD. That is usually also Good for Gold.
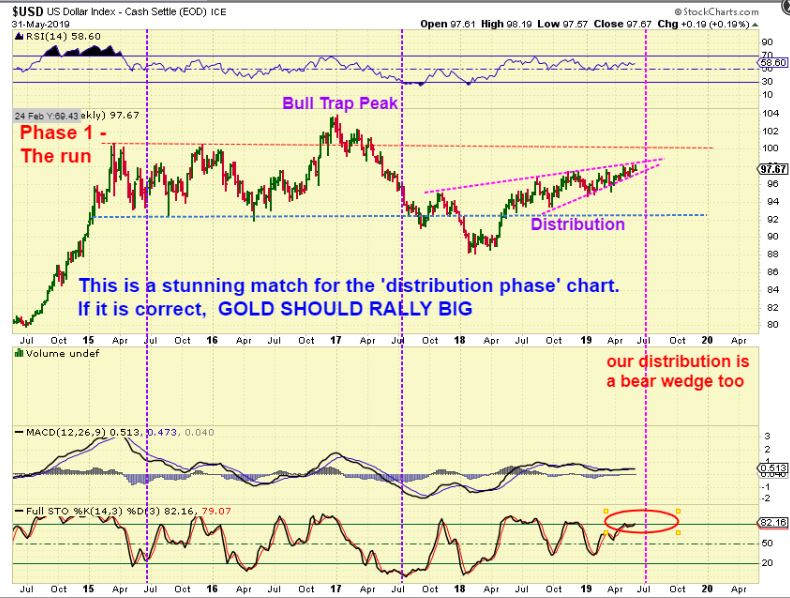
THAT BIG PICTURE USD LOOKS TOPPY and THAT SHOULD BE GOOD FOR GOLD
.
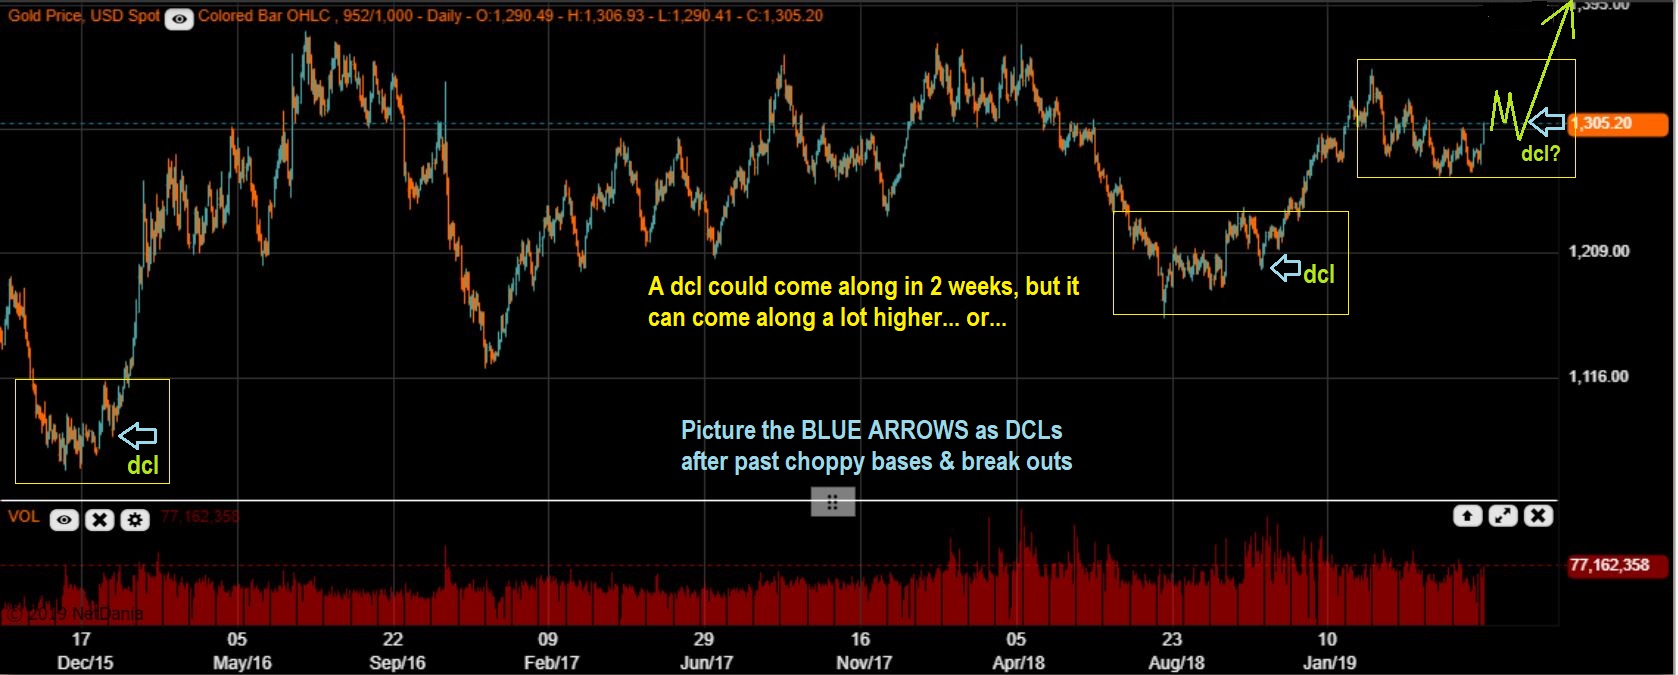
GOLD THIS WEEK: IT IS VERY CLEAR THIS WEEK THAT THE BULL OVERTOOK THE BEARS. TO BE CLEAR, THIS IS BULLISH! 2 Yellow Arrows show A HIGH ICL IS IN PLACE IN MY OPINION.
![]()
.
GOLD DAILY – Click to enlarge if necessary – This can just run away higher and leave many behind, but here I want to point out that a dip was seen in 2016 and also the last Aug ICL had a dip (blue arrows) , so I drew a dip in here. IT IS A BULLISH SET UP even if we see a dip, BUY THE DIPS .
.
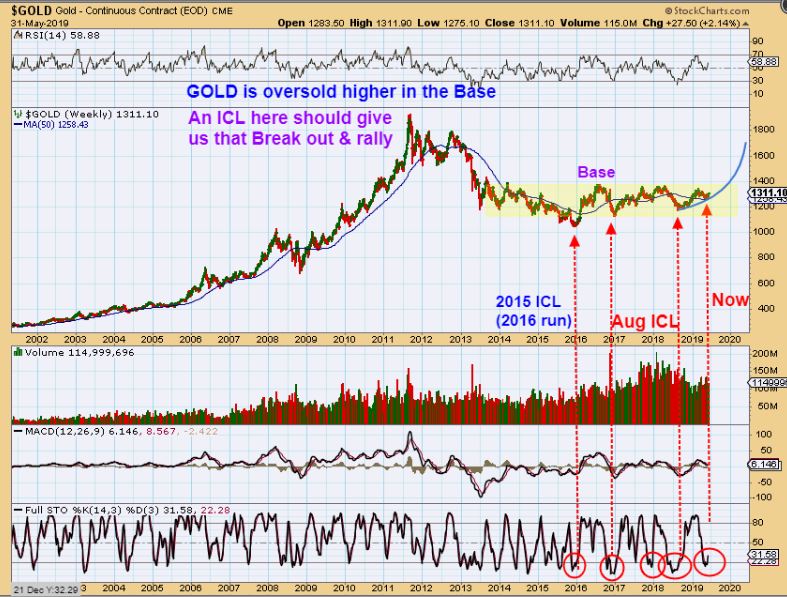
GOLD WEEKLY – This is the Bullish Base set up. We are forming an ICL higher up in the base, so an ICL here can lead to much higher price over the next few months. MUCH HIGHER, like $1400, then $1600, etc . Gold is ICL Level Oversold and can move higher for weeks .
.
SILVERS BIG PICTURE – The August & November lows actually look like a shake out and this could be the real launch pad. Silver is very oversold . IF SILVER BREAKS OUT HERE, MUCH HIGHER PRICES COULD BE IN STORE FOR THE BEATEN DOWN SILVER STOCKS. I will discuss individual Miners in daily reports.
.
This is a copy of GDX from Friday Mornings Report – I thought GDX could break higher from here and here is why…
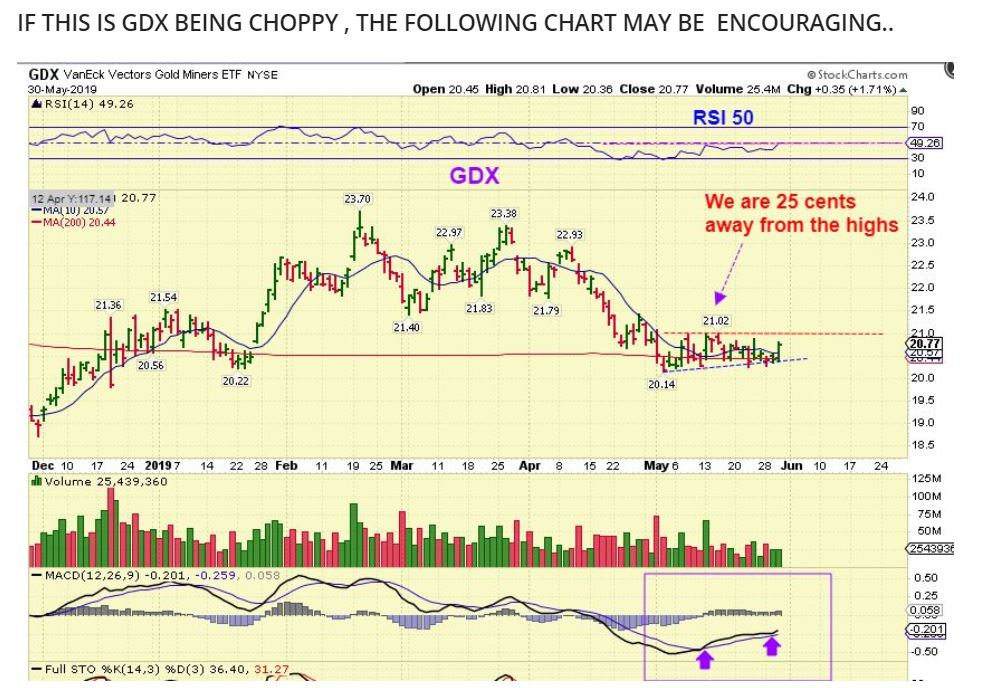
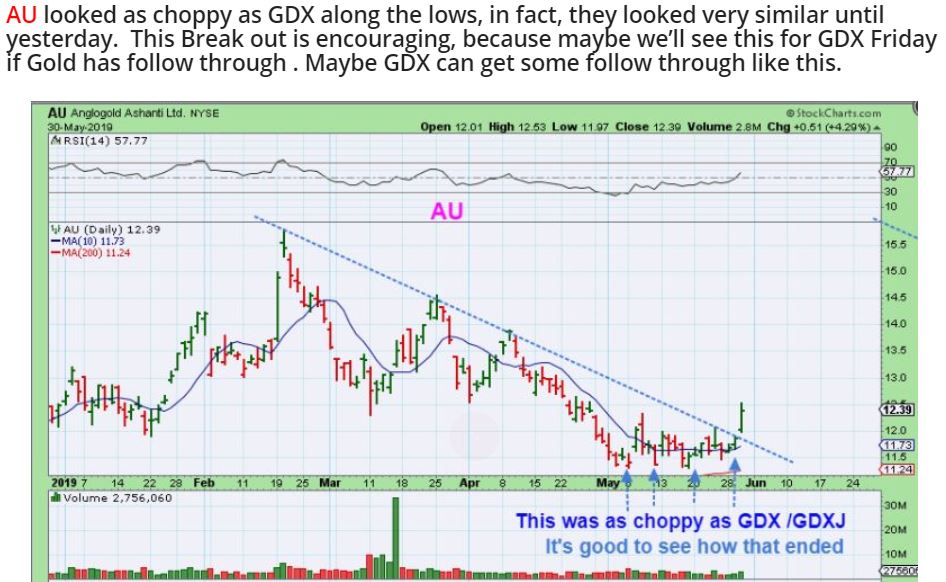
AU looked very similar to GDX and broke out the day before (Thursday), so I thought that GDX could do the same, and not be a bear triangle…
.
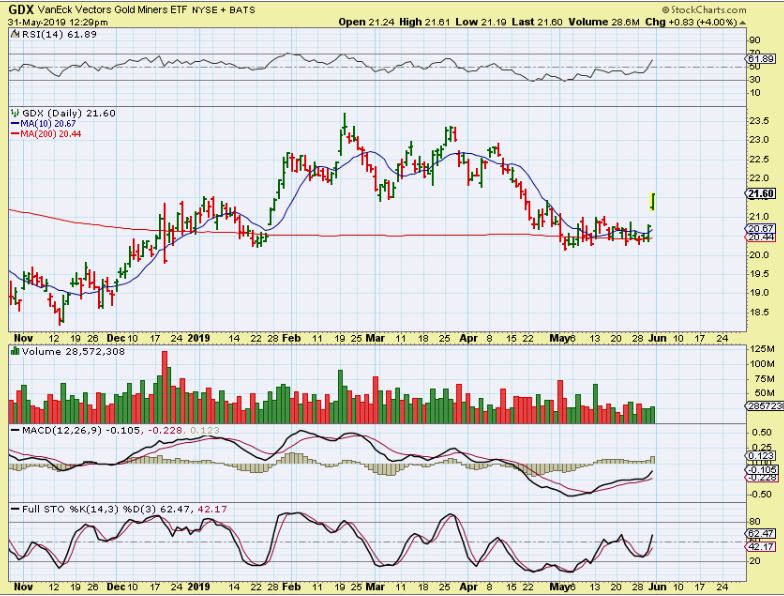
GDX DAILY – Now GDX does look like AU did with that POP out of the triangle.
.
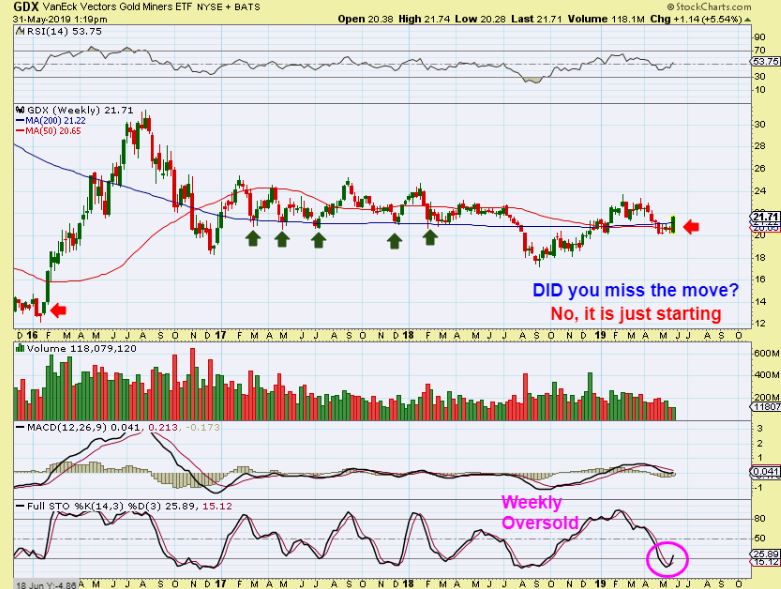
GDX WEEKLY – We now have a Beautiful Weekly break higher here, and what looks to be the next higher ICL in place. This was a fast recovery move. Read the chart.
GDX WEEKLY – This Big Picture is what we have been waiting for, right? This has been choppy on a daily basis, so even with this surge higher, trust me, You haven’t missed the big move that is expected to follow. 🙂
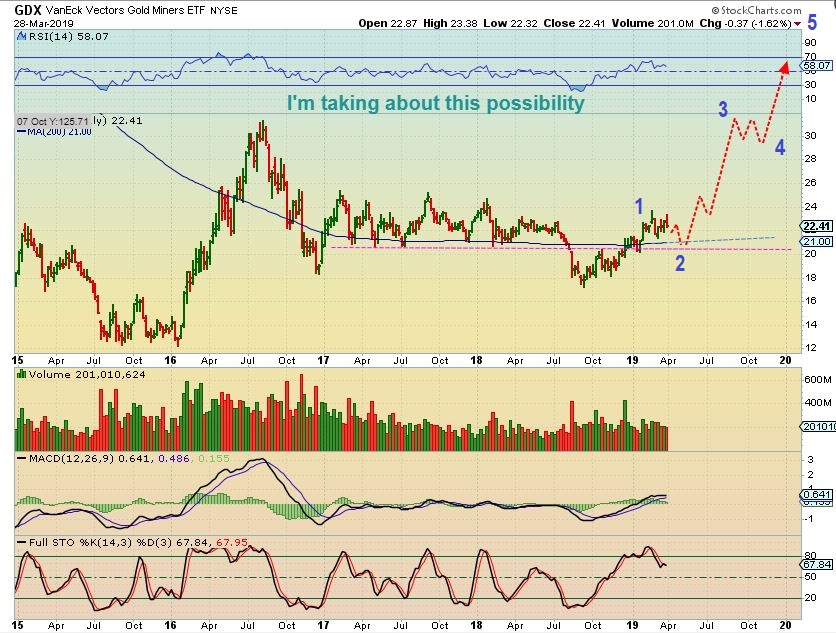
My March 28 chart – I’ve been discussing a move like this for a long time. The move in the ABOVE chart could be just the start of the move in this chart.
.
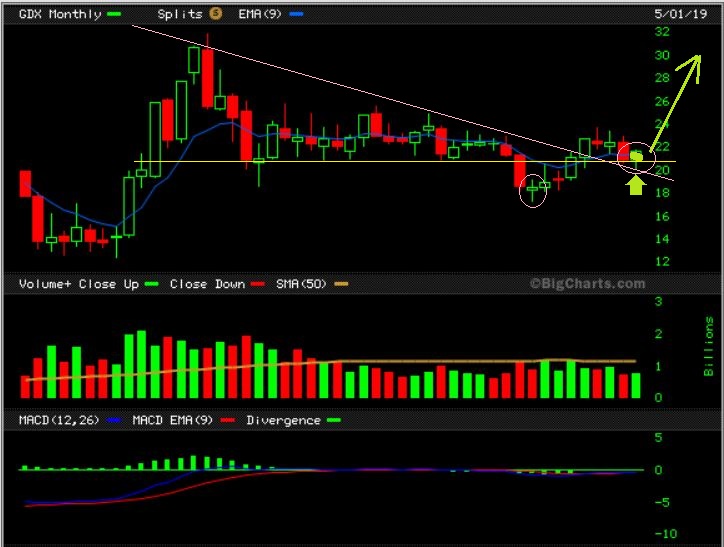
GDX MONTHLY: MAY IS OVER. It ended with a bullish reversal that back tested the pink trend line. This low formed as a much higher low than Septembers.
.
Big Picture Conclusion: The General Markets look to have topped, the USD looks to be topping, and Precious metals looks to be putting in a much higher ICL from the AUGUST/ SEPTEMBER ICL. That is how up trends start and this sector looks like it is the one to be in. GOLD big base could experience a break out from this level soon. I am going to be focusing on Miners going forward and I expect many great set ups to form and upside gains to be excellent. THIS IS WHAT WE HAVE BEEN WAITING FOR, and the signs point to an ICL being in place and a trending move higher starting. I will discuss things regularly as this plays out.
I’ll also discuss a little more about some Miners below, knowing that we should now be able to start enjoying the trading a lot more! Things are now looking very good for the weeks ahead. Enjoy your weekend!
.
BARRICK GOLD – I posted this chart on May 30 and mentioned that these choppy sell offs leading into wedges are good Bullish set ups to enter. Notice the Jan wedge & run, as it Gapped open & ran.
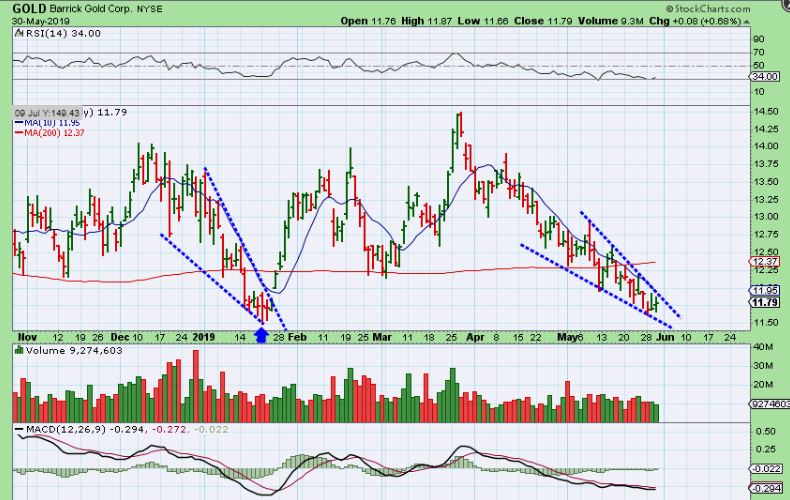
.
BARRICK GOLD – The we saw Barrick gap again, so I posted that those Gaps did not have to fill, so this was a buy.

.
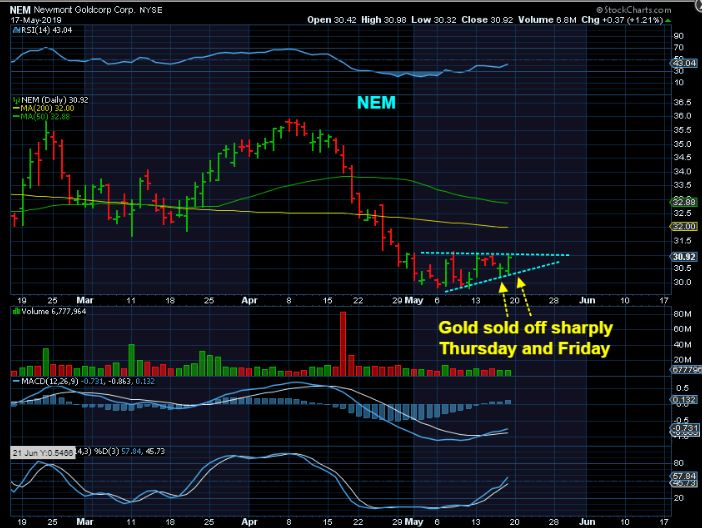
NEM – I posted NEM as a bullish set up when the Gold ICL seemed to be in place on May 17th. Trading had been choppy, but NEM looked set to break out.
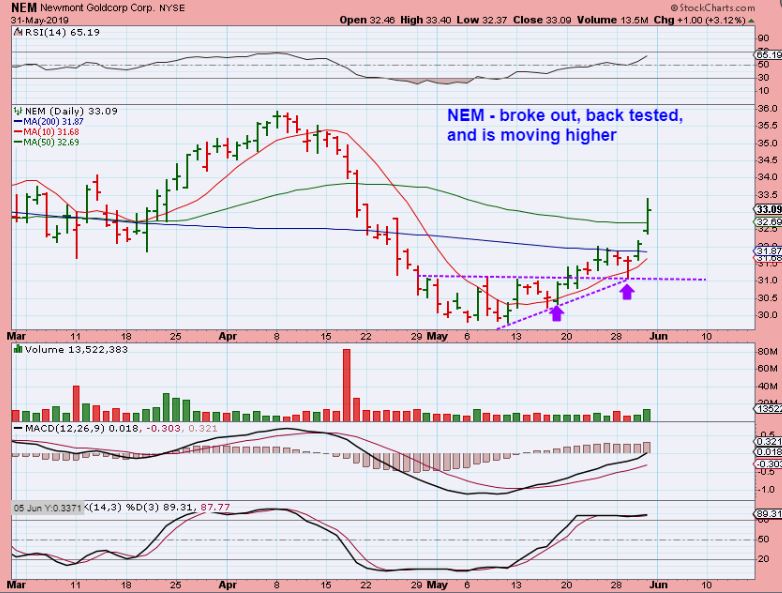
NEM – NEM actually broke out, back tested, and is now moving higher. So things are looking Bullish again…
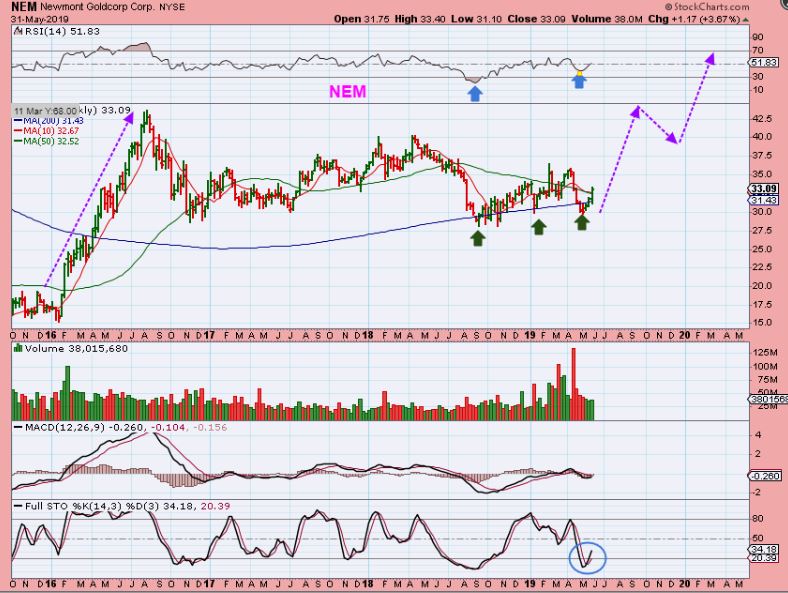
NEM WEEKLY – This looks like a Multi-year consolidation of the 2016 gains, and even though it looks choppy, that could be about to change in a big way when FUNDS start buying again.
.
AEM WKLY BIG PICTURE – Inverse H&S.
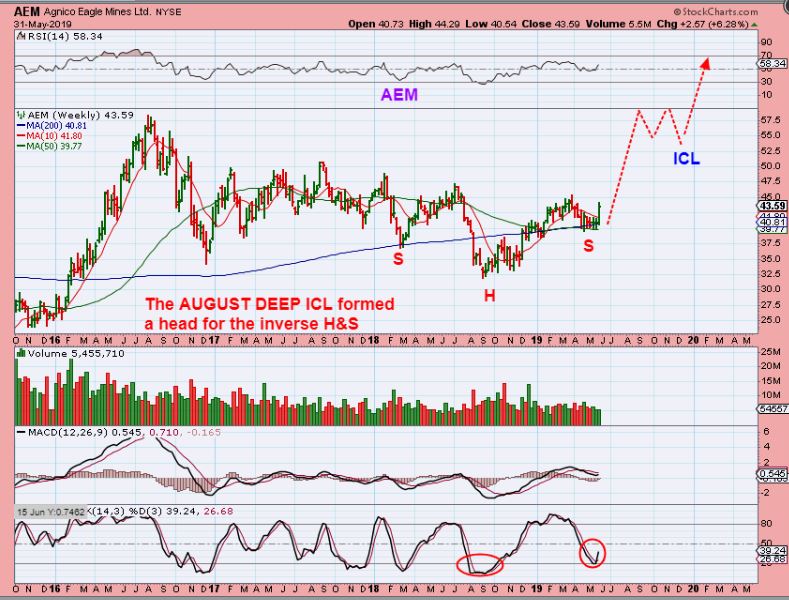
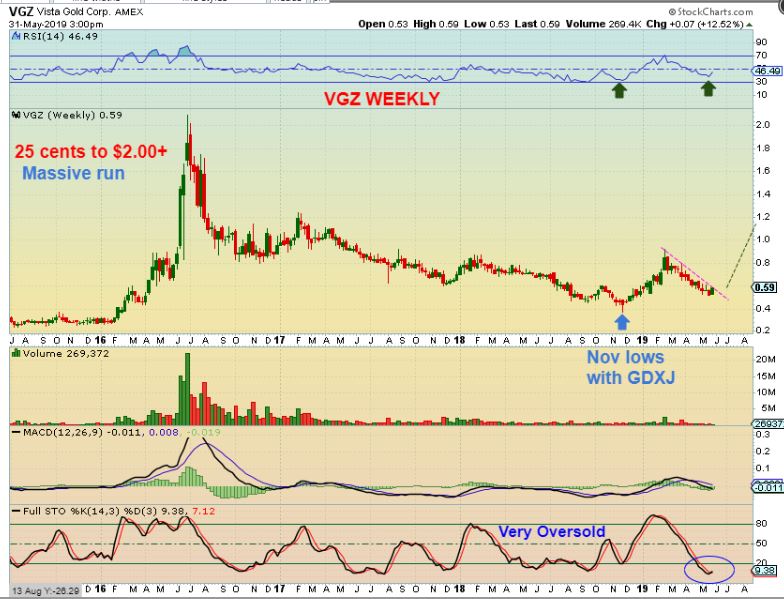
THIS CHOPPY SIDEWAYS PRICE ACTION THAT HAS BORED MANY TO TEARS MAY BE ABOUT TO PAY OFF IN A GOOD WAY. Notice VGZ has a higher low too. Look at the Bigger Picture…
VGZ – In 2016 VGZ ran from 25 cents to $2.00 and if this is a big base, it can run back to those former highs over time. It may take time, but those are Big Percentage Gains.
Obviously I am going to continue to focus on good set ups in this Mining sector, and having been through this many times before, I will continue to mention important reminders like:
-
Do not put all of your eggs in one basket, Own a basket of 4 or 5 for safety
-
Be aware of the time that your Miners release earnings
-
Miners can drop quickly on bad news too, use stops if you are not in front of the screen, etc.
.
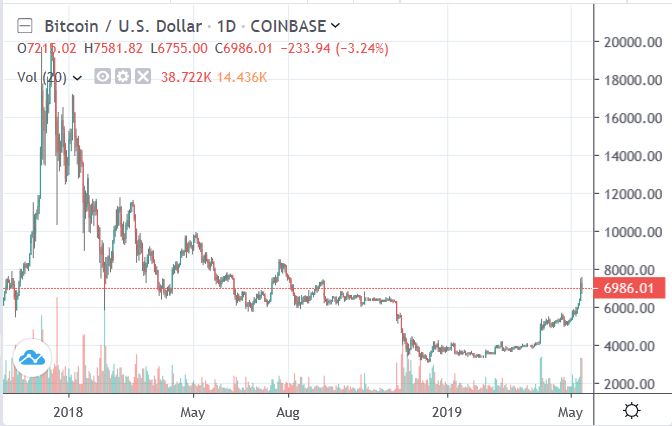
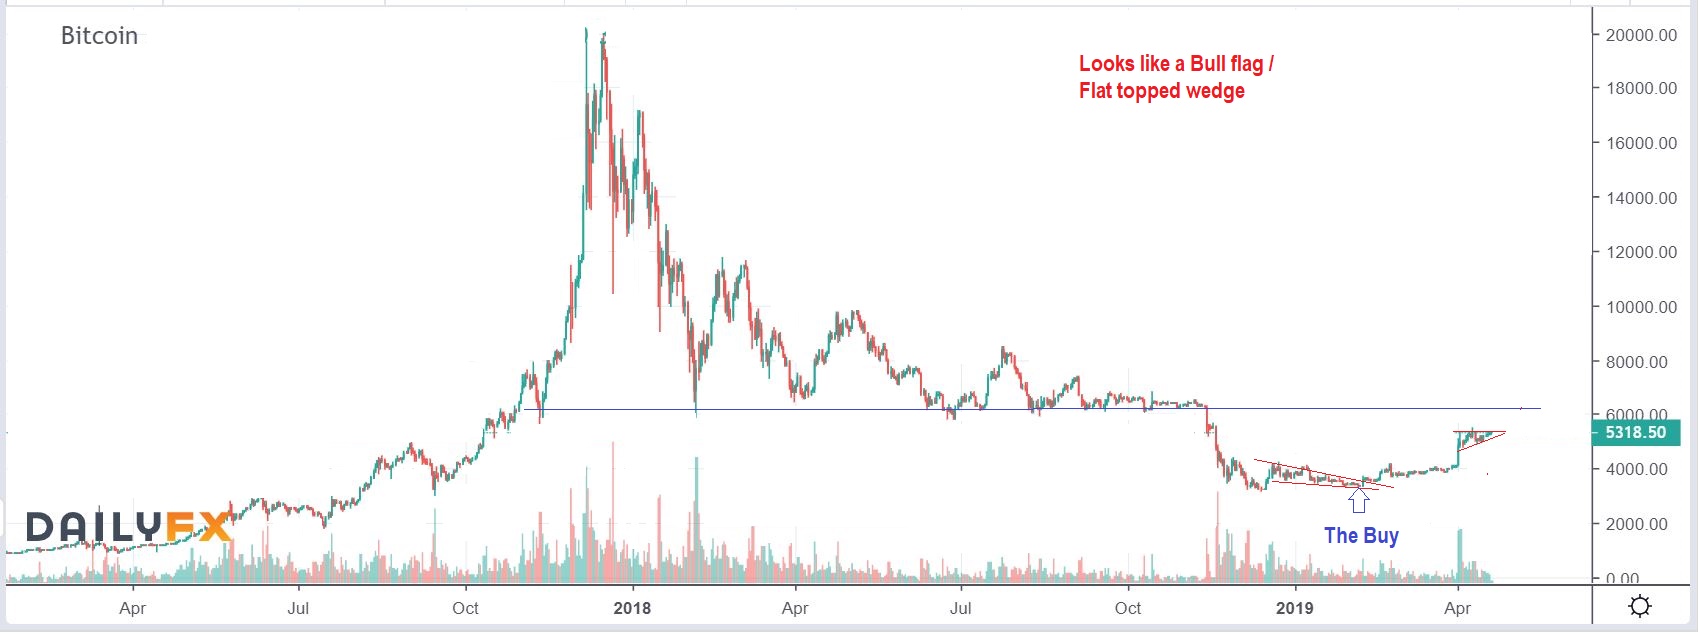
BITCOIN REVIEW : I actually Called a low in Bitcoin when it was in the $3500 area with this chart. I said that a break from here should run right to $6000-$6200 as an initial target.
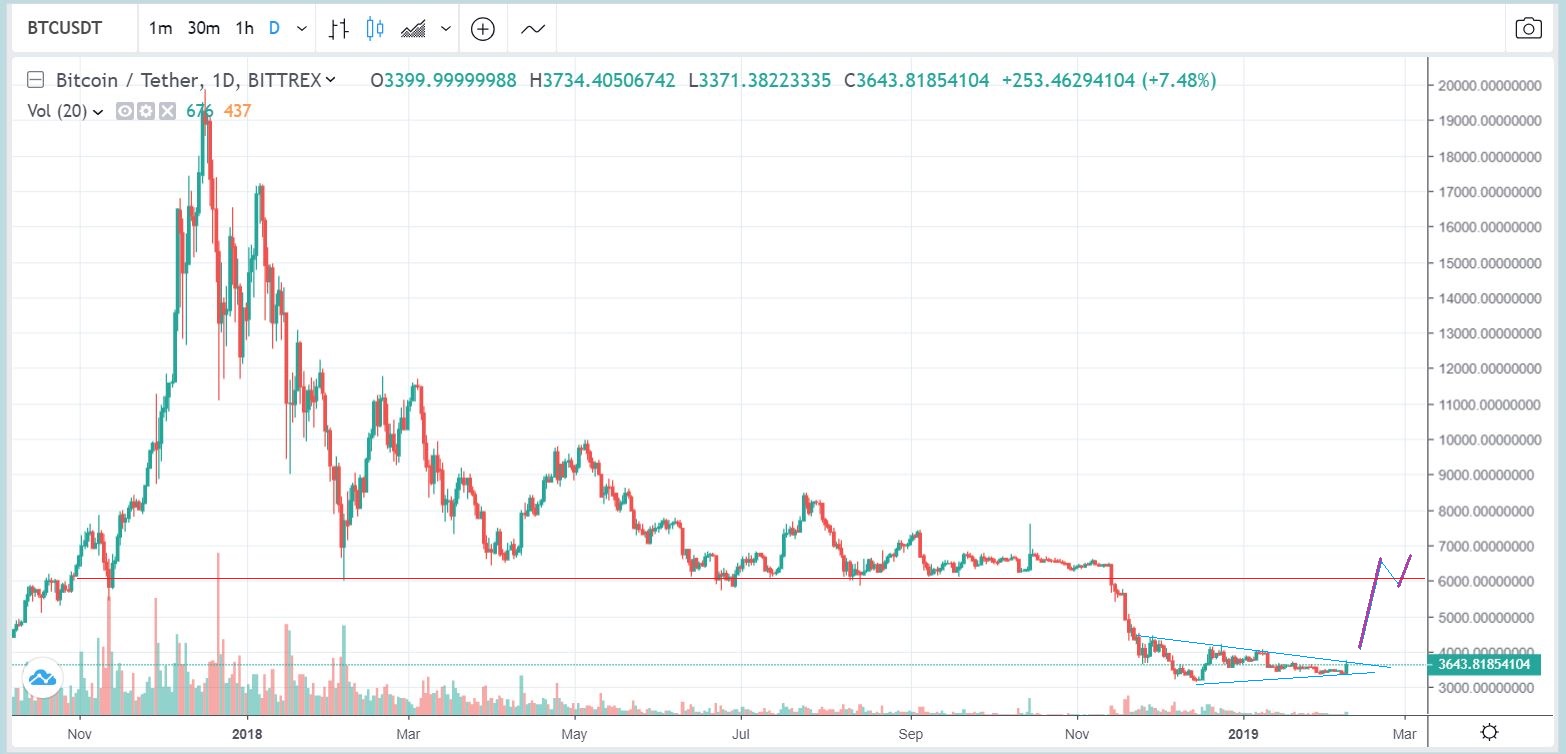
.
BITCOIN – As it continue d to break out & Run, the trade was on ( I also recommended other Blockchain stocks like MARA, RIOT, MGTI, GBTC, etc). Many have doubled since then, but I traded in & out of them.
.
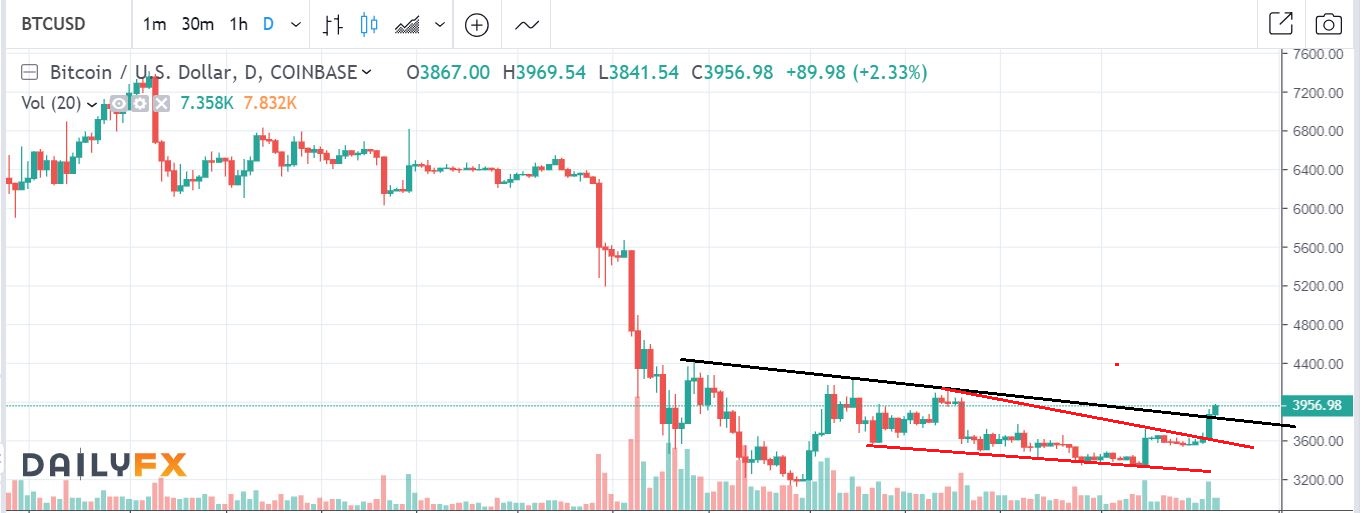
BITCOIN – After an initial surge, I thought we were seeing a bull flag, so I saw no reason to sell, just let it consolidate and continue to $6000+
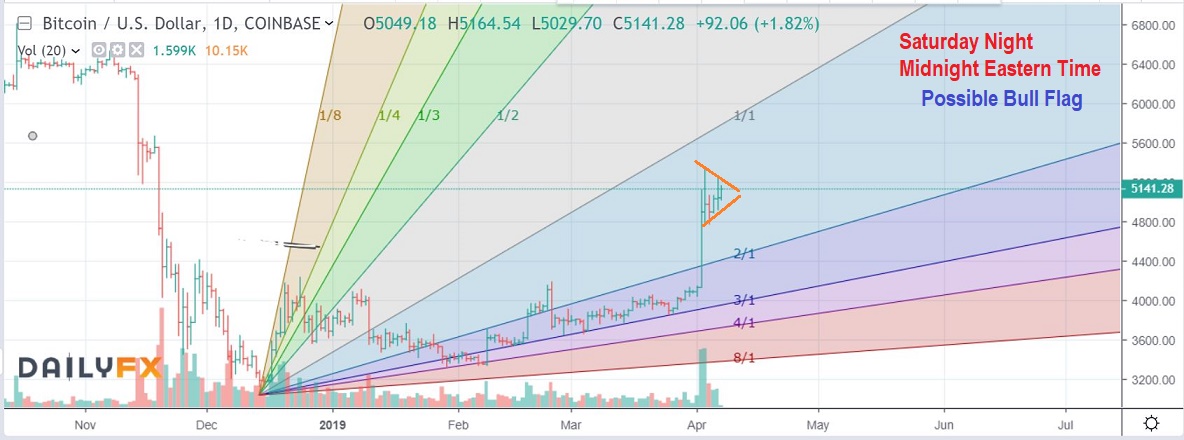
.
BITCOIN – Again, a Bull flag that kept some from selling , or it also could be bought. It looked ready to break out & run to that resistance line that I drew in. I did have a $7500 price target after $6200, but there is a lot of resistance there, I did NOT think that it could get through that area yet. I expected price to stall there…
.
BITCOIN – This weekend Bitcoin hit $7000 plus! Don’t underestimate the Crypto -rockets 🙂