
May 11th – A Big Picture Report For The Public
It has been a while since I posted a Public Report, so I want to post part of this past weekends report to the Public.
For my Readers, I post daily reports to discuss the markets and also offer ‘trade set ups’ if certain sectors are acting bullishly, but I like to use the weekend report to step back and take a look at the Bigger Picture. This report will show you some of what we have been discussing at Chartfreak. This is part of the May 11 Big Picture Weekend report .
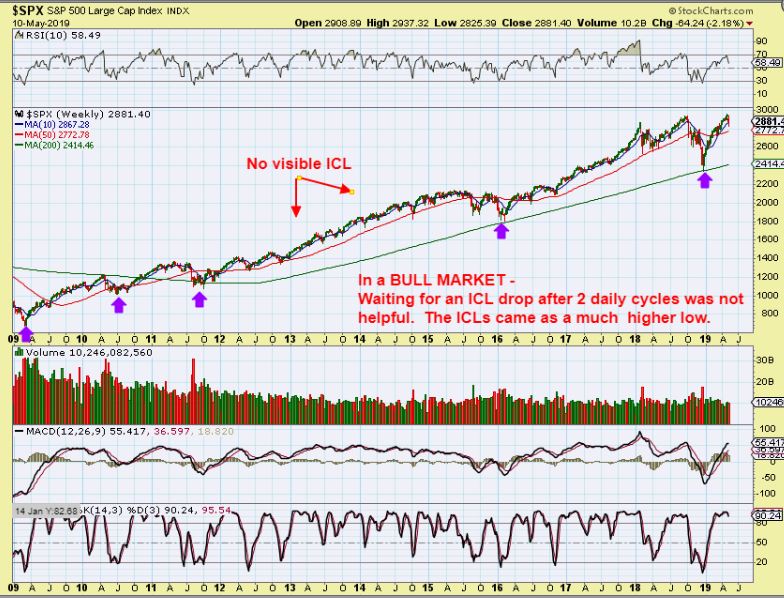
TO START THE BIG PICTURE VIEW : I actually called for a big sell off at the end of 2018 ( Into an ICL using cycles). From that point on, I have been saying that we would buy that low ( ICL = Intermediate Cycle Low) & then we’d have to watch the first 2 or 3 daily cycles unfold and look for clues for the Big Picture. Those first 2 daily cycles are finishing up and we do have a BULLISH possibility and we Do have a BEARISH possibility, so I’ll discuss both ideas currently in play.
1. Are Markets going to do a Bullish parabolic run away move? Or…
2. Are they in a topping process, and will start to roll over sometime after the first 2 daily cycles?
The 3rd daily cycle should give us more clues.
.
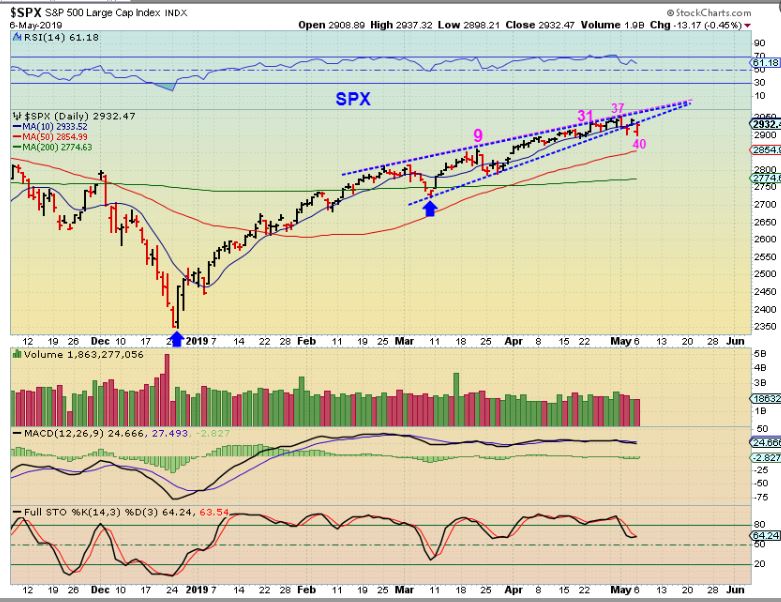
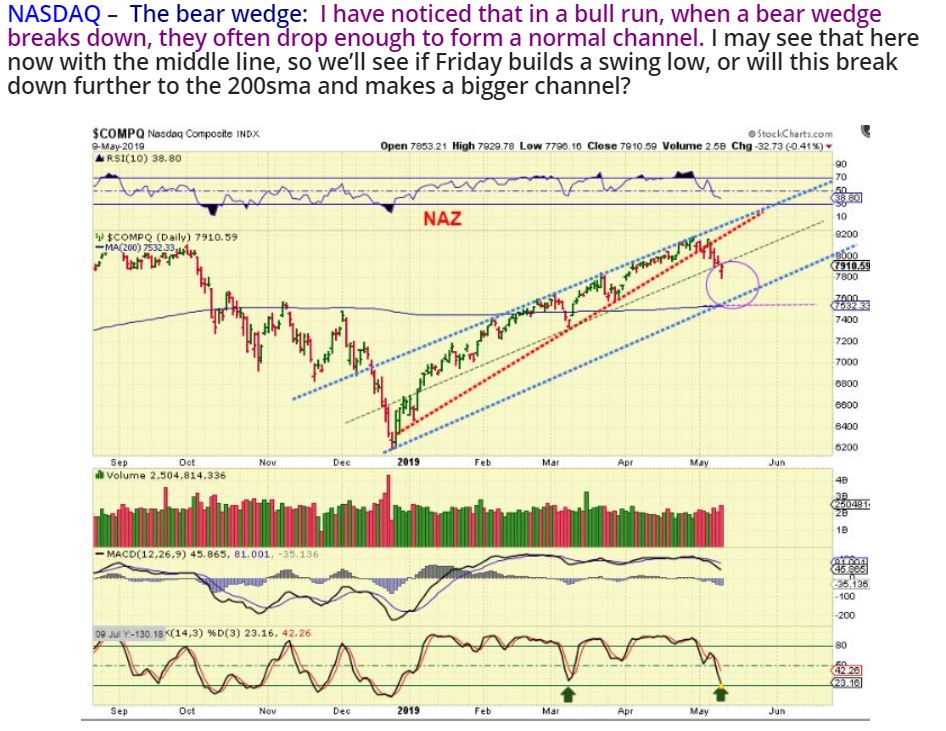
SPX DAILY- So this was May 6. I had been expecting a sell off with this wedge and the cycle count getting late. It could drop to the 50sma, it could drop to the 200sma (deep).
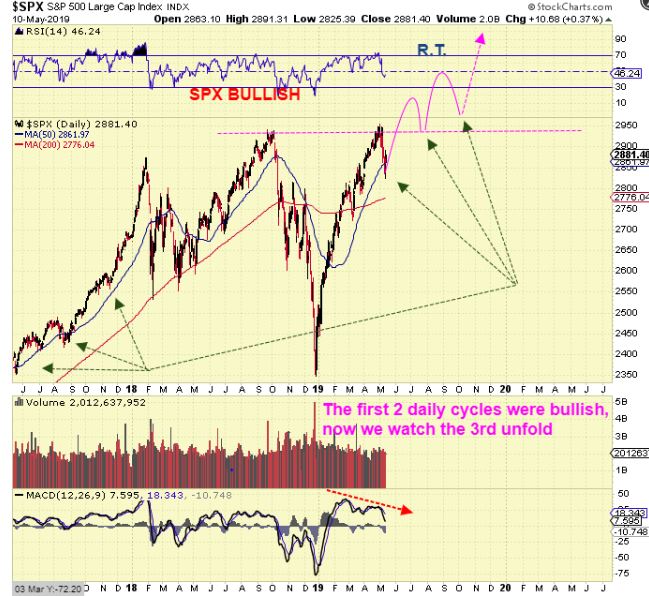
SPX BULL – This would represent a runaway type move. You would buy this 2nd Daily Cycle Low when the swing low forms and ride it with a stop similar to what was recommended for the first 2 daily cycles. If it forms as Right Translated, it will show some strength.
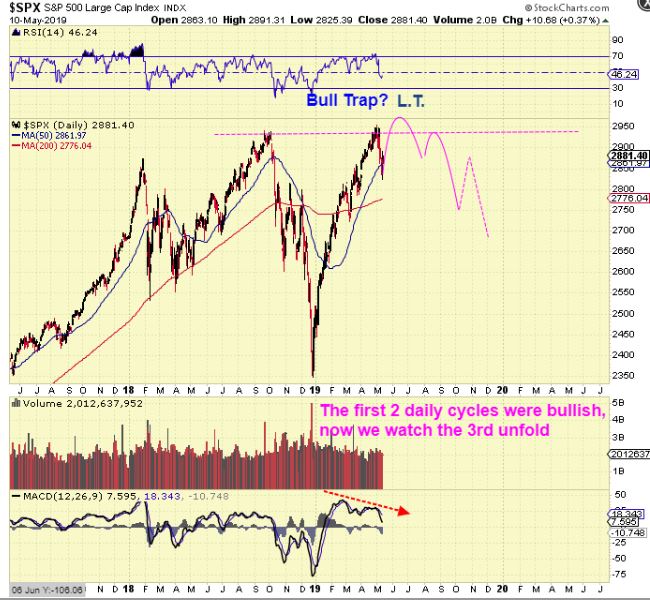
SPX TOP- If it forms as Left Translated, it will be a ‘Bull Trap’. After breaking out to new highs, the BUY & HOLD Crowd will often ‘load the boat’ and that is why they call it a ‘Trap’. It can roll over until that period of selling ends with our next dcl. The 3rd daily cycle drop and especially the 4th can drop quickly too.
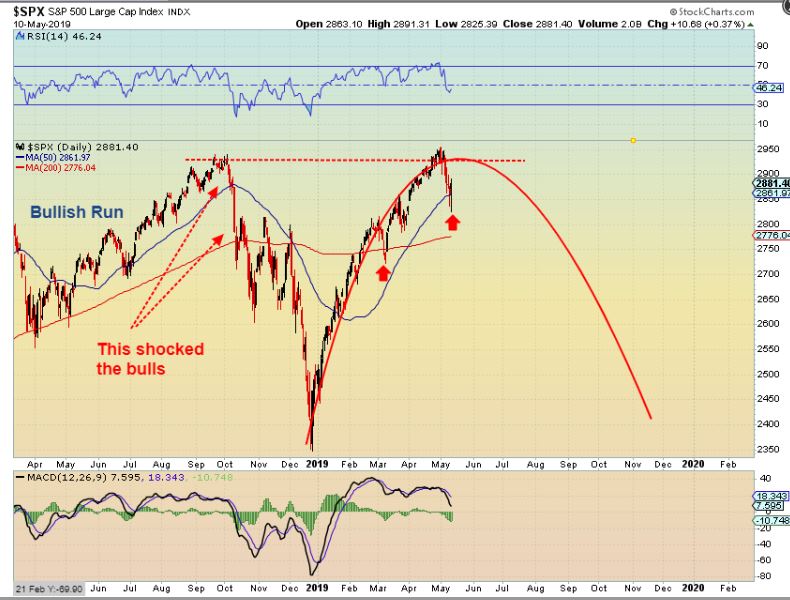
SPX DAILY – Look how sharply the SPX dropped from Oct to Dec. If we break to new highs, you MUST Still have stops in place, especially if you are leveraged, this will now be a 3rd daily cycle.
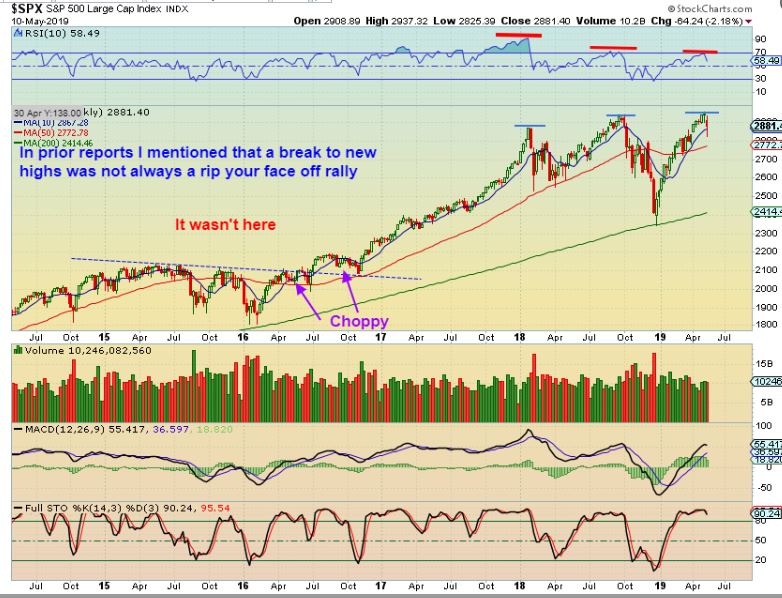
SPX – So with this bigger picture set up recently, I pointed out that the RSI was a bit weaker than prior times at these highs. I warned that a DCL was coming due and that things could also get choppy and sell off. Now look at 2015-2016 when the markets broke to new highs in 2016. That was more of a break out and back test. It didn’t just run straight up, so that is a good visual if we break to new highs again. This COULD become a choppy summer for the markets.
FINALLY, LET’s LOOK AT AN SPX RUNAWAY MOVE – Though we are entering the 3rd daily cycle, we could see a break to new highs and a runaway move to a final parabolic top of this very long Bull Run. So we will go long at the 3rd daily cycle when the time is right and see how it plays out. That is all you can do.
HAS THE CURRENT SELLING STOPPED? Maybe Not. This was in my report that I wrote Thursday. It is best to wait for confirmation of a swing low, since this could drop lower.
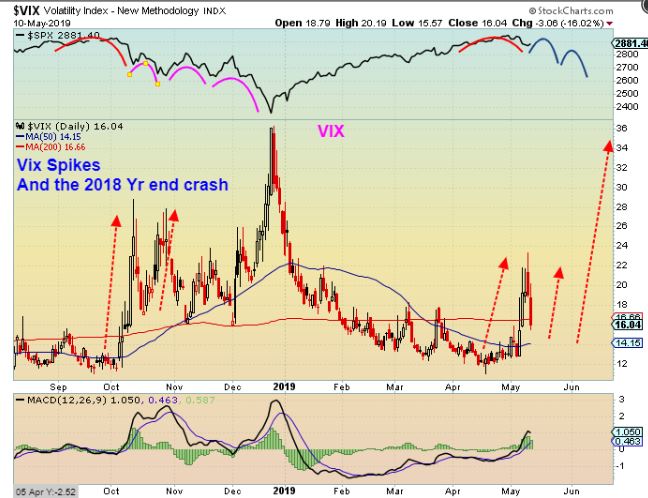
NOTEWORTHY VIX- I pointed out the VIX last Monday. It spiked as the Markets dropped in October and it spiked pretty good this week. The pattern in Octobers first drop is similar to the current dip, so I’ll be watching the Vix on the next move higher too.
.
CONCLUSION TO THE BIG PICTURE: The General Markets are due to move higher in a 3rd daily cycle when this sell off dries up, so the DCL can be bought when it is confirmed. I expect the markets to run to new highs, but that MIGHT be a Bull Trap. My daily reports will monitor it along the way on a day to day basis, and The Big Picture weekend report always focuses on the Bigger Picture.
.
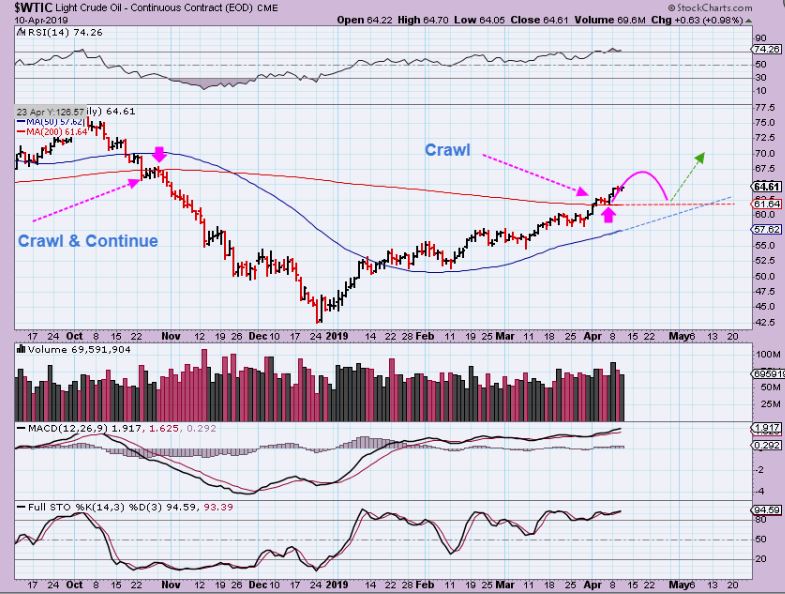
WTIC – After buying the lows in Oil in December, it got a little choppy at the 50sma, but the pull backs have been relatively shallow. On April 10th I expected a move higher, but usually we THEN GET A BACK TEST of the 200sma. That DCL could eventually be bought.
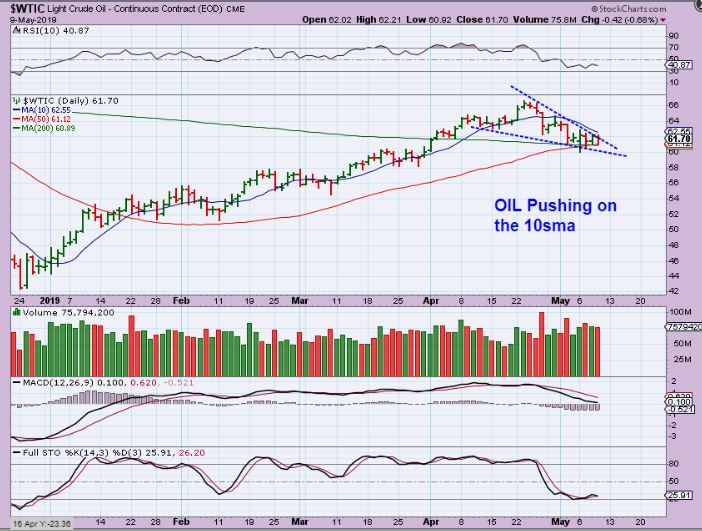
WTIC – Oil moved higher and then dropped to the 200sma, as expected. Oil has actually formed a Bullish Descending Wedge and is on the support area of the 50 & 200sma. It can be bought here with a tight stop, but it is usually safer to but the break out of the wedge and 10sma (Then a stop goes below the apex). We are due timing-wise for a DCL (Daily Cycle Low).
.
I will likely be be pointing out some Oil / Energy Stocks in the daily reports again, as they set up .
.
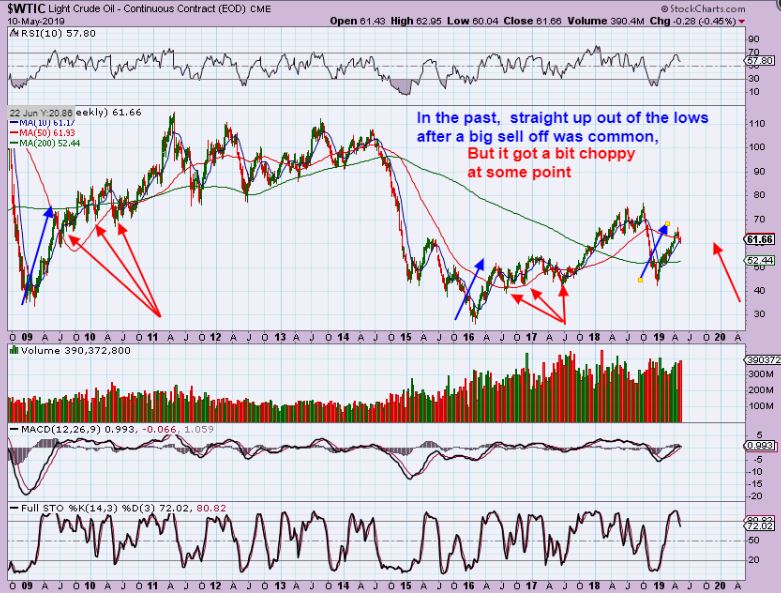
WTIC WEEKLY – I did want to point out something that I noticed with Oil from the past. Oil often V-Bottoms out of a deep sell off ICL for the first 2 daily cycles, but in the past it has then become a bit choppier in the 3rd daily cycle too. Look at past V-Bottoms (blue arrow) and then the chop that followed (red arrows). We may want to watch for that just to be ready for it, but it is still a buy and this may just run higher from here, because…
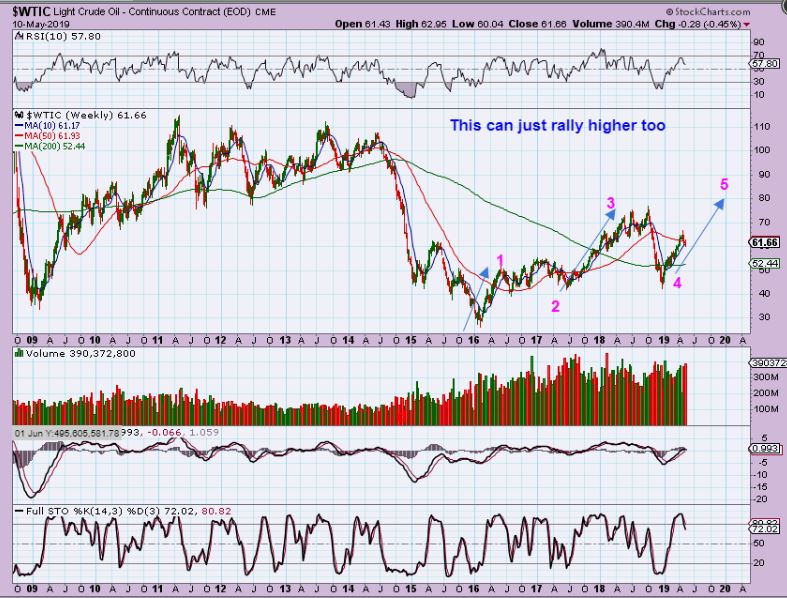
WTIC WEEKLY – Oil could continue in this manner, or even an eventual run back to $100 if inflation begins to kick in.
.
The Precious Metals Sector has been explained by me in every way possible in prior reports, so this is a review. 🙂
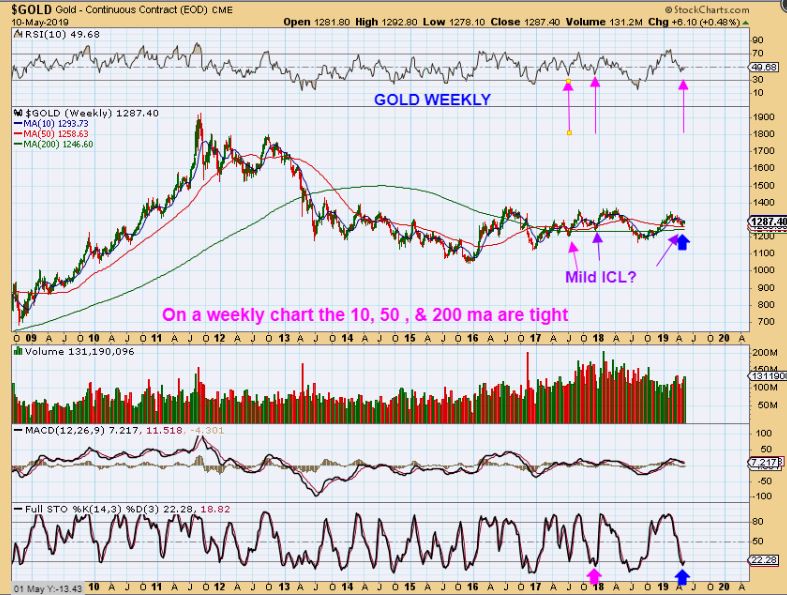
We have really been focused on this area. It remains Big Picture Bullish, but short term choppy. The Timing is complete for a meaningful low, but we haven’t exactly had the little CRASH into an ICL that we have come to expect. This is what I have noticed: In past Bear markets, we always got the crash into the ICL. In past Bull Markets, I have found cases of Milder ICLs so I pointed those out in past reports recently. That means that at this point, all we can do is be ready, stay frosty (& unemotional helps too), and take a look at where things are now. The way I see things, we must be VERY CLOSE to a meaningful low here, and a strong rally should follow.
.
GOLD WEEKLY BIG PICTURE – The Milder ICLs pointed out on this chart look similar to what we see now. We have a weekly swing low, so this may be the low. Also Gold sits above the 50 & 200 weekly ma. A short quick slam to those are possible, so let’s examine that.
.
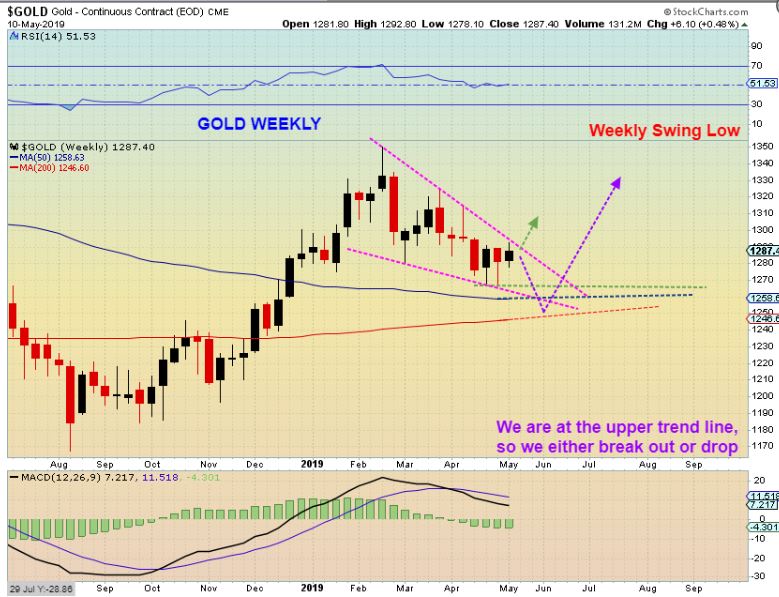
GOLD WEEKLY – Gold sits above the 50 & 200 weekly ma. A short quick slam to those are possible, because this wedge may not be complete. We have space between here and the apex, so we just need to be aware of that. Let me zoom in on something I found interesting…
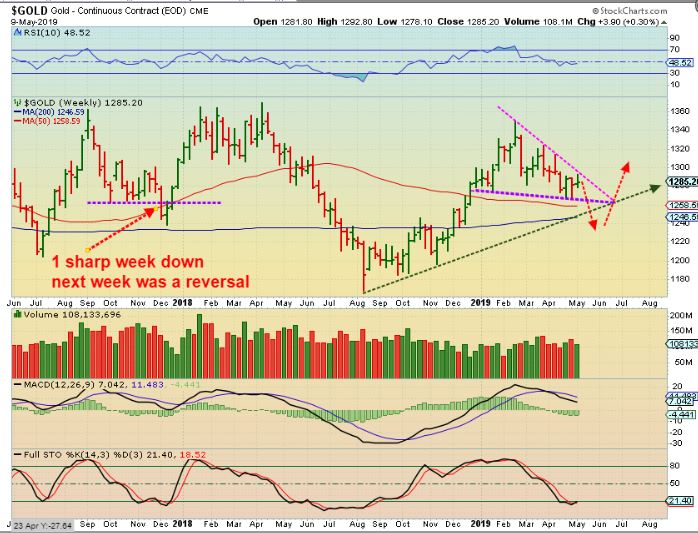
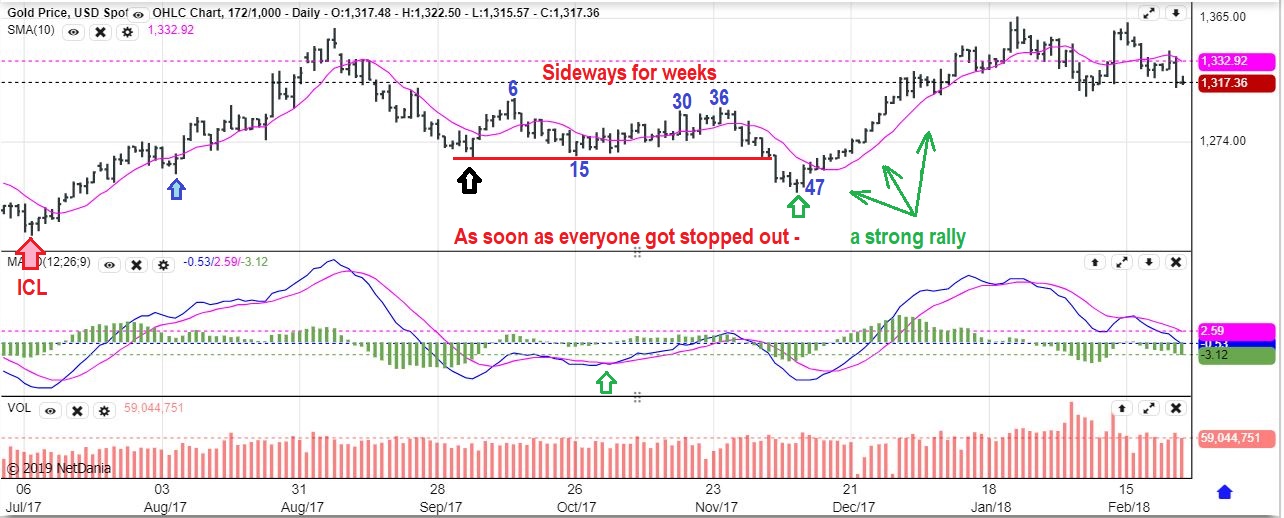
GOLD 2017 ICL slam – Look at the left side of this chart. We saw sideways chop in 2017 week after week, and then just a sudden 2 week slam, then it reversed higher. It ran higher for 7 weeks after that, so I would say that we can we get that same kind of a 2 week slam, wouldn’t you? I would be mindful of that!
Now let’s zoom in…
.
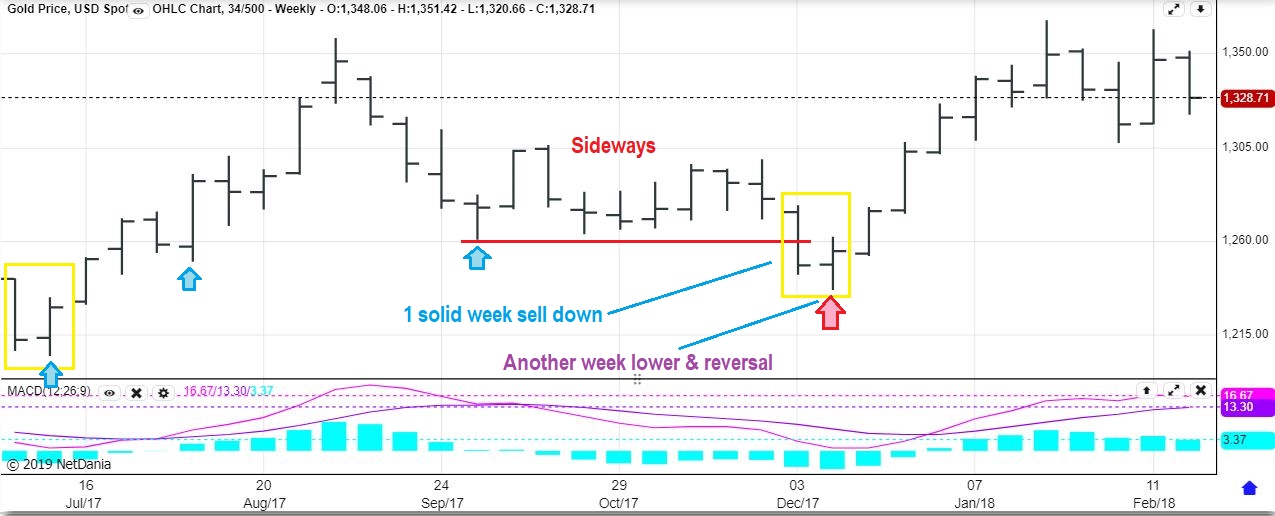
GOLD DROP 2017 – This is a close up of that ICL. It looked fine going sideways , but then suddenly it had that One big week down, the next week dropped and reversed as the low. That is a shake out. It helps to zoom in on a drop like this, to prepare us mentally for what could possibly happen, so examine this chart please.
GOLD DROP DAILY– And we then step back and do a cycle count. How frustrated would you be if you rode this for 36 days sideways and THEN it falls apart? THAT is what shakes off bulls, but at Chartfreak, we would have noticed the day 47 count & bought that reversal as it moved above the 10sma.
If this shake out ‘action’ bothers you, you have 2 choices that I recommend we all be mindful of…
1. Patiently wait with Cash until a confirmed move higher is in place…
2. If you bought that swing low recently, Keep your starter positions SMALL, until it gets running. A shake out could still take place.
.
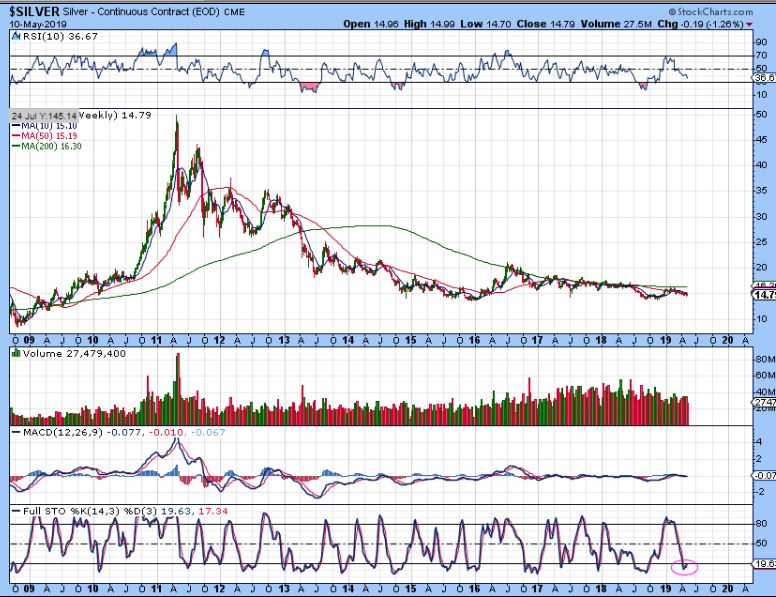
SILVER WEEKLY BIGGER PICTURE – This very large base should have Huge upside potential. I have discussed Silver in detail in many of my past reports and not much has changed this week.
.
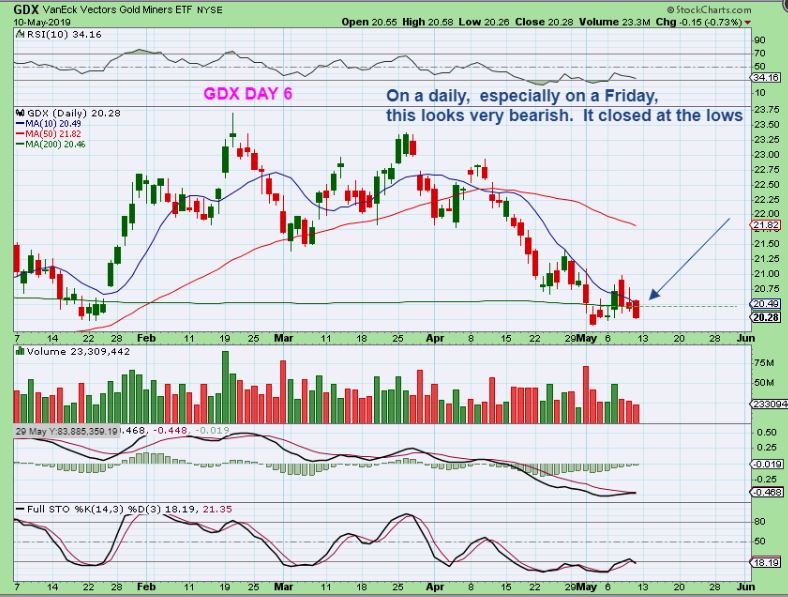
GDX DAILY – The daily chart of GDX obviously looks weak as it took a dive Friday into the close, but there is something surprising about the weekly chart.
.
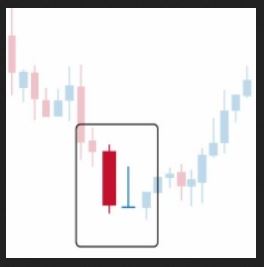
GRAVESTONE DOJI – The 2 candles on the right are 2 that I have pointed out many times. Though it is a ‘bearish looking candle’ to many, it often is NOT bearish. After a sell down, it closes at the lows, but it is quite often actually bullish.
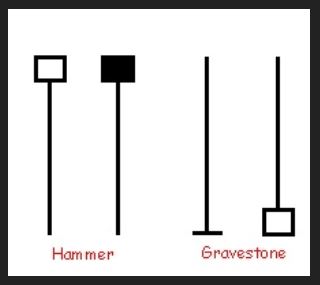
As seen on this chart, price can drop below the gravestone doji, but it is usually a reversal soon after, since selling has dried up. Well…
.
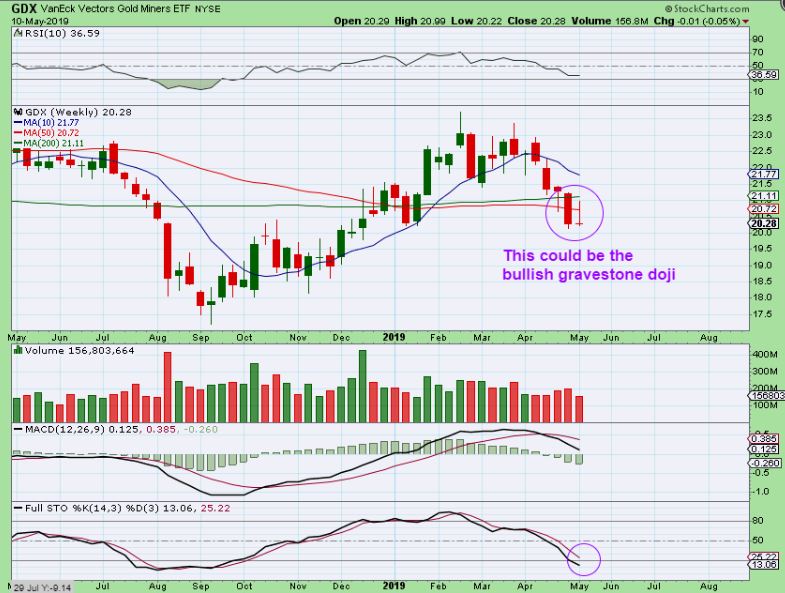
GDX WEEKLY – Fridays sell off caused a Gravestone Doji on the weekly charts. So this makes things a bit more interesting heading into next week, right? Well, I found something else that was also interesting …
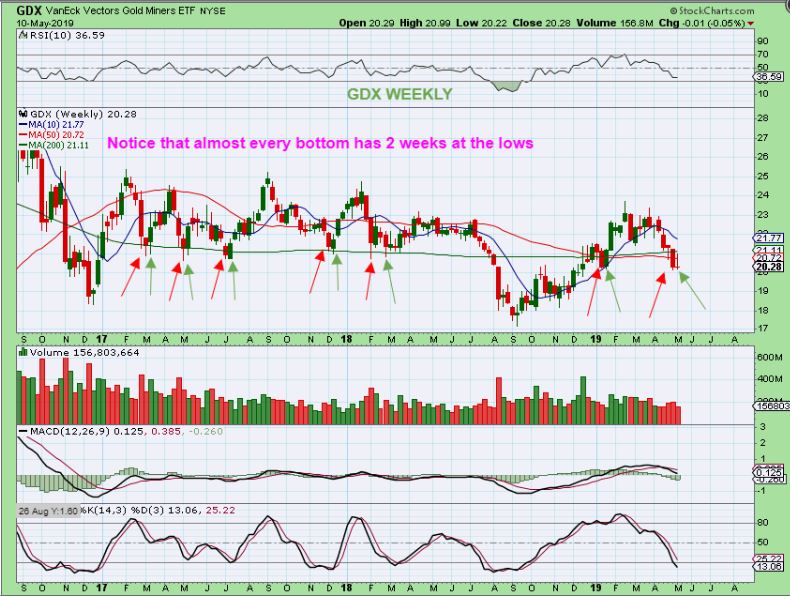
GDX WEEKLY – In the past, notice that price bottomed on the Red arrow, and spent another week at those lows with the green arrow. We have that again with this gravestone doji, so next week could tell us a lot. I don’t see many with 3 weeks at the lows, but I do see many with 2 weeks at the lows.
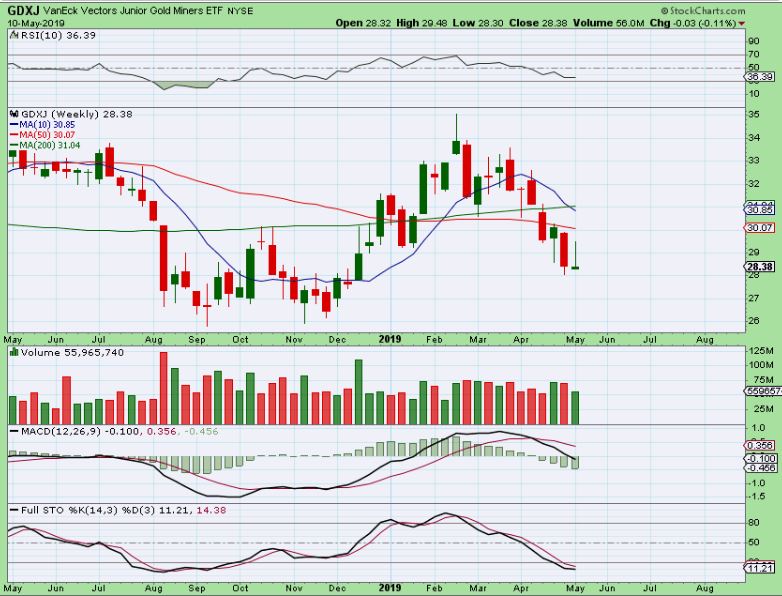
GDXJ WEEKLY – Another gravestone doji for the GDXJ, HUI, and XAU WEEKLY too.
,
So it looks like we should get some upside in the General Markets soon, with reversals forming and we are due for a dcl. It may be best to be patient and wait for a confirmed swing low. For Oil, we are due for a Daily Swing Low too, and it has held up better after the Inventory report came out Wednesday. Oil may or may not start to get choppy, as shown in that section, but even when Oil itself is choppy, some energy stocks ignore it and just run higher. The Precious Metals Sector is often choppy and difficult to trade near the lows. It looks to be threatening to break down further one more time, but with gravestone Dojis forming on the weekly charts, it is worth watching closely in case it makes an upside break, confirming a Daily Cycle Low is in place.
.
It was definitely a very volatile week of trading, let’s see what next week brings our way now that all of the ‘News’ on the Chinese Tariffs has been fairly well digested.
,
~ALEX
.
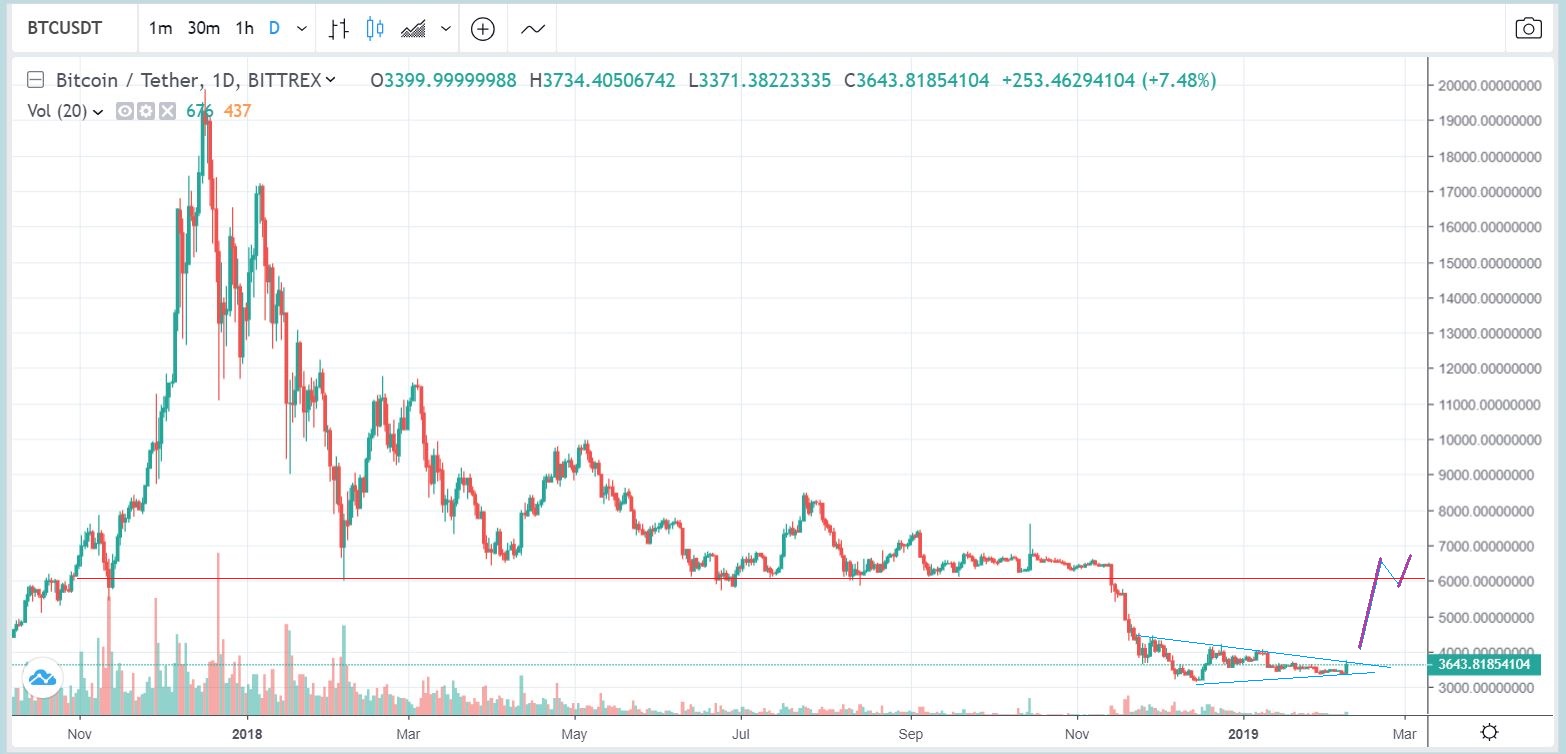
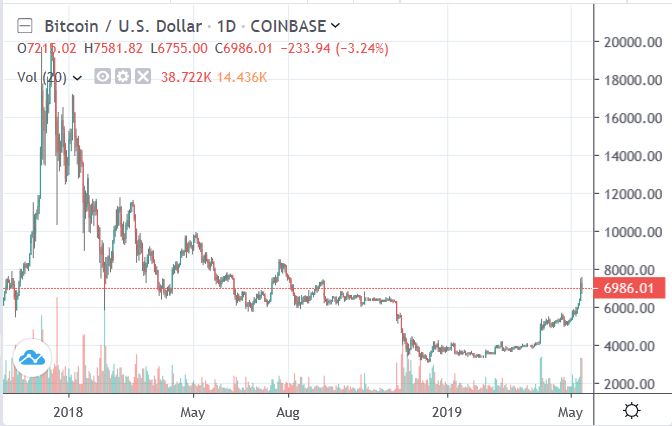
BITCOIN REVIEW : I actually Called a low in Bitcoin when it was in the $3500 area with this chart. I said that a break from here should run right to $6000-$6200 as an initial target.
.
BITCOIN – As it continue d to break out & Run, the trade was on ( I also recommended other Blockchain stocks like MARA, RIOT, MGTI, GBTC, etc). Many have doubled since then, but I traded in & out of them.
.
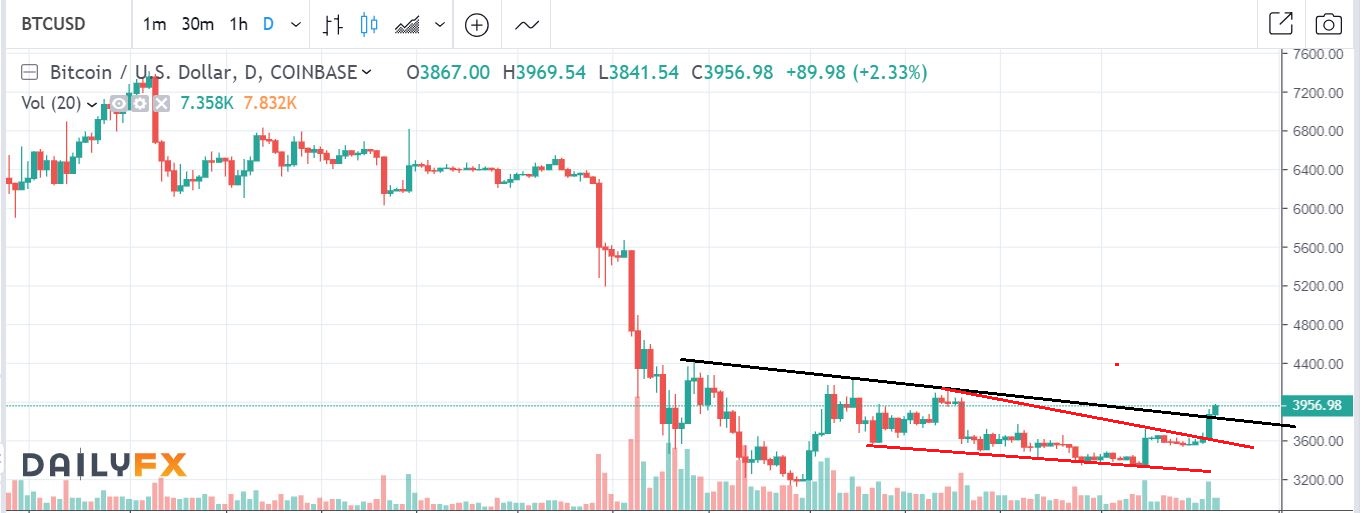
BITCOIN – After an initial surge, I thought we were seeing a bull flag, so I saw no reason to sell, just let it consolidate and continue to $6000+
.
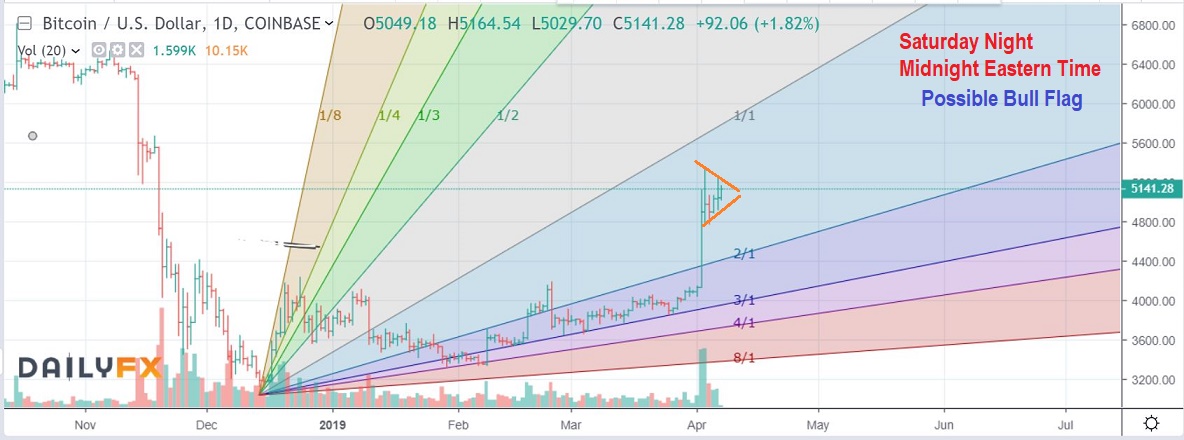
BITCOIN – Again, a Bull flag that kept some from selling , or it also could be bought. It looked ready to break out & run to that resistance line that I drew in. I did have a $7500 price target after $6200, but there is a lot of resistance there, I did NOT think that it could get through that area yet. I expected price to stall there…
.
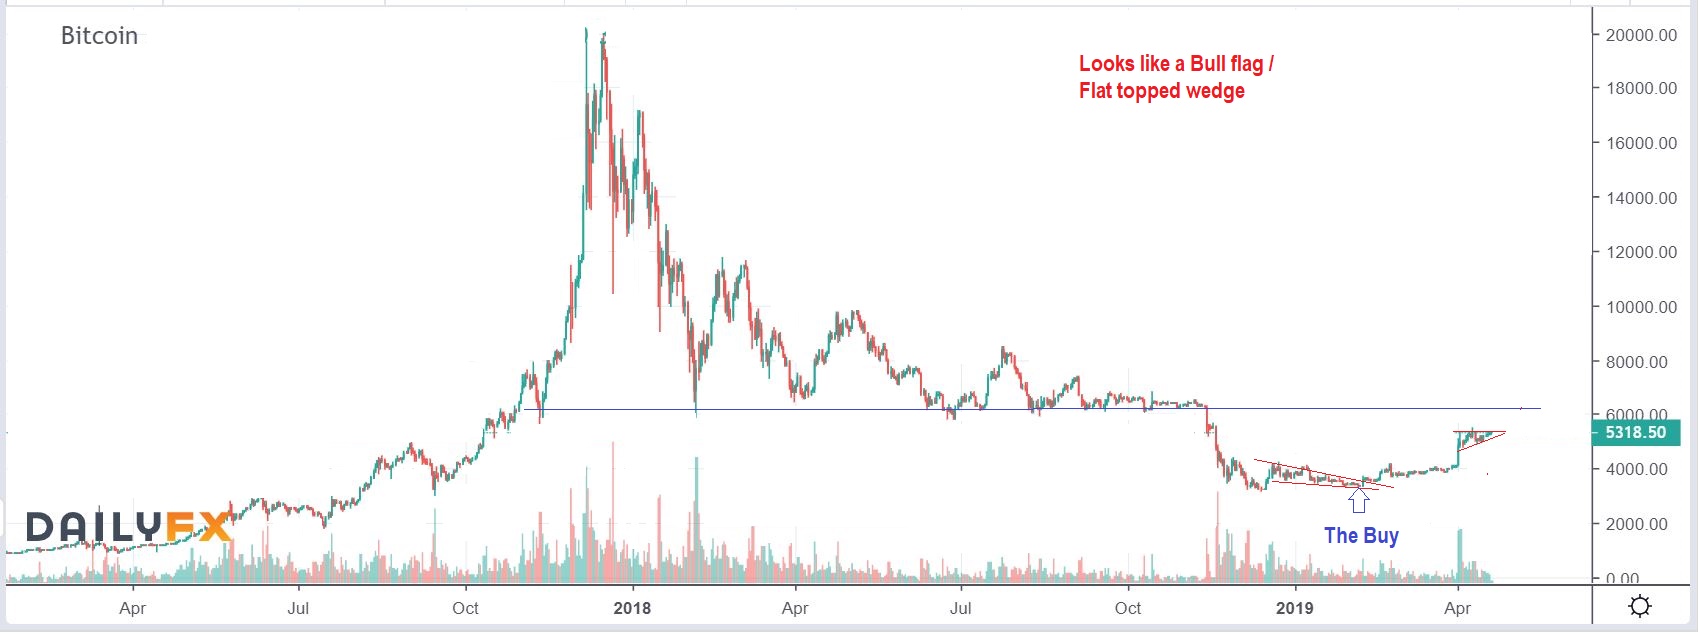
BITCOIN – This weekend Bitcoin hit $7000 plus! Don’t underestimate the Crypto -rockets 🙂
.
Finally: I stated in my Monday May 6 report that I expected last week to be volatile & Choppy. We had the China Tariff Tweet Sunday rocking the futures, and markets do not like indecision, but we also knew that ‘timing-wise’ a DCL was due. The Vix was pointed out as setting up for a pop, so I mentioned that we should expect choppiness and Volatility last week. I actually got stopped out of 2 of my trades for smaller gains than I originally had ( RIOT for example). So for last week, Less trades, smaller positions, tight stops was a good move, but now let me show you something else…
.
When coming out of a sell off, I often look for a stock that ignored the selling, because it is showing relative strength and may out perform. SPWR is an example of that. We already bought and rode VSLR higher, ENPH, RUN SEDG, and SUNW were bullishly running, and now SPWR ignored the selling, So some Solar stocks stayed string. Notice that it didn’t really sell off the whole time the markets did, rather it consolidated sideways & then Burst higher Friday. That said…
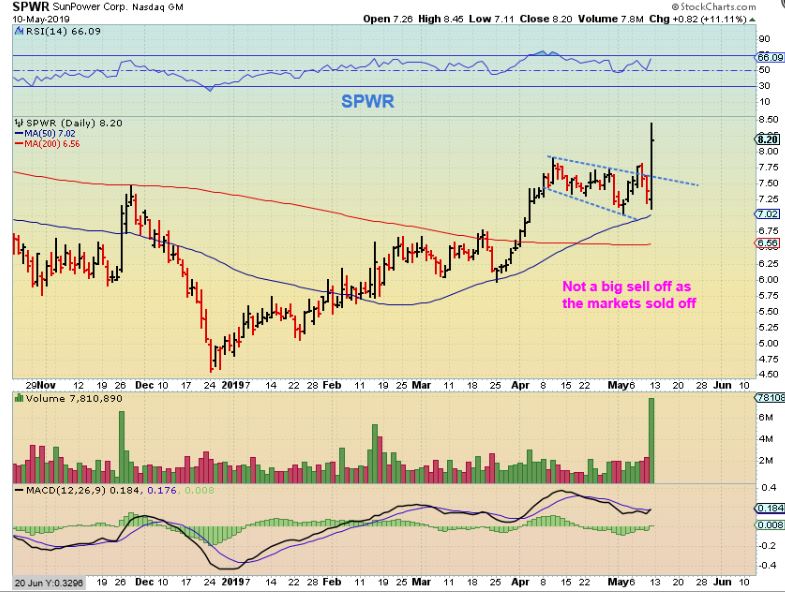
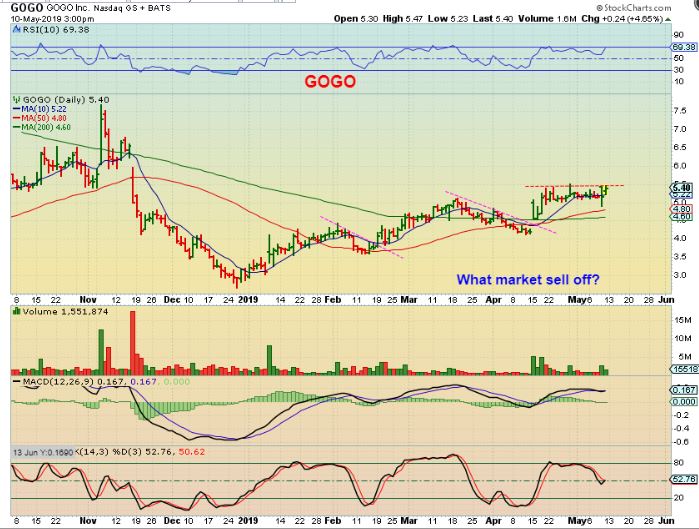
I do look for Stocks that held up better after a correction ends…
GOGO , for example, seems to be doing that now.
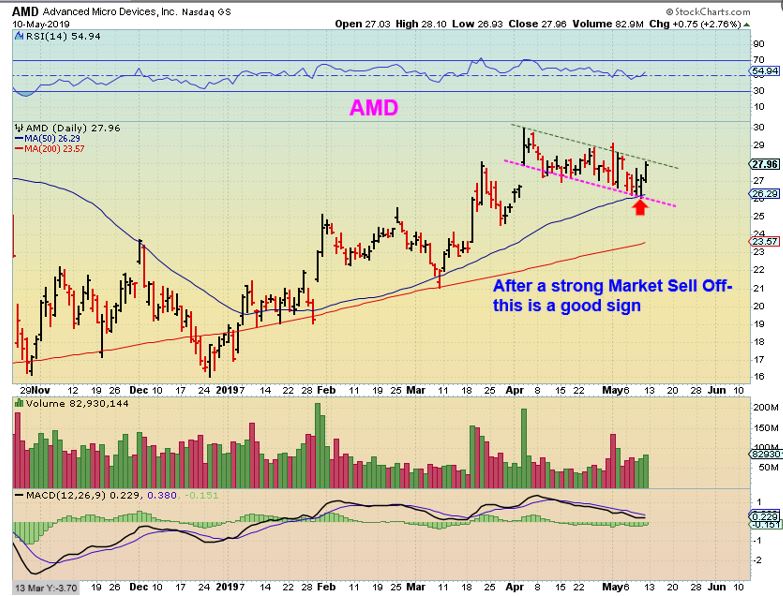
and AMD also seems to be doing that now. I will be looking for similar set ups moving forward in the weekday reports, as we also focus on what the Precious Metals sector wants to do.
.
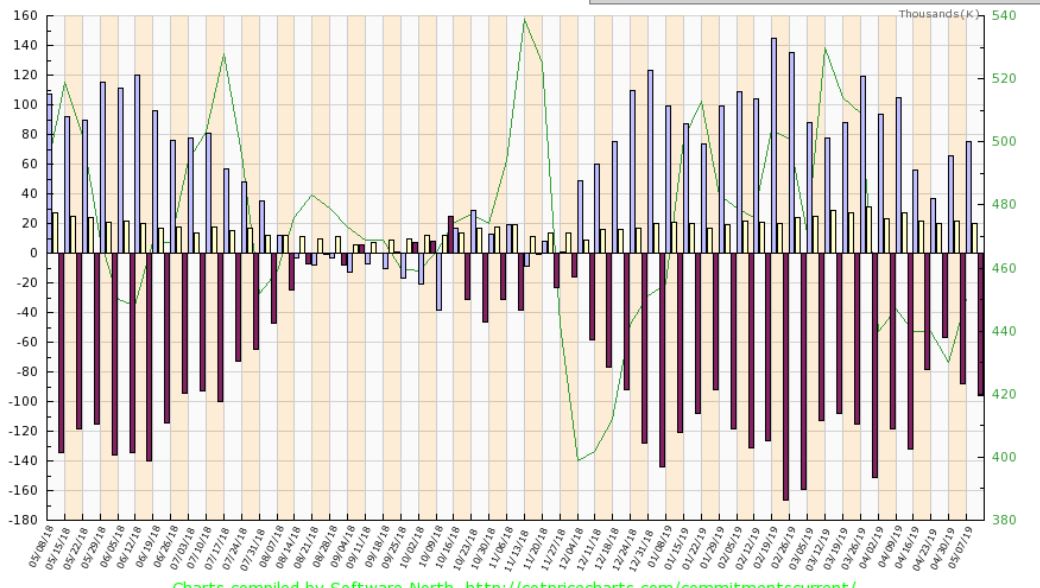
FINALLY, ONE DRAW BACK FOR GOLD- I don’t really like the way the COT is quickly turning bearish again, so let’s stay Frosty my friends!
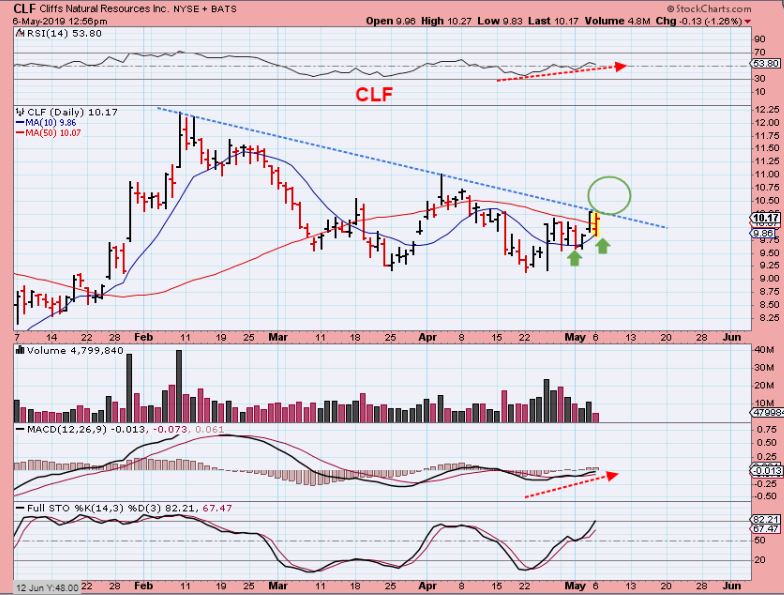
If you think that your trading style would benefit from this type of analysis, or if you just don’t have time to do all the research yourself, why not sign up for a monthly, quarterly , or discounted yearly subscription? I have had well over 100 subscribers that signed up with me over 4 years ago that are still with me, and hundreds more have joined since then. We have a live trading area below each report where some of the active traders share ideas, and I am there to post charts of trade ideas or answer questions during market hours. For example, I posted this one of CLF Midday recently to show a potential buy setting up. A break out could be bought.
Even if you don’t use the live trading area, you may just be too busy with a full time job or other activities to research these fast changing markets daily. I will be doing that for you. Each week I have daily reports released around 7-8 a.m. Eastern Time, and a weekend Big Picture report. Try it for a month, and see if you benefit from adding these observations to your market analysis. Thanks for reading along here at Chartfreak.com! ~ALEX
If you would like to find out more about the service or sign up, please click the buy now bubble for more details.


Trackbacks & Pingbacks
… [Trackback]
[…] Find More Informations here: chartfreak.com/2019/05/may-11th-weekend-report-2/ […]
Comments are closed.