GOLD & ENERGY OPPORTUNITIES

Our recent weeks of trading have had a lot of choppy sideways action, and this gets frustrating to both the longs and the shorts.  My premium reports discussed how that choppiness was ending in Oil, and we began looking at buy set ups forming in the energy markets. I wanted to share my thoughts on ENERGY & PRECIOUS METALS from the weekend report here with the public.  I Am expecting a sell off in Gold, Silver, and Miners, but it could be the next best buy of 2016. Lets take a look.

.

Below is a partial of the weekend report.

.

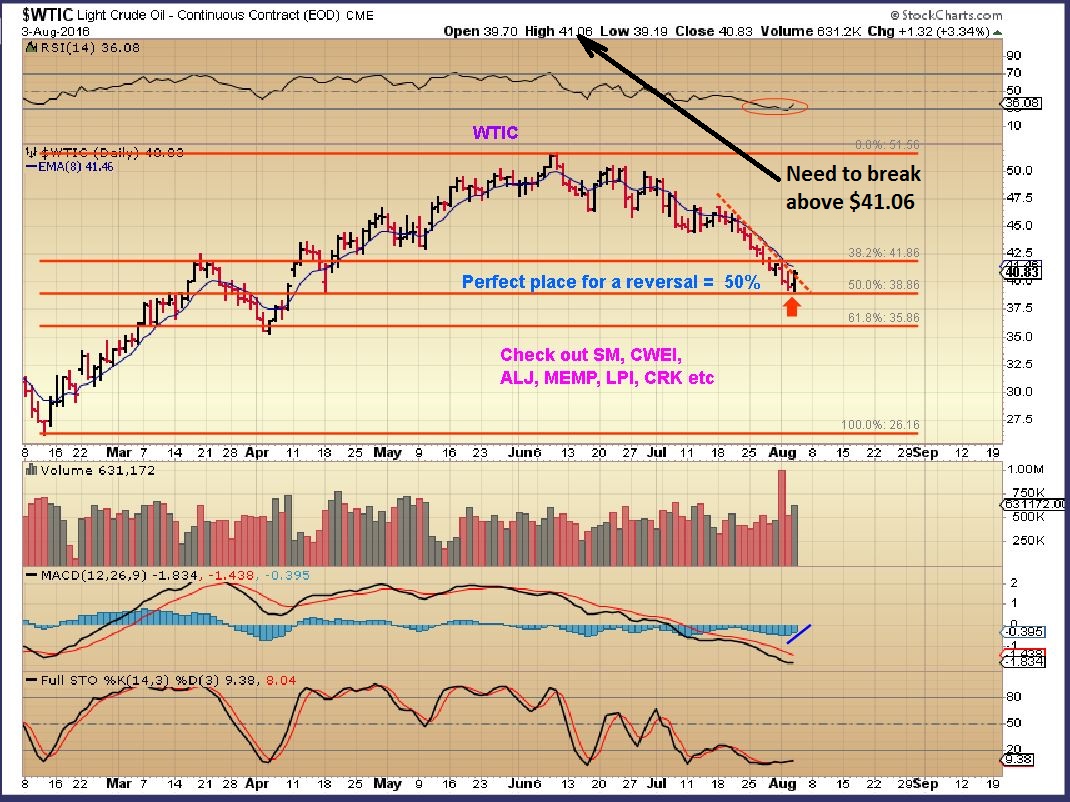
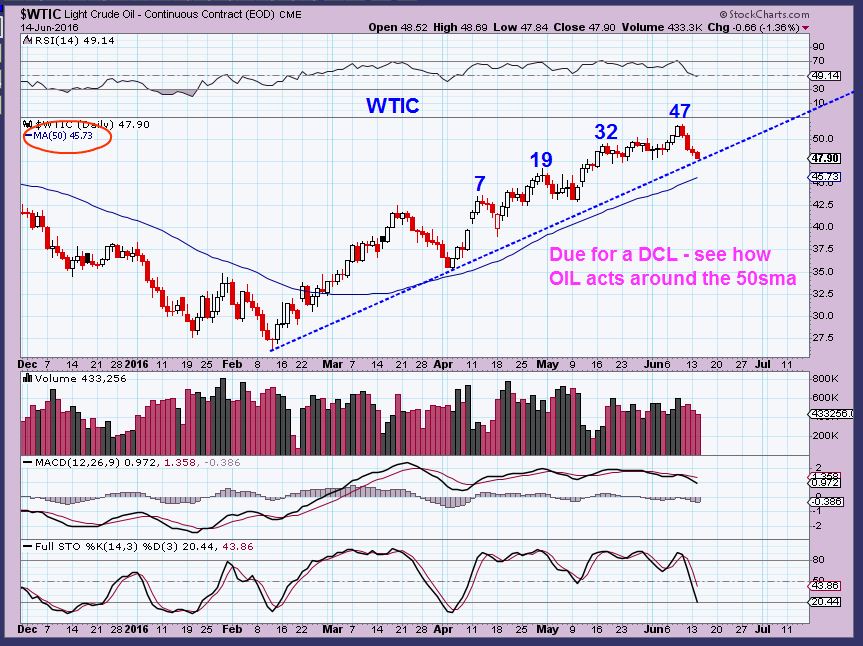
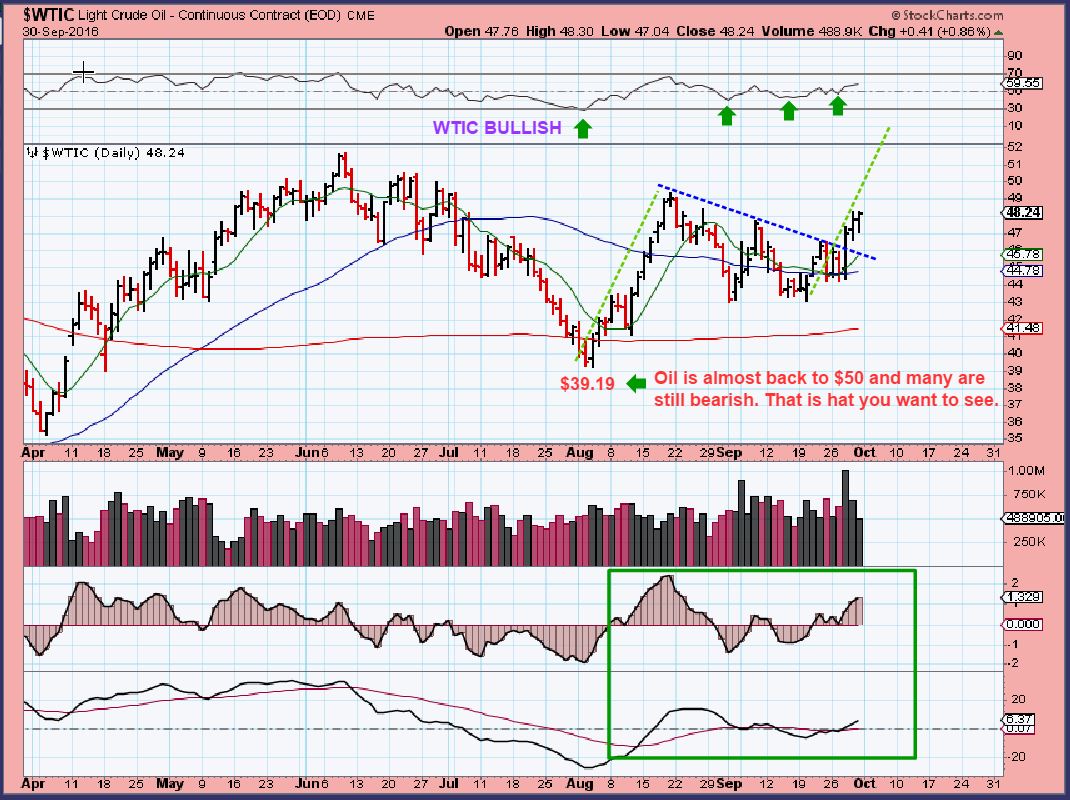
WTIC – Break out and follow through as expected. Please read the chart.

wtic-9-30-d

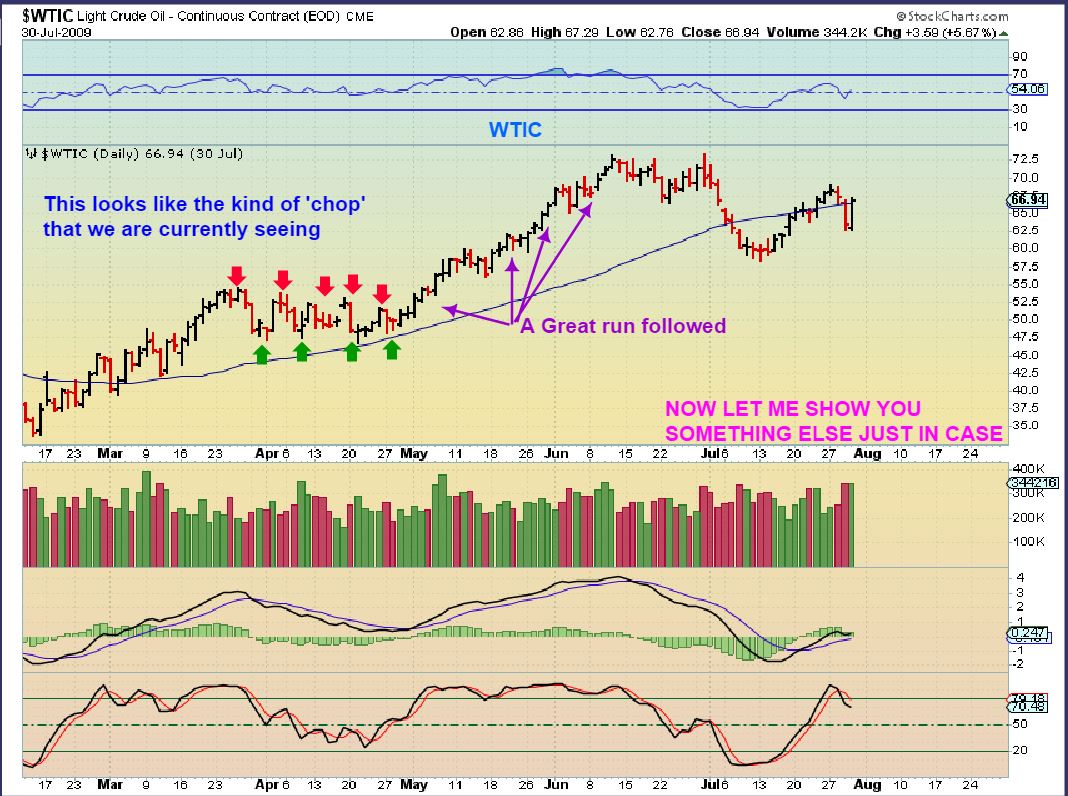
Please notice that when OIL bottomed in 2008-2009,  it also had a sideways choppy period for weeks like we just experienced and then it ran strongly.

wtic-2009-first

We had been looking at and discussing a variety of Energy stocks throughout 2016 since February like CWEI, RICE, WPX, AREX, SDRL, AXAS, MRO, CHK,  and many more. 


.

GOLD , SILVER, and MINERS

.

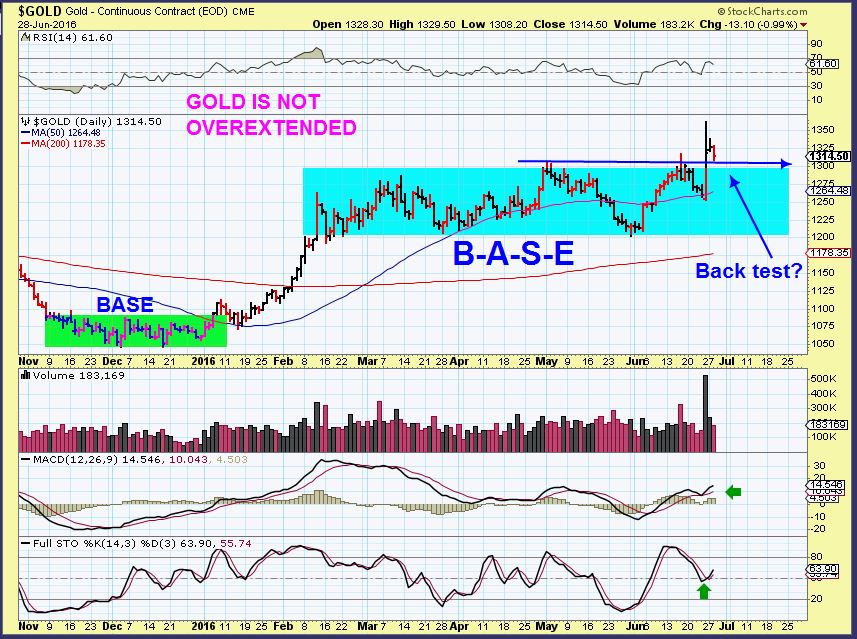
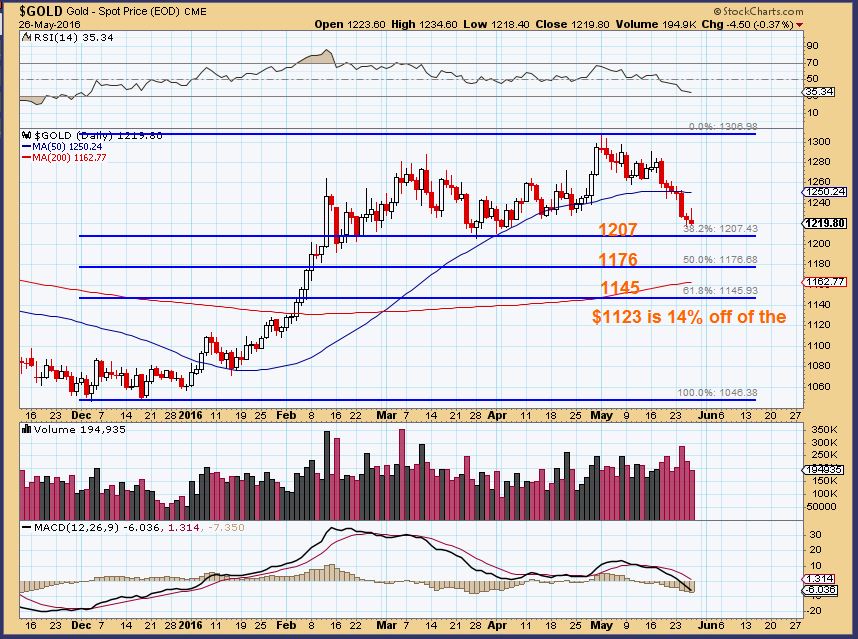
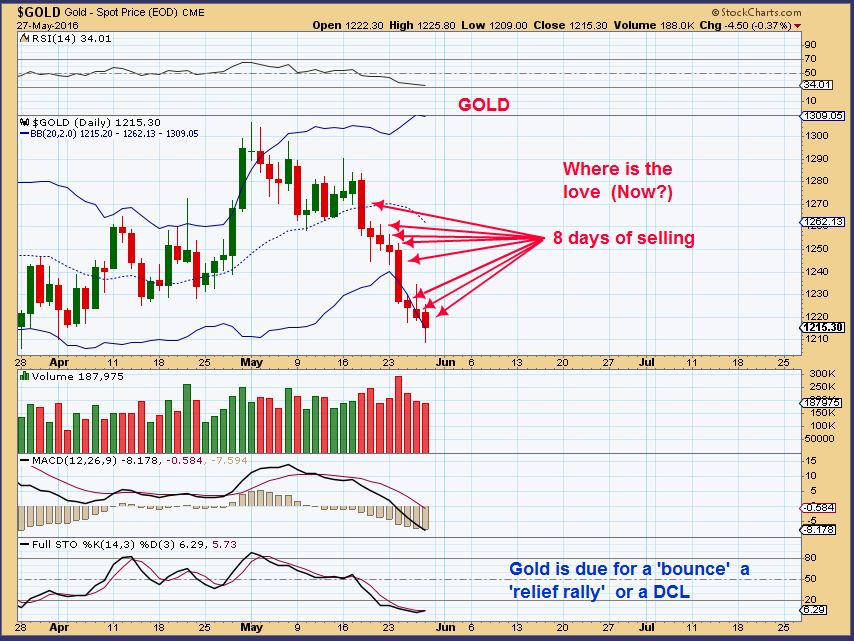
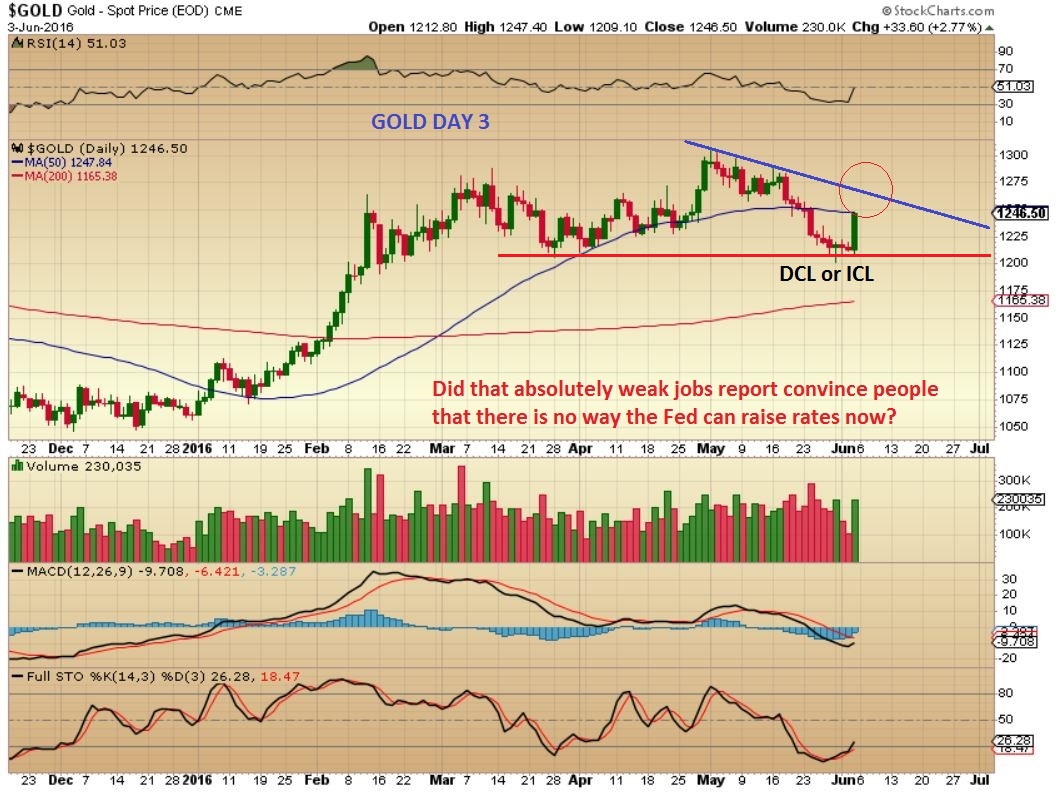
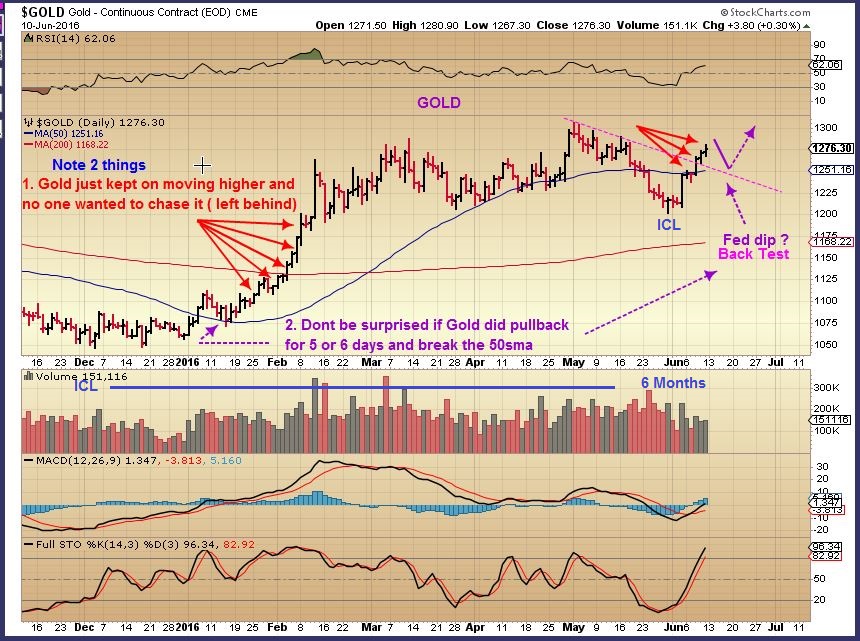
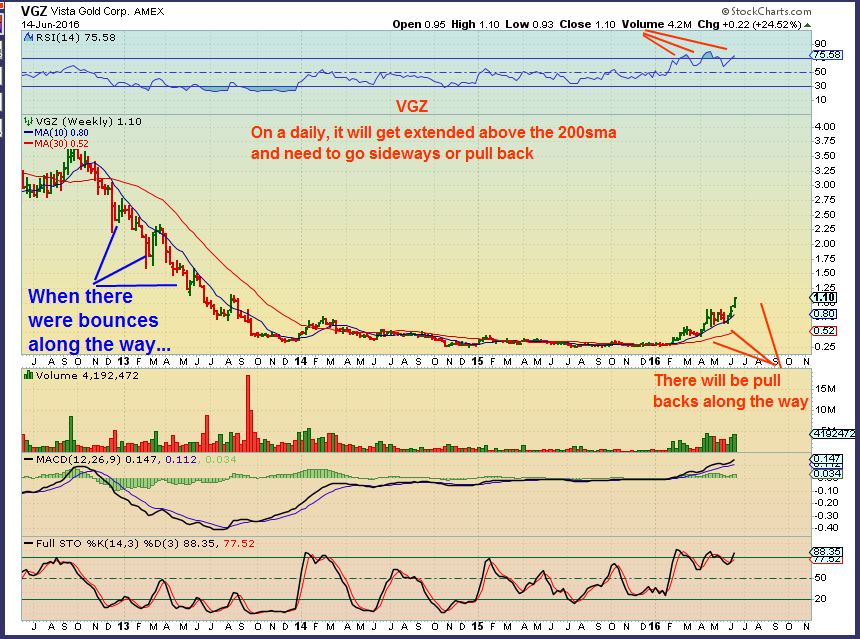
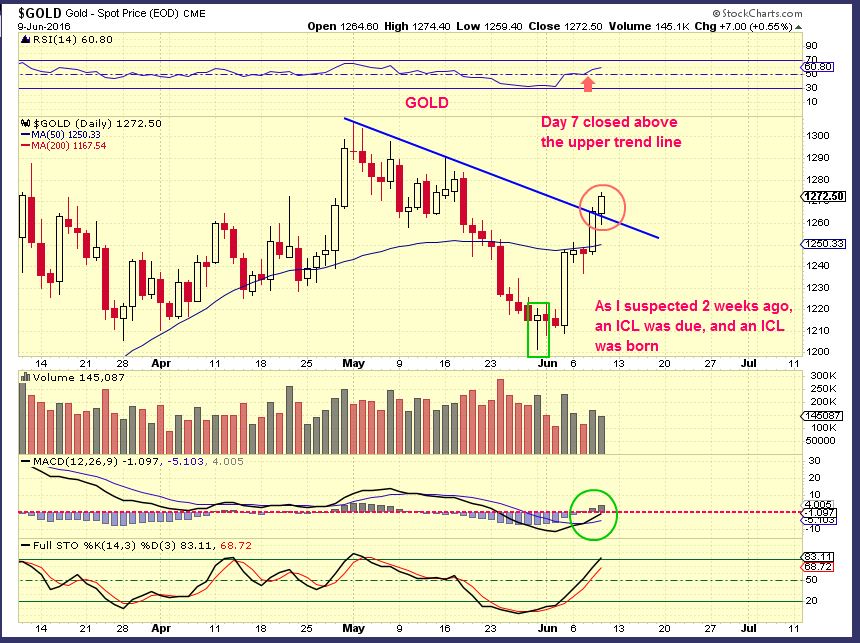
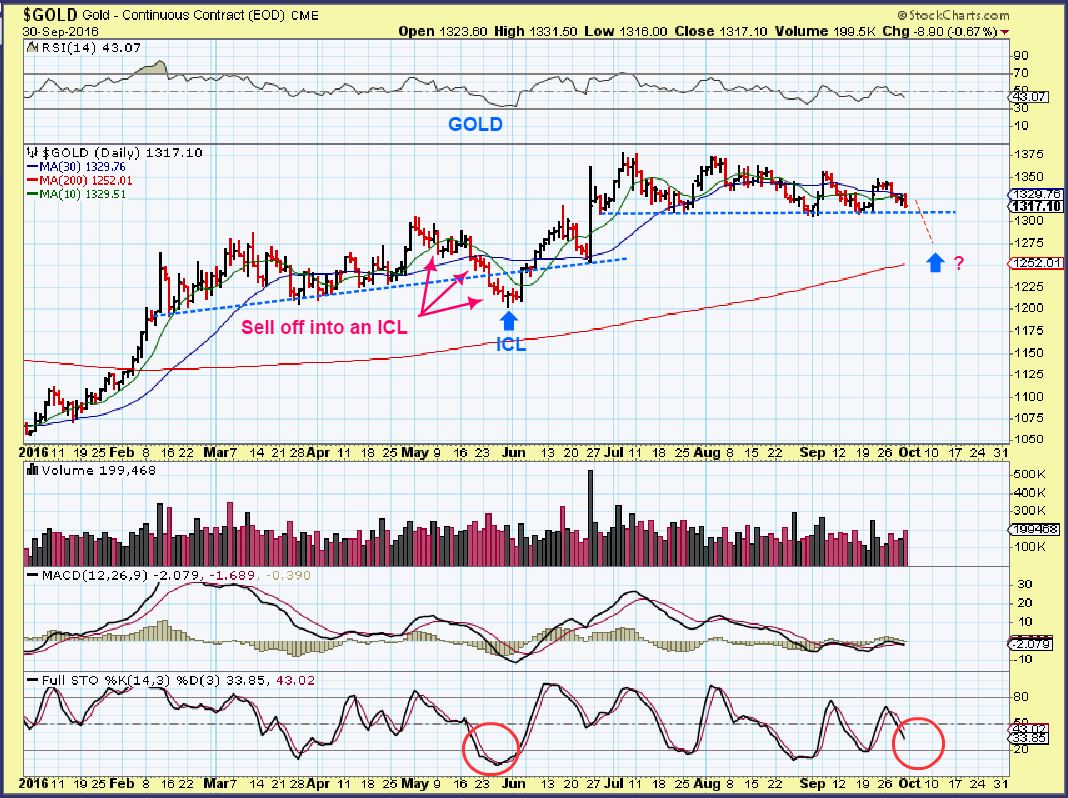
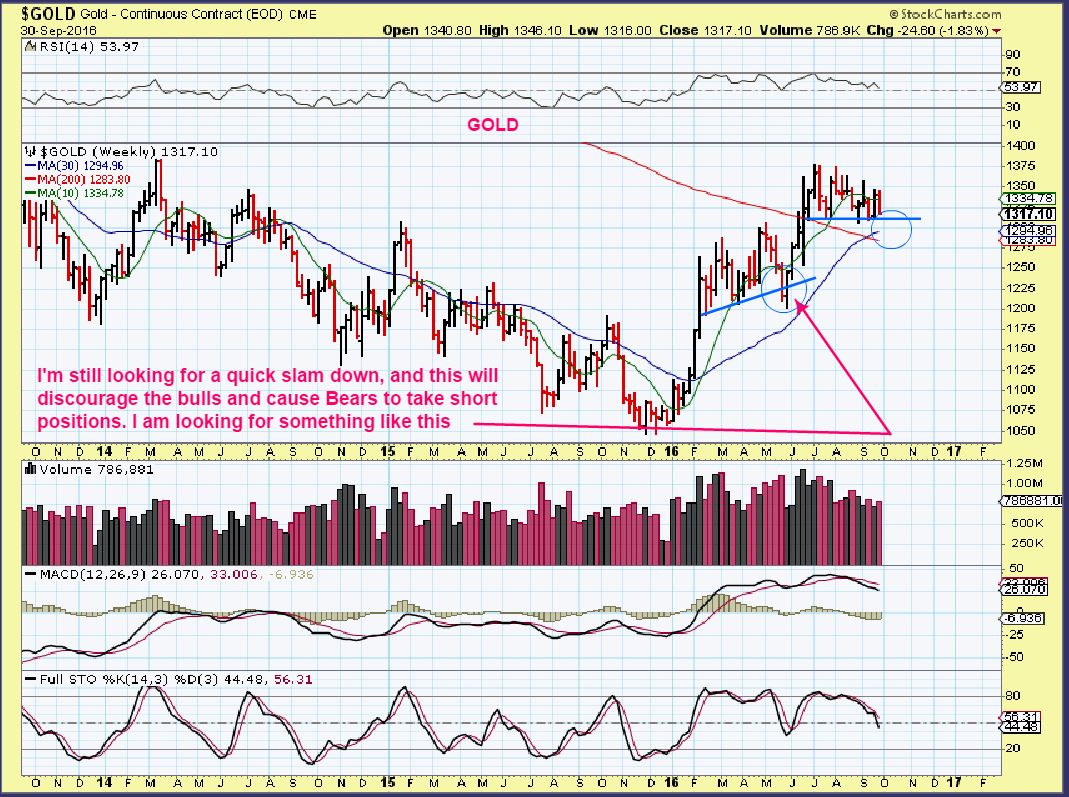
GOLD–  I am expecting the dip into an ICL. A great buying opportunity should be coming soon, but this drop may cause some Gold Bulls to sell and not re-enter. We will be ready to buy. See the chart.

gold-9-30-d

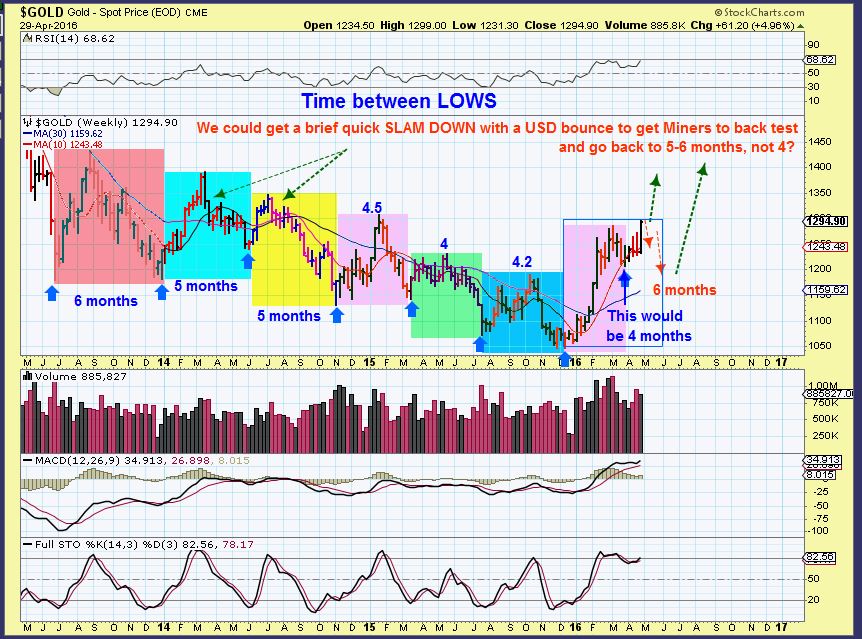
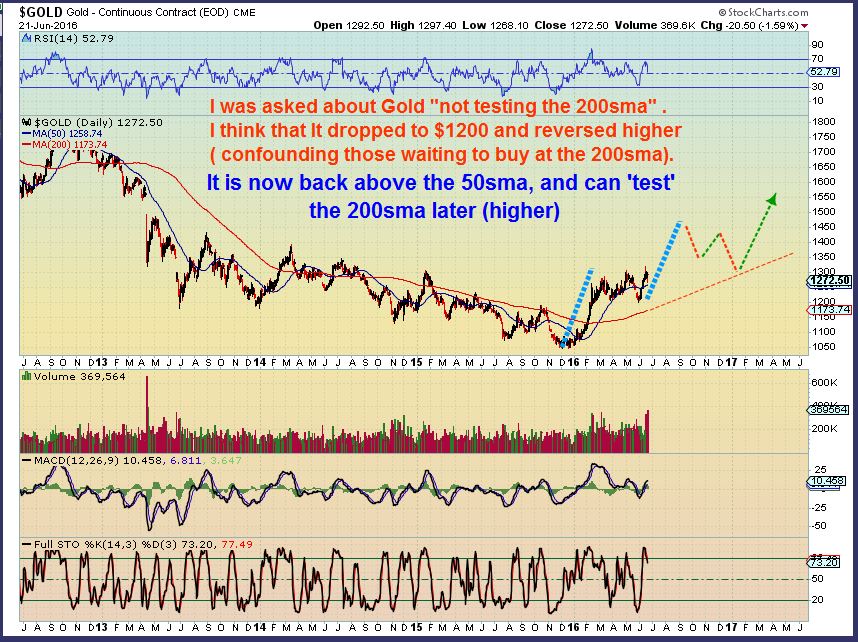
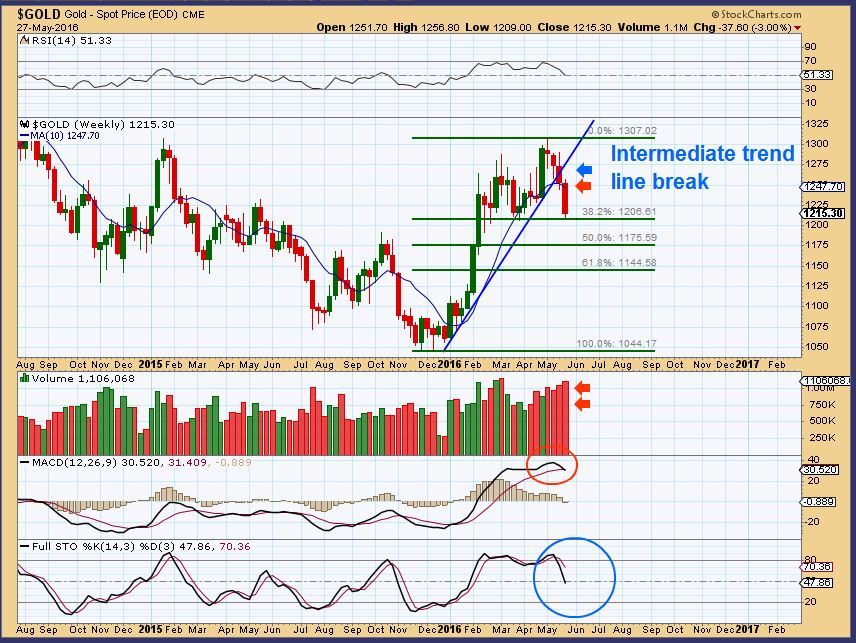
GOLD WKLY–  Read the chart please.

gold-wkly-9-30


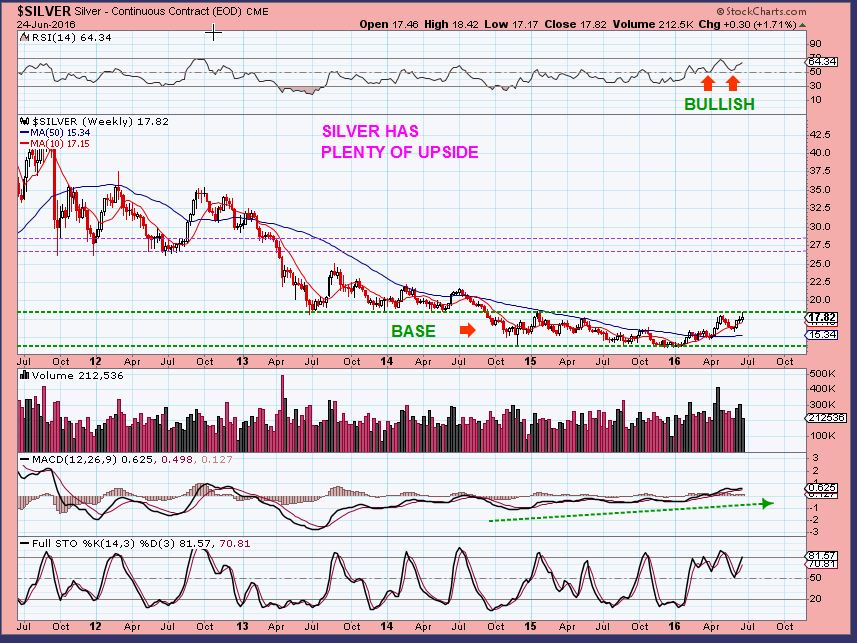
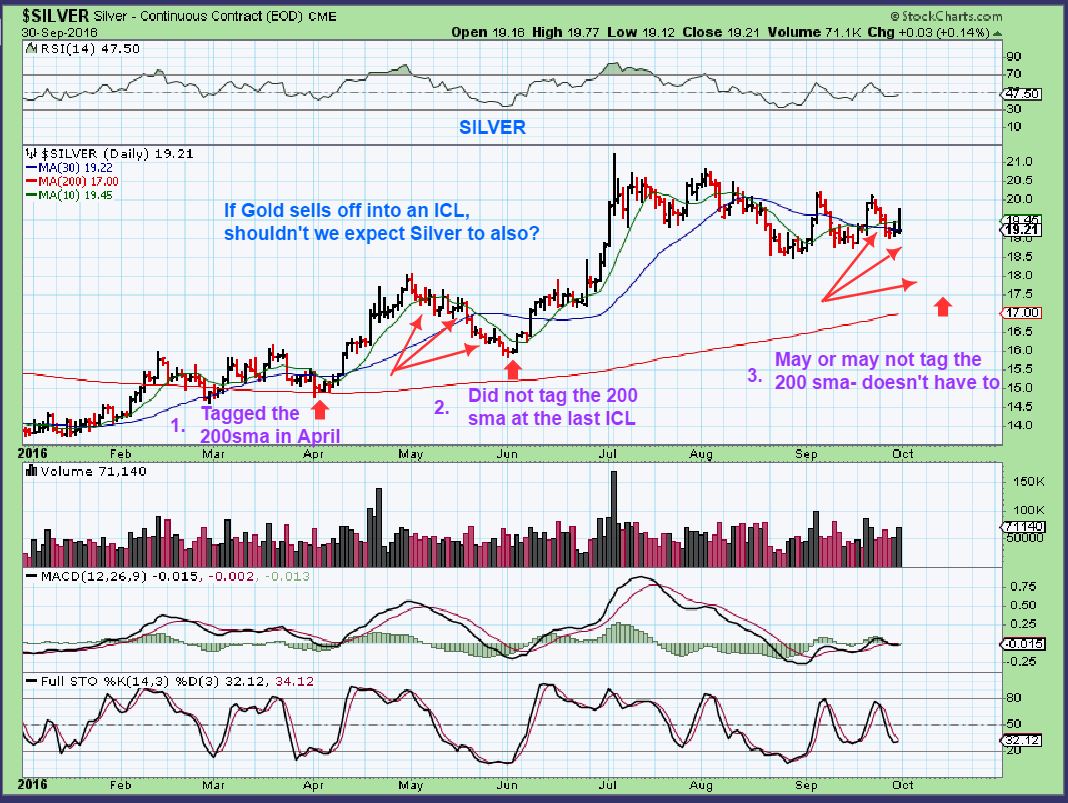
SILVER –  Read the chart please.

silver-9-30


LETS LOOK AT MINERS


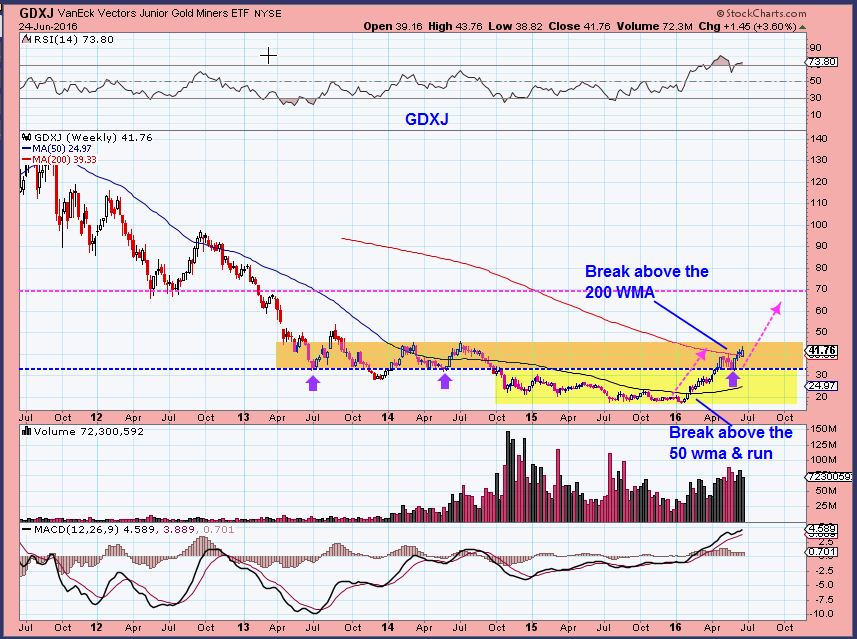
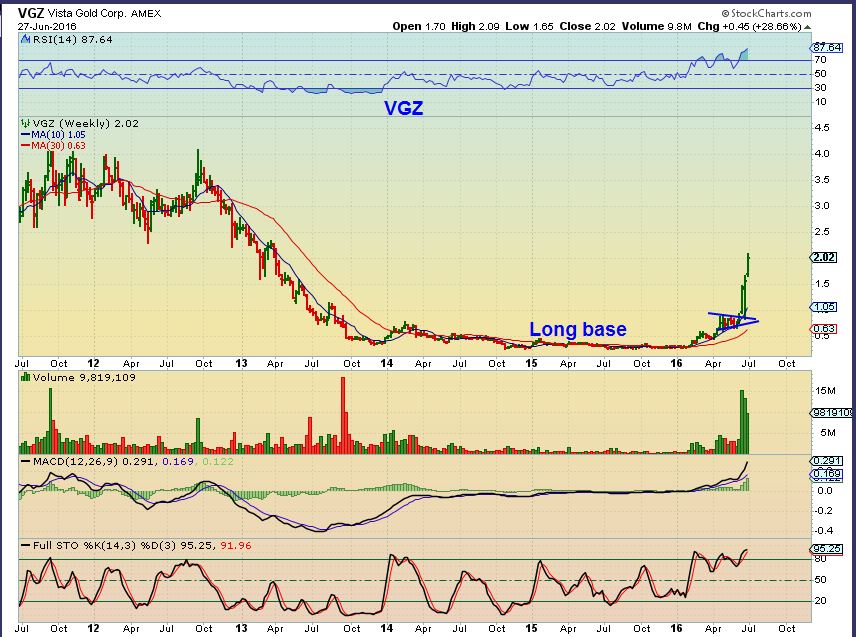
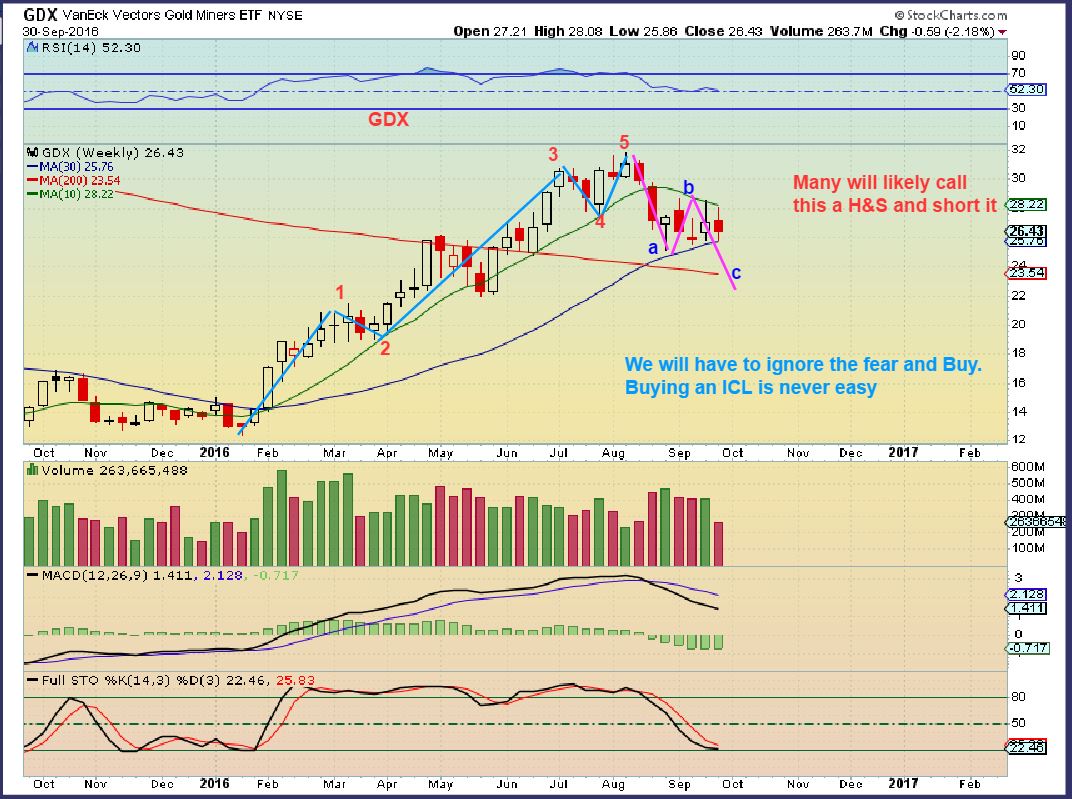
GDX– In Bull markets, Miners consolidations can lead to very profitable moves higher.

gdx-wkly-9-30-first


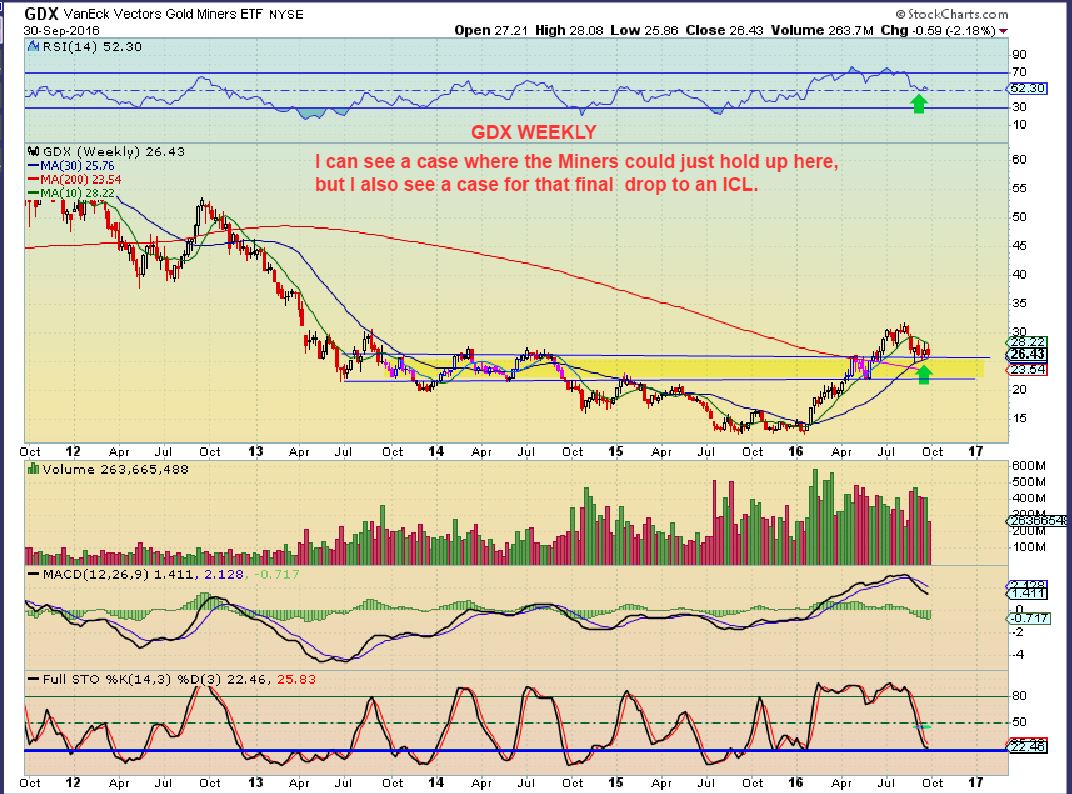
GDX – A back test of the 200MA  would be a drop into an ICL, IF it happened. This weekly chart is getting oversold, that is good news.

gdx-9-30-w-1


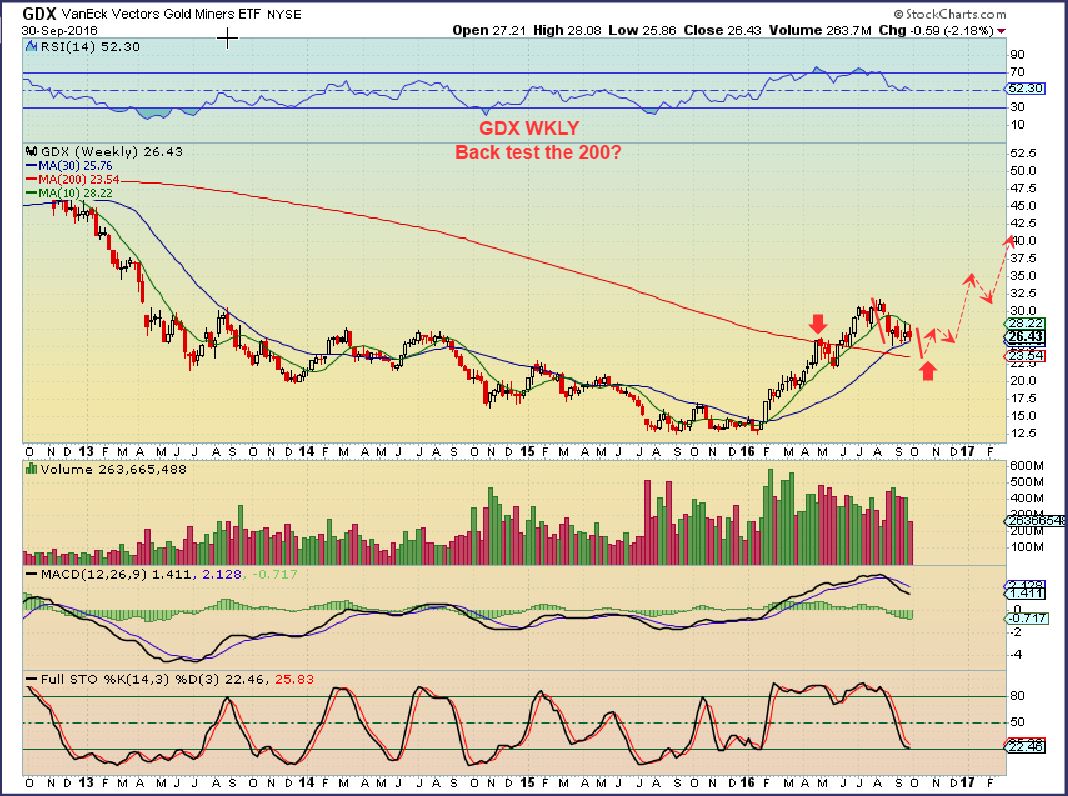
GDX  WKLY with a drop into an ICL , Elliot Wave style. please read the chart.

gdx-wkly-e-w

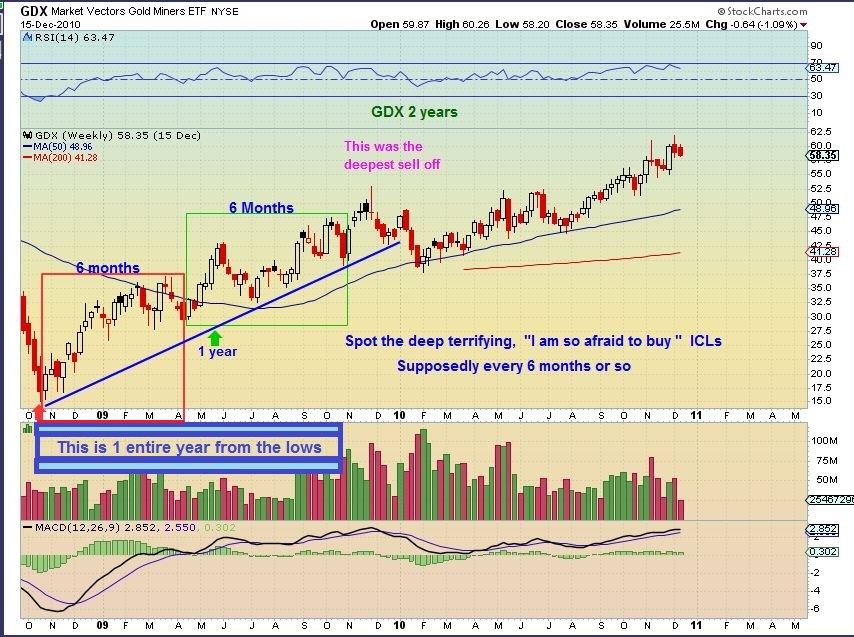
DO YOU RECALL IN A RECENT REPORT I was pointing out that this sideways action has happened before, and yes it is frustrating, but it always ends eventually.  Here I was pointing out a sideways chop in 2014 that had a final quick plunge into an ICL.  Unexpected to many that didn’t know cycle counts.

gdx-9-27


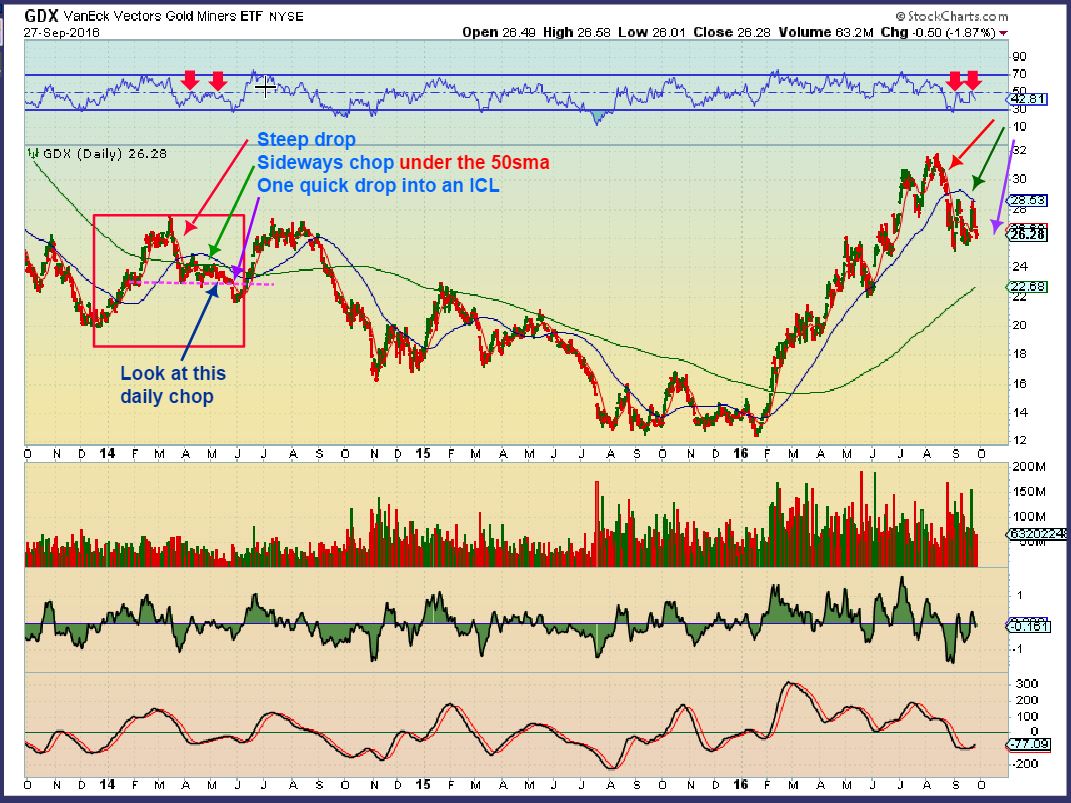
I wanted to zoom in on that Quick plunge into an ICL, since we are likely near one now.

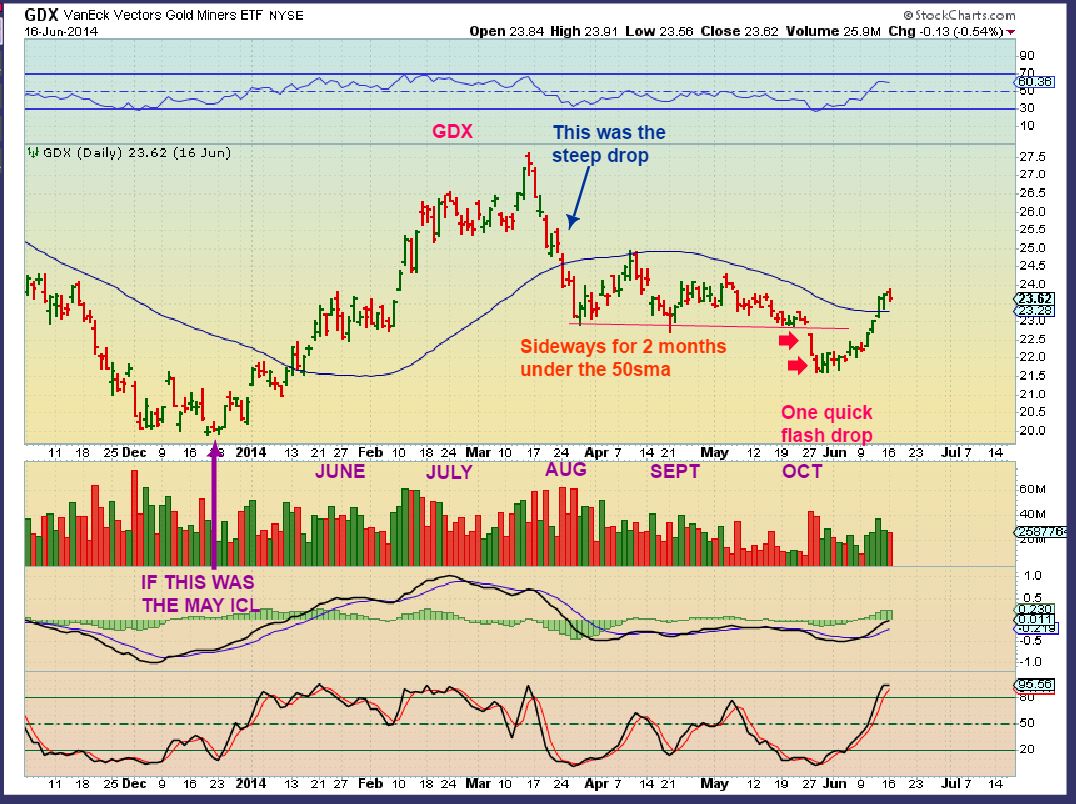
  1. That break down was very scary to buy, it was just a 2 day plunge.

  2. I wrote in the Purple dates under the actual dates that this occurred. Those are our current cycle count, and please notice how that lines up  🙂

  3. In 2016, the Miners last ICL was the end of May, and look where that leads us this for that plunge.

gdx-9-27-choppy-timing

.

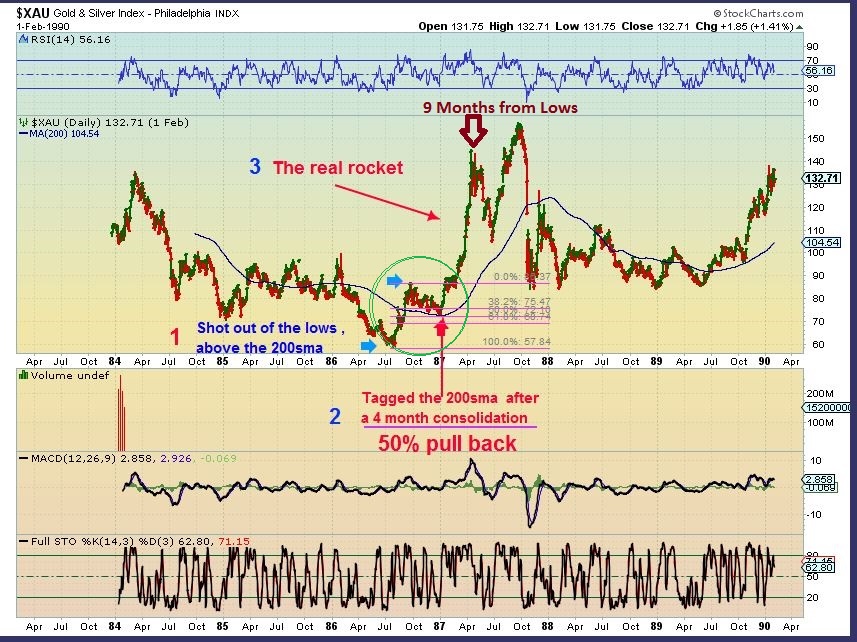
Since the sideways chop and consolidations can be frustrating to many, causing them to want to sell and give up, I want to re-post this chart.

.

This was an XAU consolidation in the Green circle.  Again, some are getting frustrated and tired of waiting in this current sideways action.  This was a chart that I posted a while ago, so you can ignore what I wrote on the chart then, and just focus on GREEN CIRCLE.  You see 3 months of just sideways chop &consolidation.  NO MONEY TO BE MADE TRADING THEN.  CHOP CHOP CHOP and if you kept jumping in and getting stopped out, it was frustrating. Now look at that run up after the 4 month chopping action labelled ‘the real rocket’.   BOOM!

xau-87-navigating

SO basically I am expecting that a pullback will end this choppy sideways action.  I am pointing all of these reminder out  ( And will keep doing so) so that my readers dont get frustrated with the current  price action in Miners and say,  ” This rots, I hate Miners. I’m not buying this weak sector anymore!”   Not that you would, but some do, and I think GOOD TRADES are fast approaching.

.

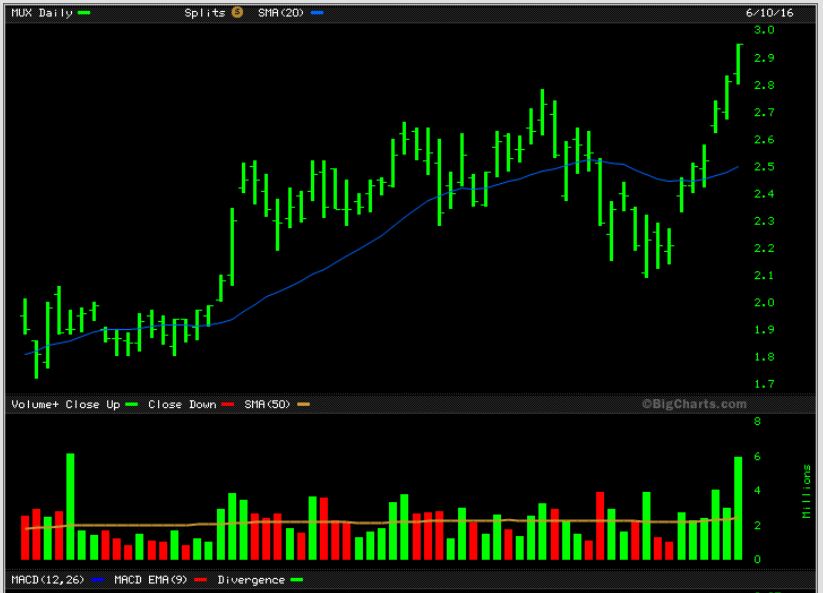
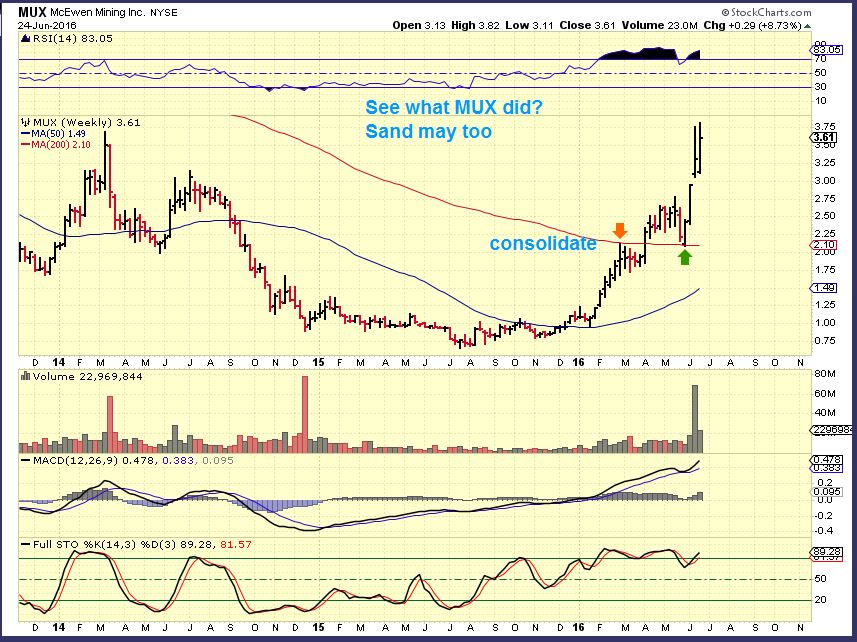
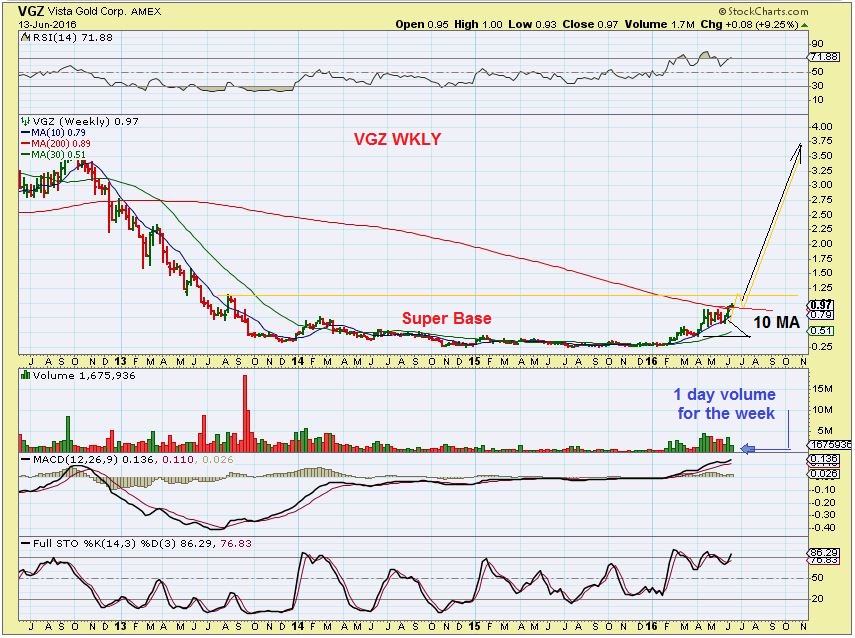
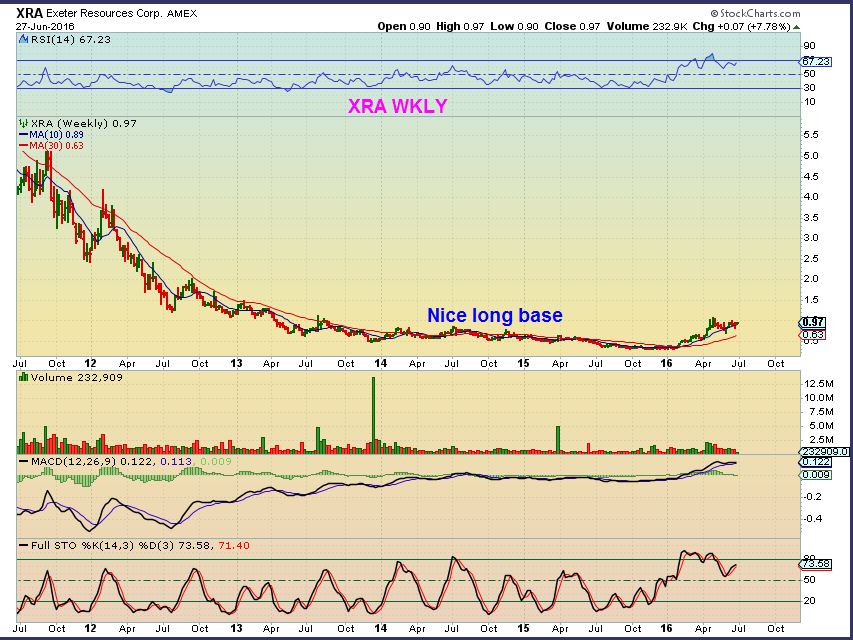
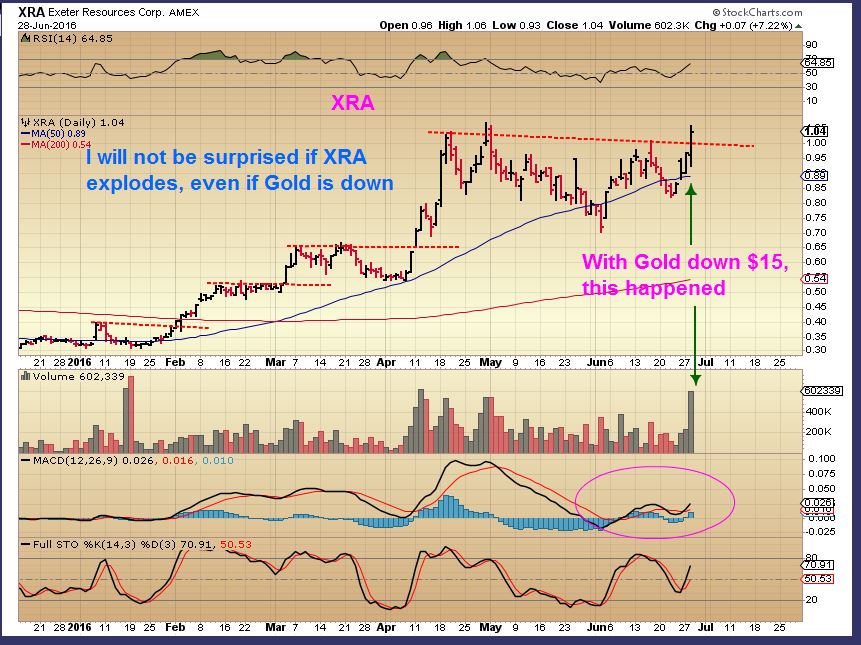
So – look at the following 2 charts of  GORO and GSV  and you see some bullish action even now while Most Miners are chopping sideways and pulling back.  This is making me think that when Gold, Silver, and the Miners finally take off upside, Miners may really spring into action as buyers step back in  ( And some shorts cover).

GORO

goro-wkly-9-30

.

This was part of my weekend wrap up for the end of September 2016  Oil & Energy trades may make us some extra money while we are waiting for Miners to finally get moving upside, or maybe holding CASH is a position that serves you best. My experience has proven to me that patience during these consolidation periods and buying the dip pays off very well. Thanks for being here, have a great weekend!

.


Chart Freak Premium

Chart Freak members receive up to 5 premium reports per week covering a wide array of markets, as this public post illustrates.  Come and join the ChartFreak community as we trade the new Gold Bull Market and various trending sectors.

join-now

~ALEX


September 20 – What’s Happening With Gold?

I have a core position in Miners that I started early in 2016. As a trader, I have sold most of my shorter term trading positions and I am waiting for the fat pitch to reload. Are we there or is there further selling likely? I believe that we are very close to another run higher in the Precious Metals sector, but we also have the Fed Mtg on Wednesday that could affect things short term. Are there any clues pertaining to short term direction?  Please read on...

Read More

Did You Buy That Dip?

At Chartfreak, we were anticipating that a higher low in Oil would prove to be an exceptional buying opportunity after  the recent summer sell off.  Cycle timing was telling us that it was 'time' for a low to develop, so we began monitoring the charts using technical analysis and cycle timing.  Did you buy that dip at the right time? Let me show you what we were watching using actual charts from our August reports.  You can ask yourself, if I was a chartfreak member, would this may have helped me with my investing in this sector?


WTIC AUG 3 - Anticipating the coming low, I used this chart to start with. We had a 50% retrace and some Energy stocks were beginning to look Bullish too. I encouraged readers not to buy until we get a break above the tight downtrend.

WTIC 8-3 Read More

Gold Core Positions and Miners

 Gold Core Positions and Miners


Note: This post is an except from a nightly member only report.


SPX - Not much has changed over the past several days, but consolidations often lead to strong moves.

SPX 8-1

Read More

Miner Ideas In A Major Move

I am releasing the premium report that I wrote last Thursday for Friday mornings  trading. I feel that much of it is still applicable today. Enjoy.

.

In a recent report I was discussing what I called Giraffes.  These are the special set ups in certain Miners that explode higher giving the chart a look of a giraffe neck. Certain set ups form during consolidations and lead to this price explosion, giving us some big profits. Obviously finding them BEFORE they pop is the key to maximized profits. Lets take a look at some of our Giraffes from past set ups, then I want to discuss what I think will be the next ones.


This was our set up in XRA at when it was just under $1.00

XRA 6-27

2 days later we were up over 30% with the giraffe neck 🙂

XRA 6-29b

Lets look at another explosive POP that we caught, and then I'll  point out our next candidates...

Read More

Your Next Step

Your past steps have moved you to where you are today,  your next steps are just as important. Allow me to walk you through a look at what Chartfreak readers were hearing before & after the Brexit vote.  Those steps brought us to where we are now.  I’ll also show what we currently see when it comes to Precious Metals.

.


GOLD AND HOW I SEE IT NOW

GOLD 6-28

I kept reading everywhere in Late April / Early May that Gold had to plunge down and tag the 200sma before it could move higher. Why? Many thought that Gold was overextended. I agreed that it could, but I also pointed out that Cycle Timing caused me to be looking for a very important low imminently. I drew a drop to $1200 area, but mentioned that $1170 was possible too.

GOLD 4-29 wkly time#2

As we dropped to the $1200 area , Fib #’s and ‘ Cycle Timing’ came into play. I was looking for a low.

GOLD CURRENTLY IN ITS DROP


I then called a possible low at the $1205 area with capitulation type selling scaring everyone away and causing a lot of ‘fear’ talk. I mentioned that I couldn’t tell for sure, but I think that the lows were in or at least a buy-able bounce with that reversal.  I began buying Miners 4 weeks ago, at the end of May.

GOLD 5-27 b


This was day 3 of the lows, and an extremely low jobs report was released. Gold blasted off higher. A close above the blue line would confirm my idea of deep meaningful lows ( An ICL).

6-4 GOLD DAILY

I was asked in an email, “What about all those saying that the 200sma needed to be tagged?” I agreed that that ‘tag’ could come, but did it have to be in May?  I said No, and drew this idea.nThe Tag could come later and when the 200sma is actually higher.

GOLD TEST 200sma 6-21


Gold was now a bullish set up and was running out from an ICL. We actually had a consolidation from FEB to June, for those thinking that Gold was overextended.  It isn’t, it had gone sideways for months.

GOLD 6-10

Silver stocks have doubled and tripled, is the move in Silver & silver stocks done? This is a great looking base if you ask me, and only the beginning in the long run.

SILVER 6-24


And GDX & GDXJ have had great runs higher too, but that may be just the beginning.

GDXJ 6-24


Timing a trade is important though. Now I want to walk you through a few trades, and show you a current trade that I think will play out well.

.

I recommended VGZ and MUX before they exploded higher. I didn’t offer an exact entry or exit,  just that I had bought them a bit earlier and they were looking at a possible explosive set up.


MUX – I had mentioned to my readers that I had been buying Miners and bought MUX in May at the 50sma near $2.25.  June 12 it was now breaking out from a constructive consolidation with great volume. Even at this point it was a buy-able break out.

MUX

 MUX  popped and ran very strongly. It remains near $3.75 consolidating recent gains.

MUX 6-24 like sand

JUNE 13th –  VGZ was at $0.97 .  I bought this consolidation and mentioned that I thought Golds ICL was in,  Miners should be bought.  Dont go ‘all in’, but it was a great trade set up as shown. It had a super base.

VGZ wkly 6-13

VGZ at $2.02.  Gains of over 100% in 2 weeks.

VGZ wkly 6-28

That leads me to today. When those positions get extended, I like to sell at least 1/2 and look for other similar set ups.  I pointed out this stock Monday and even with fundamentals that are not ideal-  the set up is perfect again.

.

June 27 XRA– This has had a nice run higher and has consolidated.  I bought it near the 50sma and posted this chart as a buy above support. Another 97 cent stock 🙂

XRA 6-27

XRA –  It wasn’t just the recent consolidation and set up that I liked, I also pointed out that another super base adds  relevance. Does this base look a bit like the chart that follows it to you?

XRA WKLY 6-27


VGZ as it broke out and ran to $2+

VGZ WKLY 6-14

Tuesday June 28 –  So again, I had already posted XRA, but I posted it again in todays report.  This is an explosive looking set up, even if one just took it for a quick trade on a possible break out.

XRA 6-28


XRA June 29 as I write this report, XRA is up another 13% today. Actually , it just popped up 20% as I was writing.

XRA 6-29


THM – I pointed out another one just like it Monday at 75 cents, what a nice set up. Watch these run.

THM 6-27

Boom –

THM 6-28

I am constantly searching for what I know to be explosive set ups in the bullish market sectors,  Right now I am bullish on Precious metals and the set ups look very nice.


 So did you buy VGZ, MUX, ASM before they broke out?  Are you in XRA today? Not every trade works out with 20% gains day after day, but these recent gains are seriously helpful to the portfolio.  For example, I also recommended SAND & BTG over the past 2 weeks and with small gains, SAND backed up yesterday on a public offering.    Not a big deal, down 7% and  I am actually still bullish on SAND,  but I just wanted to point out  that not every great set up works right away. A small position in the ones that do make up for any that do not however.  Honestly, other miners recommended are doing well too, and still others are currently ‘setting up’ for possible future explosive moves. 


I will keep premium members posted when I see these bullish set ups.  I do see a few more currently acting correctly.  Why not get an extra set of eyes by trying chartfreak for a month?  One trade may pay for that month.   Thanks for reading along, and best wishes!

.

CLICK HERE AND SCROLL DOWN TO SIGN UP

.

~ALEX


Public Report – The Uphill Climb

The Uphill Climb

When a climber begins his or her ascent, they are full of energy and the start of the climb is always easier than when they near the peak. As the climb continues, you may see him or her periodically rest, shake out the tightness,  even drop back and pursue a different path to the top.  I often see that same thing happen in the climb of various stock market sectors, and Precious Metals and the Oil sector is experiencing that now. (Long term they remain bullish in my opinion), WTIC - This was June 14 and we were on day 50 of a Cycle, so it was already late in crude oil's daily cycle and I was expecting a low soon.   WTIC 4-14 Read More
Precious Metals Primer - A peek into the next phase - chart freak

Precious Metals Primer – A peek into the next phase

Precious Metals

You may have heard that you should not buy precious metals miners until after a ‘blood bath phase’.  I mentioned within my (premium May 18) report that I have received numerous emails telling me that warnings were out that the next Intermediate Term Cycle Low (ICL – A cycle low that occur every 5-6 months) will not come until we first see a huge sell off within precious metals.  Many fear that the blood-bath is still directly ahead, and some think it will occur around the Brexit vote (June 23rd).

Today, I would like to share with you just a brief excerpt on what I’m looking at here within the precious metals sector.  And within my coming weekend member report, I will be going into much more detail on what one should expect in the coming months.

Below is a chart that shows what happened coming out of the 2008 lows, when many were also looking for a an ICL and “blood bath” sell-off.  As you can see, advances out of bear market lows do not follow the typical script.  Simply put, there was no blood-bath to be found around six months after the Oct 2008 lows…it occurred almost one year later.


Precious Metals Primer - A peek into the next phase - chart freak

Actually, for the past two weeks, I have been saying that we could be at or past the next important low in the precious metals sector. Last weekend’s report discussed this idea further, and this weekend, I will include more research on that theme.

I also mentioned that a gold break above the overhead down trend line would give further evidence that we saw an ICL, without a blood-bath phase. This was gold on June 9th.


GOLD Precious Metals Primer - A peek into the next phase - chart freak


USD – The USD was in decline, but due for a Daily Cycle low (DCL) this week.  On Thursday, the USD took back three days of losses, but Gold and Silver moved higher despite this strength. We have seen a change of character here, where the dollar can rise and gold manage to resist the expect drop in response.  See also Feb 2016 on this chart.


USD vs GOLD Precious Metals Primer - A peek into the next phase - chart freak


It will never be a straight run higher with precious metals, it takes discipline and patience.  However, gold bull markets are known to surprise and have the ability to leave so many people behind.  With this weekend’s report, I will outline what I believe is occurring today and will cover what members could expect going forward.


Chart Freak Premium

Chart Freak members receive up to 5 premium reports per week covering a wide array of markets, as this public post illustrates.  Come and join the ChartFreak community as we trade the new Gold Bull Market and various trending sectors.

join-now

~ALEX


##


Gold Bull Market | Robert Alexander | Chart Freak

The Gold Bull Market – Is it time yet?

The Gold Bull Market

Do you think the Gold Bull Market has returned?   Obviously I do, and have been trading as if the Gold Bull Market has returned.  You need to be aware of this opportunity and appreciate that another big move in this Gold Bull Market is again developing.  If this next move is anything like the moves seen during past Gold Bull Market's, then you will not want to miss the next buying entry after this current correction winds down. I was able to successfully guide Chart Freak members through the recent 100% rally in gold miners when we bought the lows back in the middle of January.  Those gains were exceptional, to say the least.  In some cases, junior miners rose up by 500% off the lows, and are now consolidating those gains in preparation for the next leg higher. My recent weekend report (premium version) took a deeper look at Gold's recent correction and how the current action in the US Dollar may impact the precious metals market.   However, it is again time to start paying closer attention to the Precious Metals markets, because after-all this is a Gold Bull Market.  Let me take you through some of the premium content I shared recently and review what I believe is occurring.

Gold Weekly

Gold has finally started that correction, as seen on this weekly chart. Gold Bull Market | Robert Alexander | Chart Freak Read More

Market Turning Points And Trading


Market Turning Points And Trading


In a recent premium report, I reviewed interesting Market turning points that are showing up across various sectors.  I'd like to share some of that with you now.  Please note that most of this information was released in the weekend report of May 21st or within previous reports.


S&P 500 - SPX -  We see a mild pullback in the General Markets after a strong rally.  Not even a 38.2% retrace yet.  Many advisors were becoming very bearish and pointing to a possible H&S pattern, with a big drop to come. I see that H&S pattern, but they often fail, as I was more focused on a few other areas that indicated the markets were going to break out higher, not lower.

  Chart Freak - $SPX Read More