“Where Have You Been?”

I received a couple of emails recently from the public readers ( one was an old friend, Thanks Bob C. !) , either asking where have I been when it comes to my public posts, or asking me to review what I have been seeing lately. I've been very busy this spring with the premium reports and a private chat area that we have in there, plus other outdoor activities and responsibilities that I care for every spring, but as for a review? I  would be happy to do that. 🙂


The General Markets became choppy in March and I was expecting a drop into a daily cycle low. I estimated that the 50sma would be a good target.

For over a month things were choppy and difficult to trade really, until we got a directional break. The drop was not as sharp as I had imagined,  so some of the trades that I was taking were working out, but others lacked follow through, got choppy,  and stopped me out.  I admit that this was choppy and a difficult environment to trade in.


From April 25 - Currently we see a pattern of consolidation and then moves higher ( With pullbacks along the way).  We do have a FOMC MTG this week, and there is a chance that that may cause the markets to dip into a low

Read More

PUBLIC REPORT – Breaking Out

In several of my last public reports, I presented the Precious Metals markets as bullish.  Have you been able to take advantage of that?  At Chartfreak, we have been confident and able to make great gains in this sector since the December lows.  I want to again share with the public some of our weekend report.  This weekend we  just kept it simple.  This is some of what we have discussed recently in the premium side of Chartfreak.

I am going to skip the general markets , Oil, Natgas, etc. and just go right to…

.

GOLD, SILVER, & MINERS

.

THIS SECTOR REMAINS RIGHT ON TRACK WITH MY EXPECTATIONS FROM THE DECEMBER LOWS. I repeatedly cautioned against over trading or getting too cute and losing position.  If you are new here, please read my report on what it means to ‘Get too cute’ during a Bull run, click the link below to go there.

DON’T GET TOO CUTE

.

I’m going to keep this really really simple this weekend.


GOLD DAILY – This is a bullish chart and suffered no damage after FED WEDNESDAY. The dip at the end of January has recovered and I have us on day 5.


GOLD WEEKLY – GOLD has now recovered the drop below Mays ICL.   I still see a Bullish big picture, the Weekly MACD is turning higher.

SILVER – SILVER dropped on Friday, but it tagged the 10sma and recovered. That drop to the Thicker RED ARROW  was also the 50sma. Silver is on the Bullish Track too.

GDX – Miners  MIGHT want to dip down a bit inside of this rising channel, but it remains an upward sloping bullish channel. GDX has danced around the rising 10 sma and remains bullish.


GDXJ – This finally got above the 200sma .  Let’s keep it simple, it remains bullish at this point.  See the weekly chart below, even a drop to  $37.50 would be great.


GDXJ WKLY –  I cannot tell you enough how bullish this set up can be.   Wait – Yes I can, It is VERY BULLISH from what I have seen in the past.  GDXJ has run from $27 ish to $40 ish and looks like it wants to go back to 2016 highs eventually.  That’s a BIG MOVE higher after that long drop at the end of 2016. Can this drop to $37.50, the lower trend line?  Yes, and it would still remain very bullish.

To keep it simple, this precious metals sector remained Bullishly aligned, even after the Fed Week Meeting. The daily reports will monitor the activity as it unfolds going forward.  Newer subscribers, if you have time, why not go back and read some of the recent report from the past couple of weeks to see what we have been discussing & anticipating.  Again, enjoy your weekend!

.

~ALEX

.

So that was excerpts from the weekend report. For this Pubic report, let me share just a few more charts of the Miners from the Tuesday report, to add confidence to the bullishness of this sector thus far.

GDXJ WKLY –  Do you remember the Bullish chart that I posted of GDXJ above? This is the same wkly chart after Mondays trading. I told my readers that this was a bullish set up and no we see why I said that.

We bought the lows in December and I have repeatedly discussed with my readers why they did NOT want to over trade these positions.  I repeatedly mentioned that in this bullish set up, the selling could be minimal and difficult to buy back at a lower price.   Now, after a January consolidation, we see that that has been the case.  Many Miners began breaking out over resistance areas on Monday too. Let’s take a look…


NG – This did not have a big pullback, it consolidated December gains and started breaking out mid day Monday.

NG  – BY the close it was a lot higher. We are glad that we were not scared out of our positions.

PVG – Breaking out midday Monday, hardly a pull back here  during January too.


PVG was up over 13% by the close!  Again, at Chartfreak I reminded investors repeatedly not to get nervous and sell, losing positions.  We are not over-trading our positions since buying the Dec lows.

GORO – Breaking out Midday on Monday.

GORO followed through into the close.

PAAS WKLY –  You cannot deny that PAAS is a champion. It has returned to the 2016 highs already and others are not too far behind. This is a real confidence builder, isn’t it?

So using  Cycle analyses, technical analyses, and other methods that I have developed over the years, we have been doing very well with out positions in the miners.  For my readers, the reports have built confidence in the sector and various set ups that present themselves over time.  I will continue to monitor the move going forward and then there will be a time that it will be advantageous to gather some profits.   We then will see if we are presented with another opportunity to buy the dip.  This will be covered in future reports.  If you think that this type of analyses would help you with your style of trading, why not give us a try with a 1 month or quarterly membership? We also have a ‘chat’ section below each daily report where experienced traders gather and discuss their trades.  With your experience and another set of eyes, these reports could very well pay for themselves. Thanks for being here in the Public Section too!

.

~ALEX


Chart Freak Premium

Chart Freak members receive up to 5 premium reports per week covering a wide array of markets, as this public post illustrates.  Come and join the ChartFreak community as we trade the new Gold Bull Market and various trending sectors.

join-now


What’s In Your Wallet?

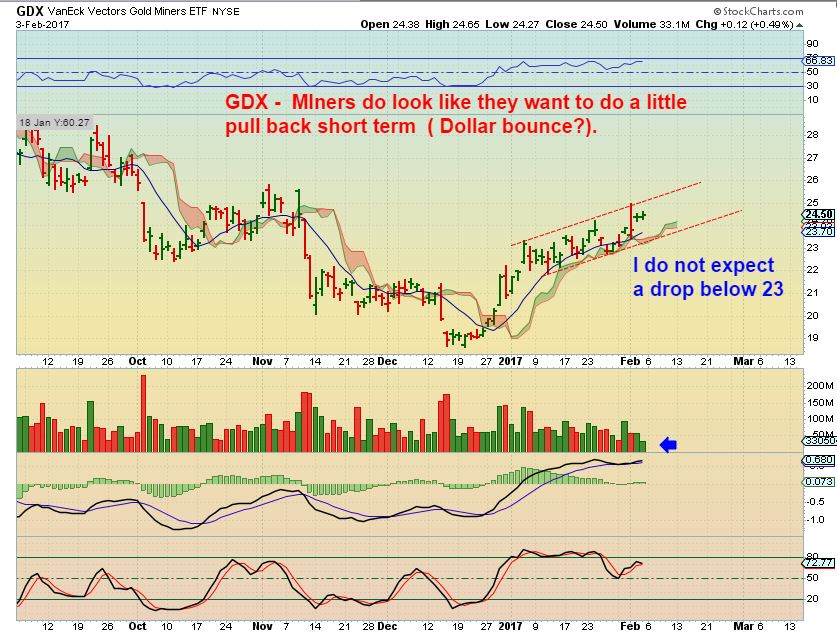
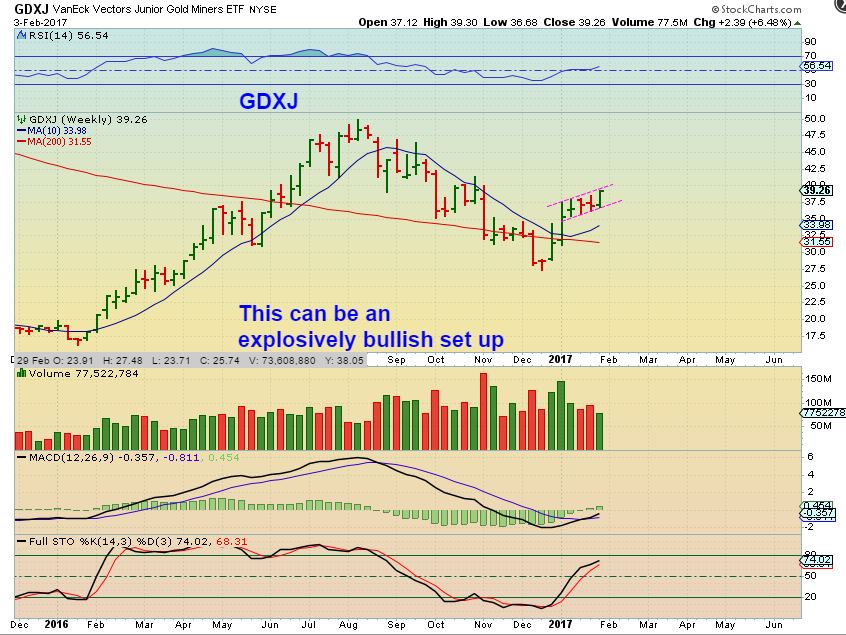
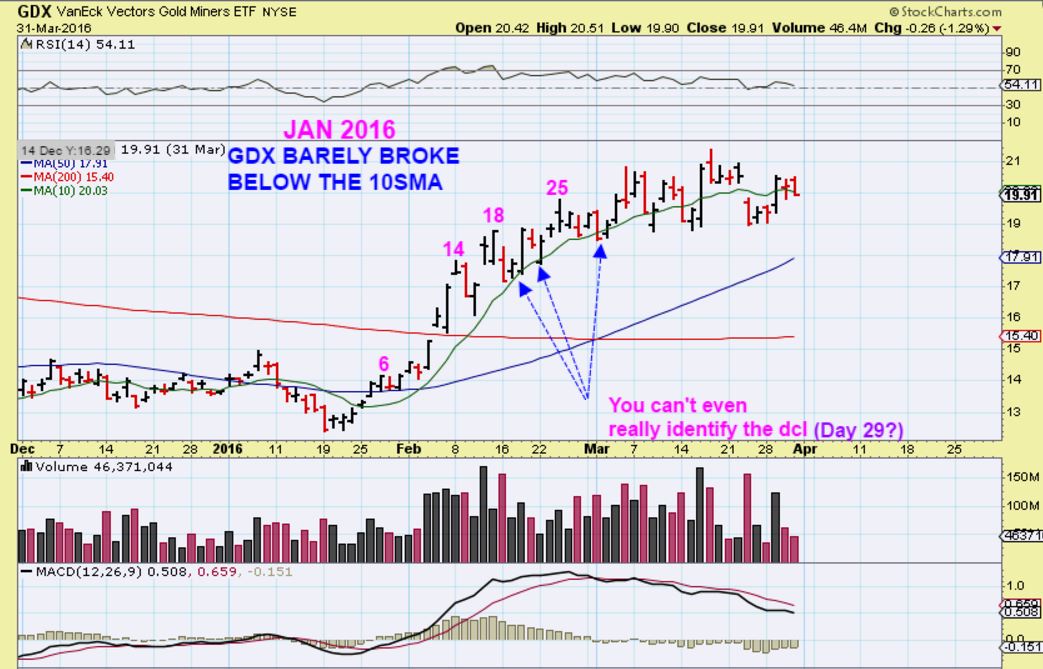
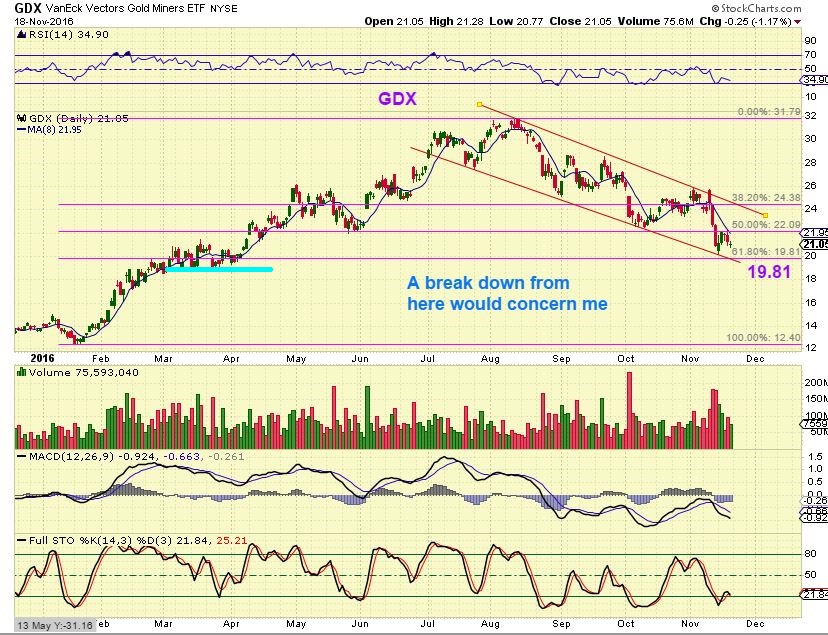
What have the readers at Chartfreak been looking at as the best near term investment?  Since the lows were put in in December, we have been buying and focused on Miners.  I did expect a pause or pullback in January, but I also wrote a special report telling my readers "Not to get too cute"  and over trade this sector, because more upside was on the horizon.  On the blog, last week I wrote specifically about GDX, see post: https://chartfreak.com/2017/01/market-vectors-gold-miners-gdx/ 
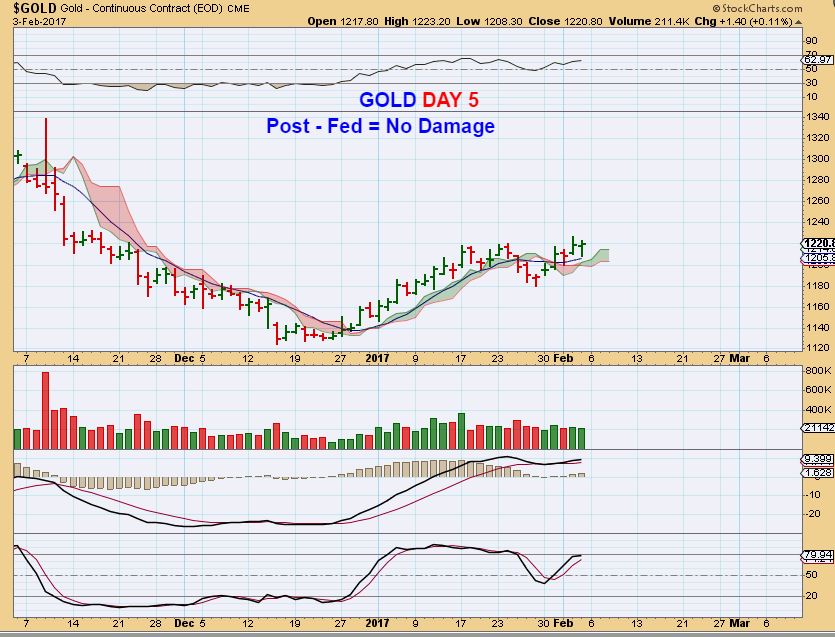
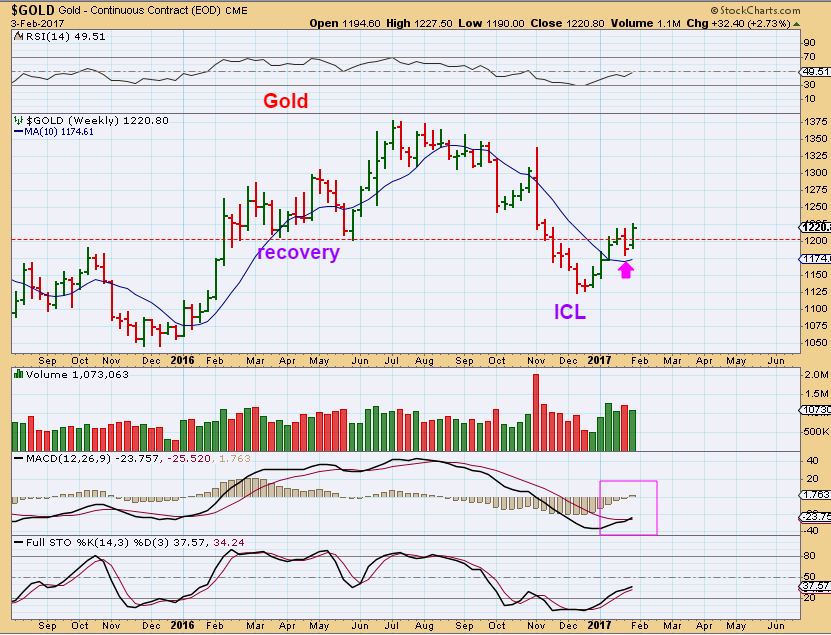
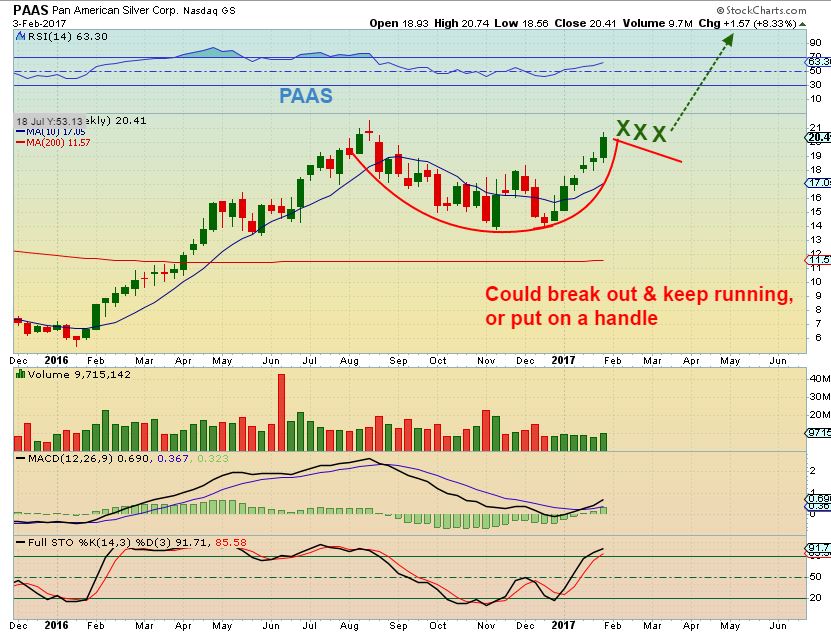
I've decided to give you a portion of the member report sent before Fed Wednesday.  The report covered all of the markets, but the main focus has been on the Precious Metals sector. So the following is a part of Wednesday's precious metals section. Read More
Market Vectors Gold Miners (GDX) - Chart Freak

Market Vectors Gold Miners (GDX)


Market Vectors Gold Miners (GDX)


A REMINDER OF JAN 2016 -

  Market Vectors Gold Miners (GDX) - Chart Freak - ChartFreak Read More

Cliff Natural Resources


Cliff Natural Resources

I pointed out the below chart of Cliff Natural Resources ($CLF) in the premium member report. Is it too late to take a trade when it jumps up 11%?  Not when I look at the big picture.

  Cliff Natural Resources Read More

JANUARY 2017 – WHAT TIME IS IT?

It's time to see what 2017 has to offer us as traders and investors!

We've started the new year and trading has already been very exciting in various sectors that we at Chartfreak have been looking into.  So 'What time is it?'  It's also time to get on board and make some money in a variety of bullish set ups that are appearing in the markets!  This is a glimpse what we have been looking at lately.


GOLD - I love deep sell offs, because they can lead to strong bounces or recovery.  We were waiting for a close above the 10sma. Some Miners bottomed first, but Gold needed to close above the 10sma to start a bullish move higher.

Read More

Precious Metals – Alive Or Dead?

Precious Metals - Alive Or Dead

I see a lot of people have started absolutely hating Precious Metals and Miners in recent weeks, and that is understandable.  Gold, Silver, and the Miners have taken a dive, especially since the recent Election results in the U.S.  They cannot seem to catch a bid, and each reversal just doesn't seem to stick, even though Oil and Metals like Steel, Aluminum, and Copper rocketed higher. 

We have to ask: Is the Bull dead or Alive in this sector?


Here at Chartfreak, we have been discussing this extensively throughout the past several weeks.  I'd like to open up a portion of the weekend report from Dec 4th, along with a few charts from earlier reports, to show how we have been monitoring these areas.  Enjoy.

As of Nov 18th,  GDX was already at an important Fib retracement of 61.8%, so we looked for the sell off to stop in this area.

  gdx-11-18 Read More

RECALCULATING ROUTE

Have you ever been driving along using your GPS and you decide that maybe you're going to take a short cut to your destination?  The GPS detects that you have left the designated course and immediately needs to compensate by announcing, "Recalculating Route!".  Well last week sectors of the markets took sharp detours right after the elections. Using over 50 charts, this weekend report will discuss the road we find ourselves on now.


SPX - Nov 1st , Expecting a trade-able  ICL, maybe in the 2070 area.


spx-10-31

Read More

GOLD AND THE USD

CAN GOLD CONTINUE TO RISE, SINCE THE USD IS MOVING HIGHER TOO?

.

That question and other ones similar to it keep coming up lately and understandably so.  Gold usually drops when the USD rises, but lately we do see both rising at the same time. I called a low in Gold recently and have been trading in the Precious Metals sector, but some are having a hard time believing it when they see the USD rising too.  Allow me to share my thoughts on this. The following 4 charts are from the weekend report, where I tried to help my readers see the answer that question.

GOLD AND THE USD


CHART #1 -The USD has slowly been approaching the Highs of 2015. The chart does look quite bullish, but it does also show prior lows being taken out and lower highs so far.

  usd10-21w

Read More

Are You Shopping For Your Favorite Miners?

Sometimes it is not enough to go shopping when things are on sale, we all like to get the rock bottom prices. In the Precious Metals sector we caught the lows in Mid January and at the end of May, when they experienced a serious sell off.  Looking for certain signs of a bottom, we started to see it as it was approaching. As you probably know, the Precious Metals sector has again been caught up in a deep sell off.  Here at Chartfreak we’ve been expecting this, as seen in my public posts as well as my premium posts.  I had been mentioning as far back as July and August that we should be looking for a deep correction and then a trade-worthy bottom, likely at the end of September or October.  Will this sell off continue, or are we near the bottom? Lets look at some of the charts from my weekend report and see what we’ve been looking at!  We’ll skip right to the Precious Metals section.

.

 GOLD, SILVER, & MINERS

.

The COT levels are back where they were in May at that Deep trade-able low (ICL), and GOLD is now late in the ‘daily timing’ for a cycle low, so this starts to look good. 

cot-11-14


GOLD – Golds did not have a proper swing low in place as of Friday, but we do see signs of bottoming.  Daily cycles do not extend much further than 25 -30 days, and we see that a low formed on day 25 so far.  That means that Friday was either Day 30 of this sell off daily cycle or day 5 of a new daily cycle and lows could be in place at $1243.20. Follow through higher above 1267.60 places a swing low in place.

gold-10-14

SILVER – Silver has a proper swing low, but it is not really ‘confirmed’ yet. I want to see a break above the 10sma as follow through.

silver-10-14

.

NEAR OR AT THE LOWS? TIME TO DIG DEEPER

.

GDX Looking back to Oct 6th, I started to tell everyone that often GDX bottoms in a way that looks easy to buy in hindsight, but it is NOT.  Look at those May lows. I said that we could see the same type of bottom form around the 200sma, as we saw at the 50sma. It scares away buyers looking for support in that area…

gdx-10-6

And there you go, twins.  Easy to buy, right?  No.  🙂  On this chart I got 1 ‘buy’ signal that triggered Wednesay using an indicator that I developed over time (the lower section).

gdx-10-14


GDX OCT 12th – This system that I developed years ago triggered a ‘buy’ on Oct 12th ( see the lower section).  It is at times scary, because it often triggers before a strong move higher.  In the past it has been very accurate. Again, the progress since this Oct 12th chart is seen on the above chart in the lower section.

gdx-trigger

GDX – This points out that Day 27 was either the low and we saw Day 3 on Friday, or if we drop 1 more time, we extend this daily cycle to the limits.  That in mind, I believe that any drop would be a shake out and then rebound.

gdx-10-14-a

Please recall that back on Oct 6th , I said that $22.08 was a measured move that is possible too, but not necessary.  It also leads to a back test of that orange channel, but notice that we did back test that already in the May sell off. So another quick slam down and recovery is still possible, but that tag of that blue channel is usually enough in a bull market sell off. This sell off should be finishing up.

gdx-10-6-2

I used this chart in a report last week to show that the GDX:GOLD ratio was turning up.  I wrote in the middle of this chart that a cross of the 8sma is a buy for some technical traders, but I find it a bit risky and not a low risk buy when used all by itself. We did not have a cross over yet at that point.

gdx-gold

GDX:$GOLD UPDATE : We got that cross over.  If Gold drops or Miners rise faster than Gold, we get the cross over.  Monday we will look to see if this holds or gives way. 

gdx-gold-10-14

.

EDIT:  This is Mondays chart, the cross over the blue line held and it looks like it back tested. This shows us that even though GOLD hadn’t places a proper swing low in place, Miners are leading.

gdx-gold-10-17

WEEKEND REPORT CONCLUSION: We are waiting for a confirmed swing low and a push higher.  Oil and NATGAS remain bullish,  but I sold my energy positions to focus on the Precious metals.  We are deep into the timing for a low in Gold, Silver, and Miners, and I think that this is where some nice gains will be made next.  I expect a run higher very soon, and I will cover set ups and entries in Miners when those lows are confirmed.

.

Are you ready to go shopping in the precious metals sector? Back in May 2016 at the lows, we entered what I considered to be low risk bullish set ups in VGZ, MUX, and TRX and these ran up 100-250% in 2 months! Why not sign up at chartfreak and add this analyses to your own method of trading. If this run is anything like the run we saw out of the January lows or the May lows, 1 trade will more than pay for your monthly or quarterly membership. In Monday evenings report, I discussed a few Miners that had low risk set ups.

.


Chart Freak Premium

Chart Freak members receive up to 5 premium reports per week covering a wide array of markets, as this public post illustrates.  Come and join the ChartFreak community as we trade the new Gold Bull Market and various trending sectors.

join-now

~ALEX


.

SIDENOTE: BPGDM

 People have asked me, “Does the BPGDM have to drop further like in Aug 2015”? No, not if we are in a re-newed bull market.

In the summer 2015, Miners were TRASHED and the BPGDM was about as low as it gets, then some Miners started to recover before the GDX lows were really in place.  So when we were looking for the LOWS in GDX last year ( they actually came in mid January 2016)  BPGDM was rising, not falling. Some Miners were already being accumulated  BEFORE THE ICL.

.

Look at the MAY 2016 ICL.  If someone says that the BPGDM has to drop lower now, before an ICL can be in place,  then why did it hold up so well at the May ICL?  We are already lower than the May ICL, isnt that enough? We are almost at the January 2015 ICL level  (but we do not have to go there).

.

Currently, the BPGDM has dropped as much as it needs to to remove bullish sentiment. Many people are no longer interested in ‘taking a chance on Miners’.  THAT IS BULLISH.

bpgdm