Precious Metals – Alive Or Dead
I see a lot of people have started absolutely hating Precious Metals and Miners in recent weeks, and that is understandable. Gold, Silver, and the Miners have taken a dive, especially since the recent Election results in the U.S. They cannot seem to catch a bid, and each reversal just doesn’t seem to stick, even though Oil and Metals like Steel, Aluminum, and Copper rocketed higher.
We have to ask: Is the Bull dead or Alive in this sector?
Here at Chartfreak, we have been discussing this extensively throughout the past several weeks. I’d like to open up a portion of the weekend report from Dec 4th, along with a few charts from earlier reports, to show how we have been monitoring these areas. Enjoy.
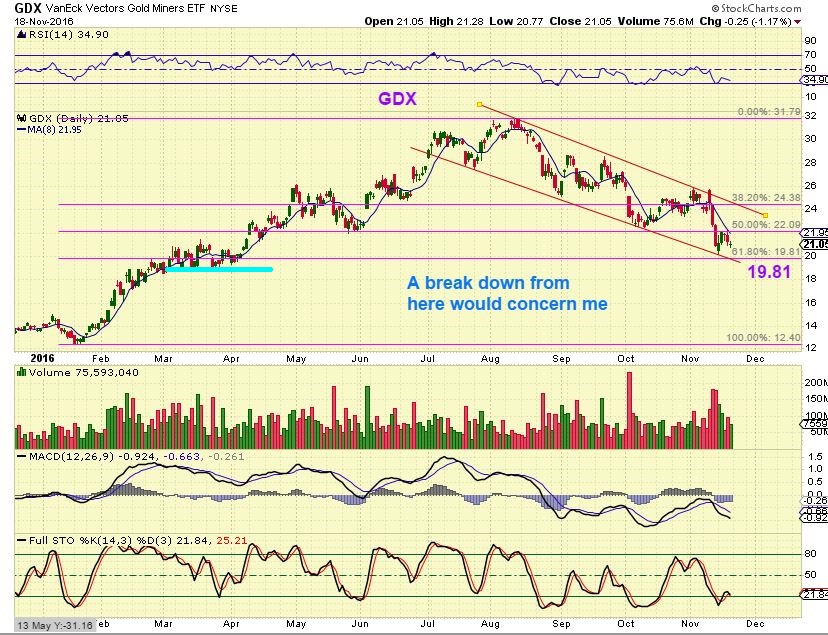
As of Nov 18th, GDX was already at an important Fib retracement of 61.8%, so we looked for the sell off to stop in this area.
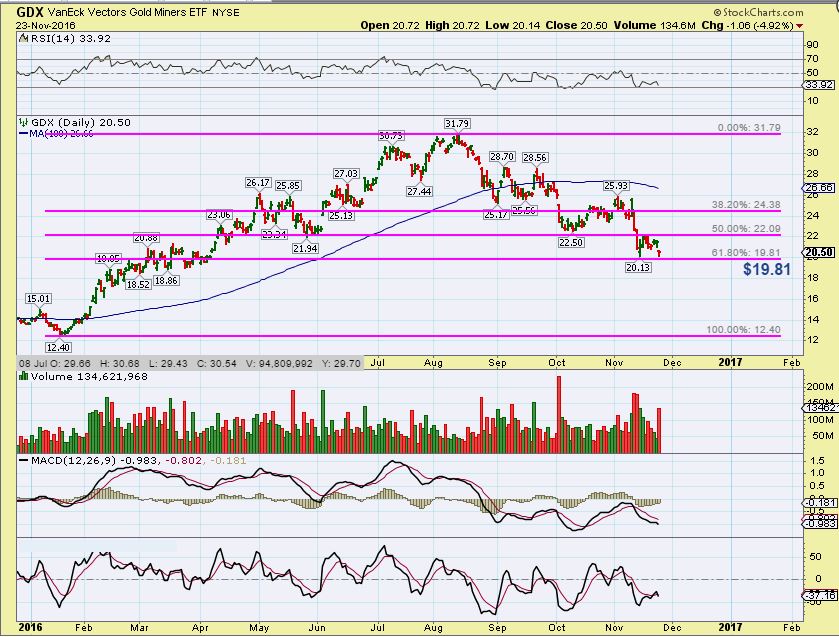
GDX Nov 23rd – A possible double bottom, and I was pointing out that some Miners were actually improving too. I mentioned some that wee not even breaking below their Oct lows, even though GDX & GDXJ had.
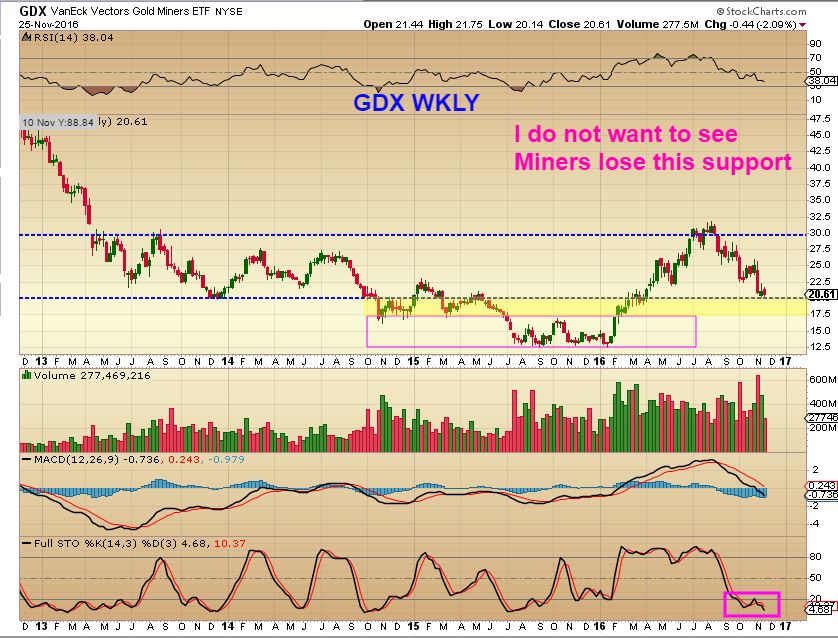
We were watching for a possible shake out below the May lows in early November. I must admit, after the U.S. election results were released, the drop was much sharper than I expected, so I drew this chart to show important support going forward at the end of November.
————————————————————–
ON DEC 4TH, WE CELEBRATE OUR 2ND ANNIVERSARY. THANK YOU TO ALL OF OUR MEMBERS FOR MAKING CHART FREAK SUCH AN AMAZING SUCCESS!
The service has grown tremendously since our launch and I have greatly expanded the content produced for members on a daily basis. We hardly ever run a promotion, but to celebrate our 2nd anniversary, new members receive 10% off their first recurring payment. End Dec 6th – Midnight! See bottom of this post for details.
————————————————————–
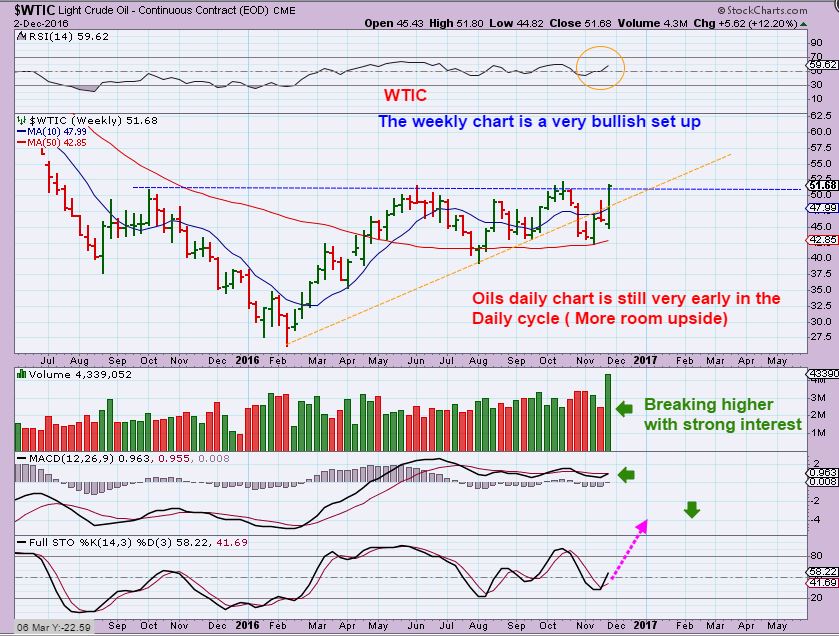
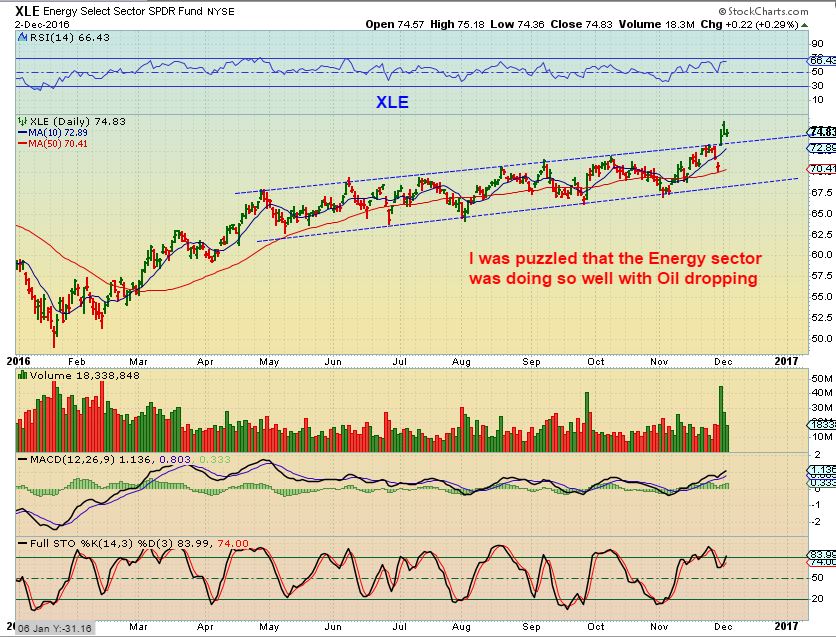
I want to Jump to Oil for a moment, and there is a good reason to. OIL and Energy stocks, along with Copper, Steel, and Aluminum are all taking off higher. Wouldn’t higher prices here result in inflation? And isn’t inflation usually bullish for the Precious Metals? Lets take a quick look at Energy and Metals.
OIL is now a bullish set up, and Energy stocks are breaking out too.
So let’s add charts of Steel and Copper to the mix.
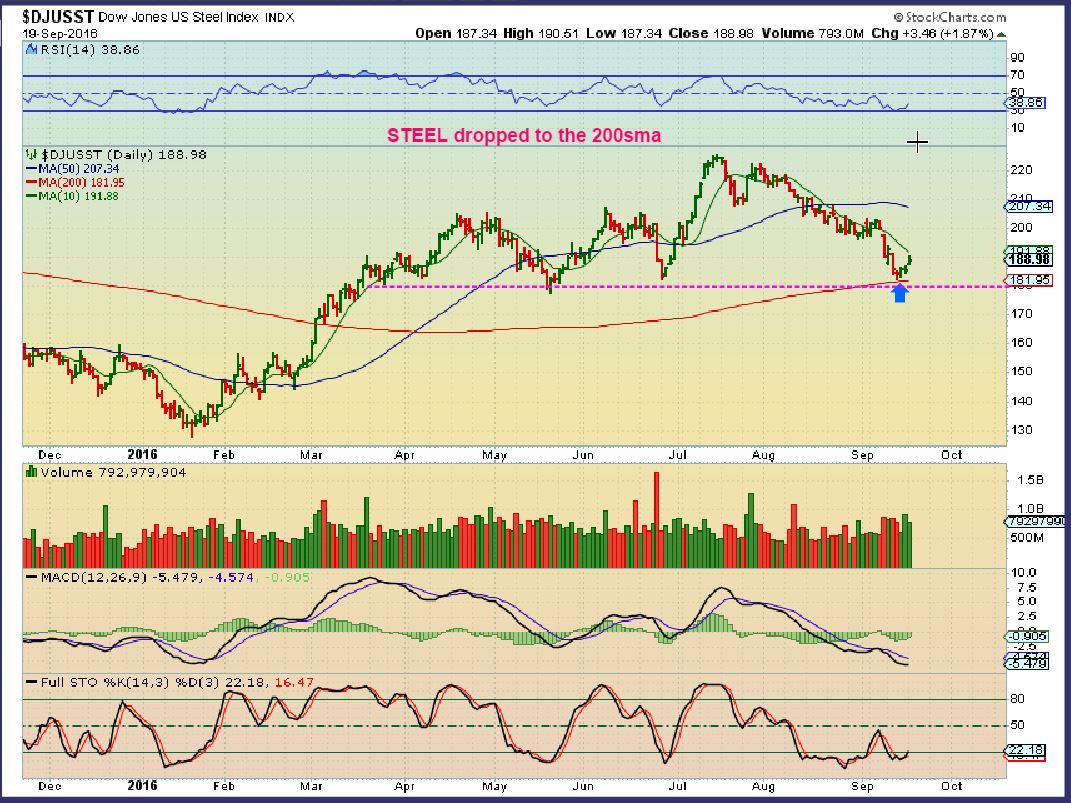
STEEL – I had pointed out in September that Steel was shaping up after bouncing right off of the 200sma. This was Bullish.
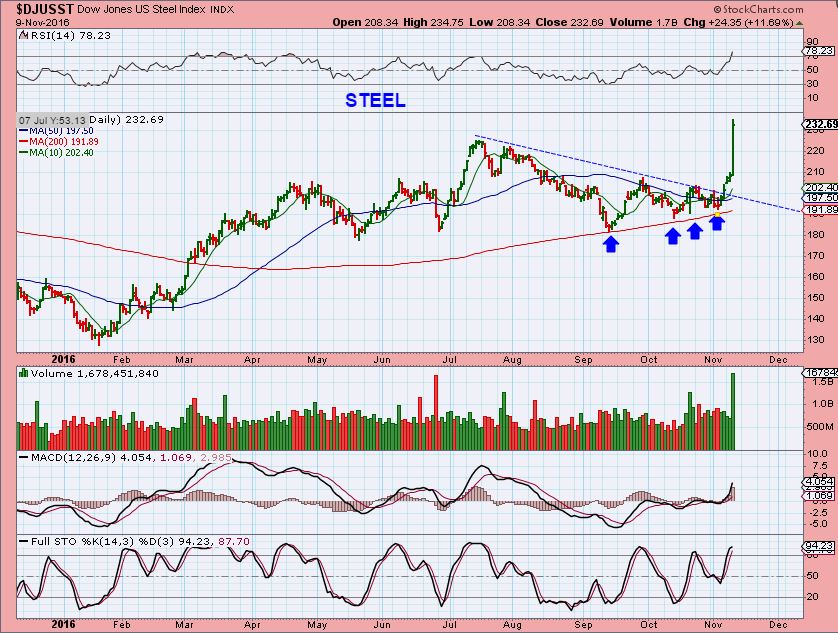
STEEL absolutely took off when Trump was elected. His ideas of rebuilding infrastructure and helping the economy has juiced the metals again ( Steel, Copper, Aluminum, etc). Last week was explosive, with Steel breaking to new highs. We caught these metals companies in the spring using X , AKS, CLF, SID, STLD, AA, FCX, CENX, HBM, VALE, ETC ETC, and then they went into about a 6-7 month consolidation. This is now another area of interest.
A look at COPPER
Pre Election : Copper was trading around $2.10 on the week before the election, and I was pointing out that it was now breaking out at $2.20. I didn’t think that it would absolutely bust out, just that it was bullish.
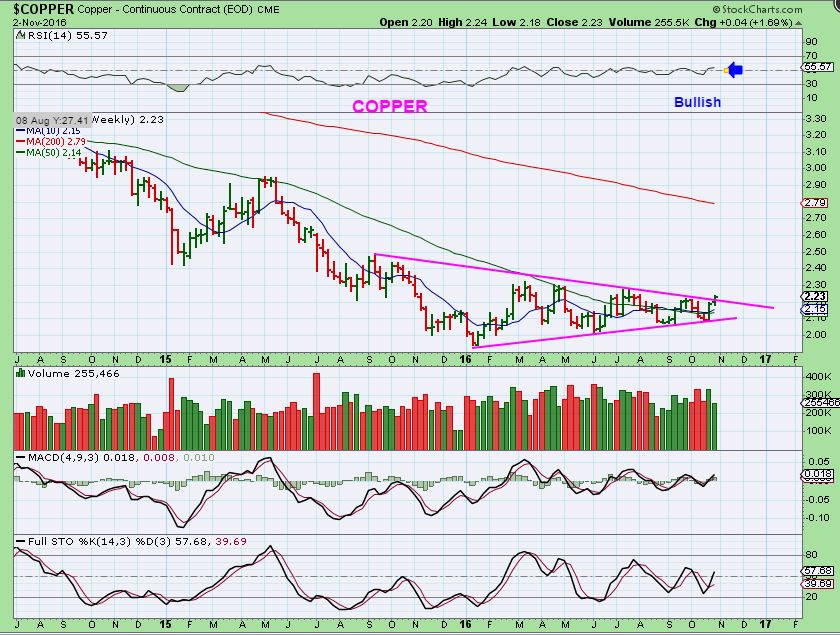
POST ELECTION: Copper hit $2.75 this week! Boom after the election! This is a major break out foretelling much higher prices. Copper is bullish.
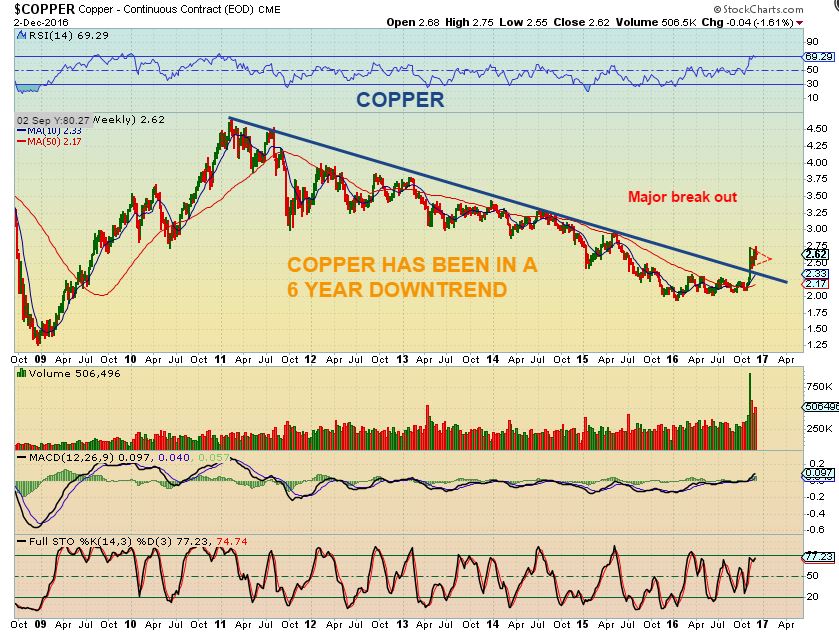
We see Copper move from $2 to $2.75 and predicting much higher prices. We saw Steel take off like a moon shot and now steel prices are quickly on the rise. Is this a sign of inflation going forward? Again, shouldn’t this be Bullish for Gold? When the selling stops and the shorts are forced to cover, will we see GOLD & MINERS Shoot up the way Copper and Steel stocks just did? Time will tell.
GOLD & MINERS
I expect a bottom soon, and it should be a good solid trade able low. After an ICL, we should see weeks of trading where those lows are not broken, and I would expect a good solid rally when the shorts start to cover and buyers step in. Whether Gold remains in a solid Bull market or a we see a multi week Suckers rally remains to be seen, but we’ll be analyzing and discussing that as time goes on too.
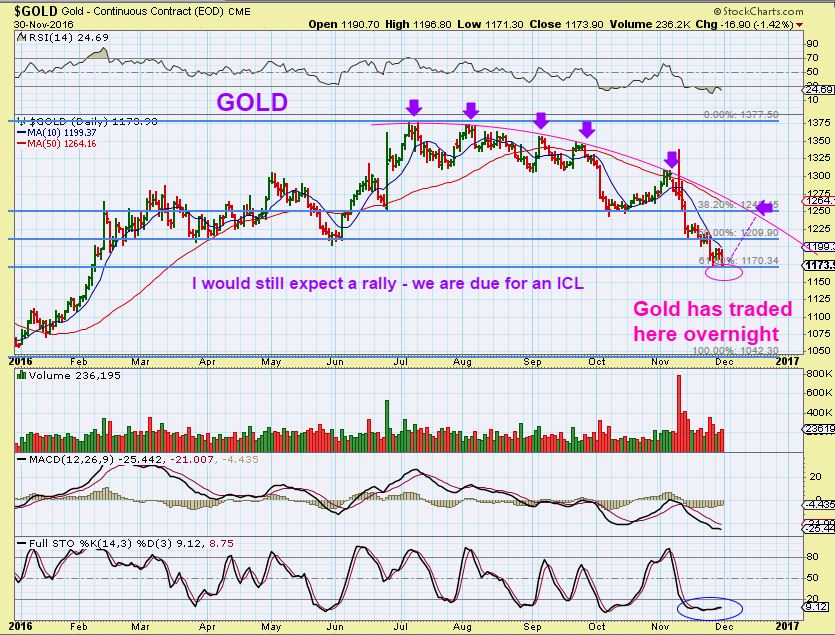
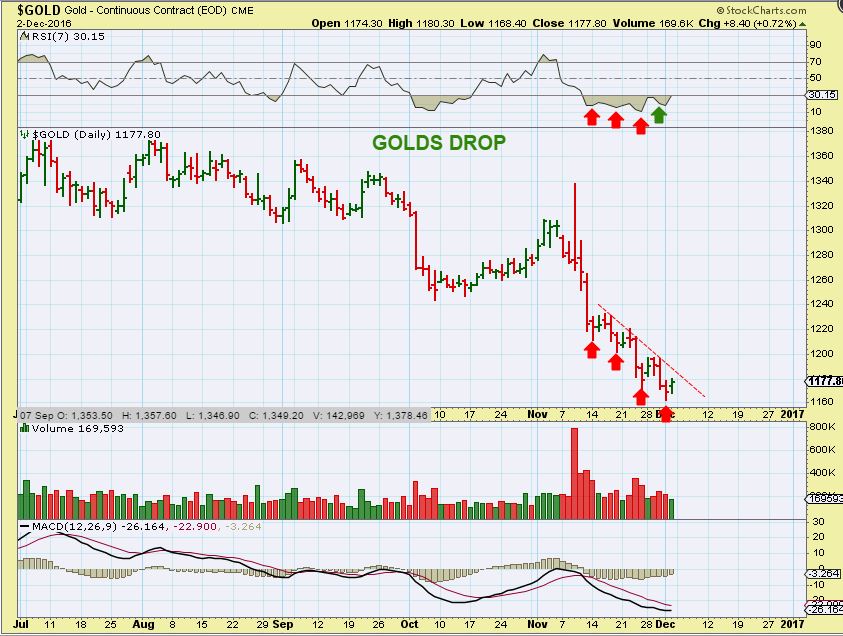
GOLD – Last week I posted this chart to show the 61.8% retrace was hit near Nov 30. I’m expecting an ICL ( intermediate cycle Low) and a rally soon. Note: Even bear markets have rallies out of their ICL. Then we will monitor that rally as it unfolds. See the chart for a minor target.
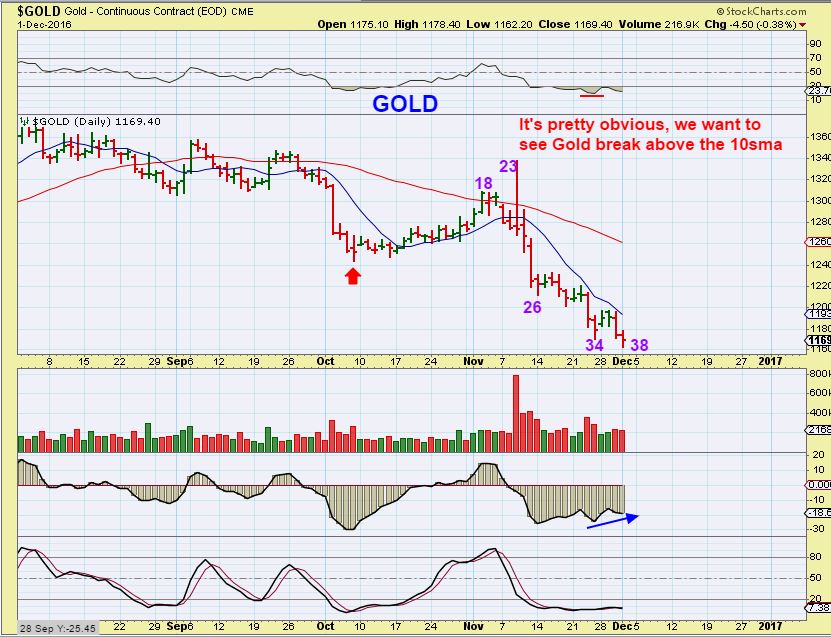
GOLD – Thursday was day 38 with a new low, so Friday should be day 39 and we are overdue for an ICL. This should also be a yearly cycle low. If we prove to still be in a Bull Market, gains out of this low could be huge over time. Remember last January – May?
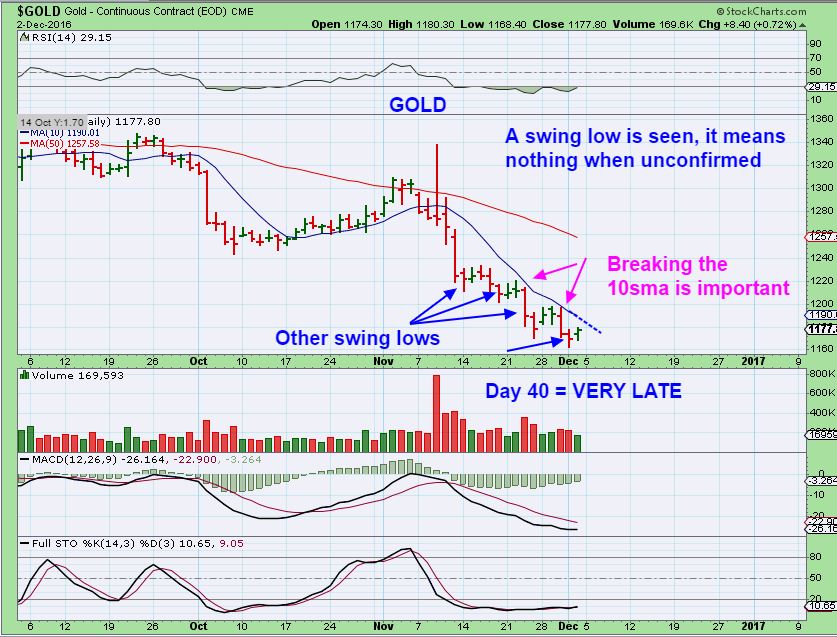
GOLD FRIDAY – We see a swing low (Unconfirmed), so this could be day 1, or day 39. Monday would be day 40 if we make a lower low.
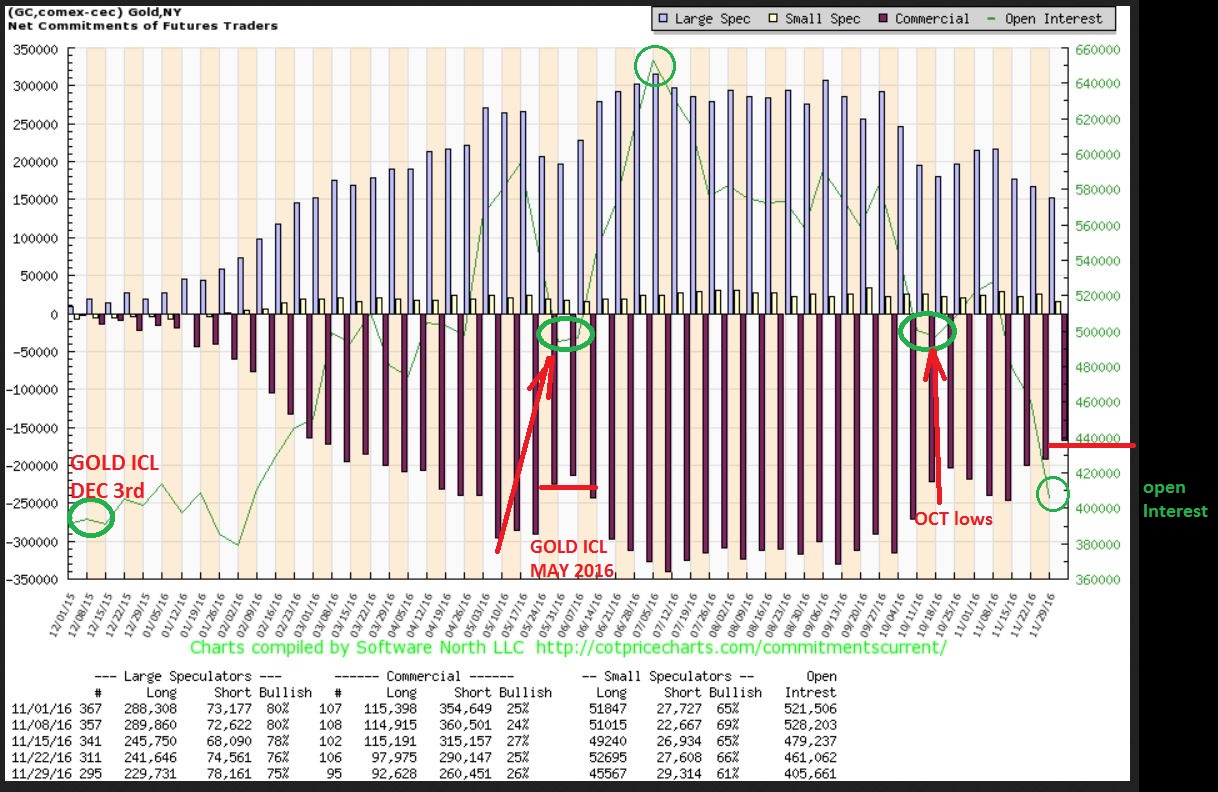
The C.O.T. has a very encouraging Open Interest reading. This is very bullish, but I don’t use C.O.T. readings for “timing’ of lows.
GOLD – We see the RSI 7 here showing divergence at the recent new lows, for the first time. This is Bullish for Gold. We want to see follow though above the 10sma to add confirmation of our new swing low.
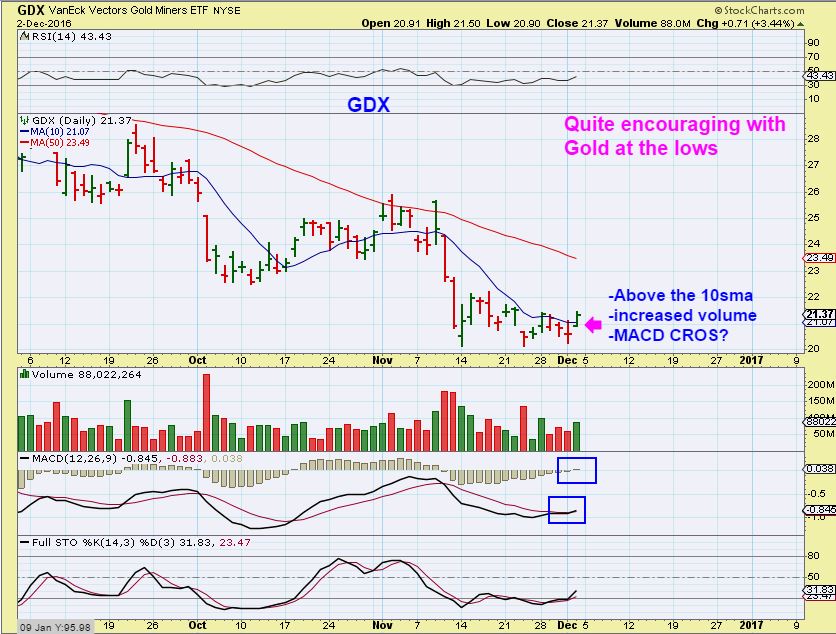
GDX – The GDX did close above the 10sma , this is a positive note for a swing being in place. GDX is still very oversold and the MACD is crossing higher. This is a buy signal for Miners and they have room to run.
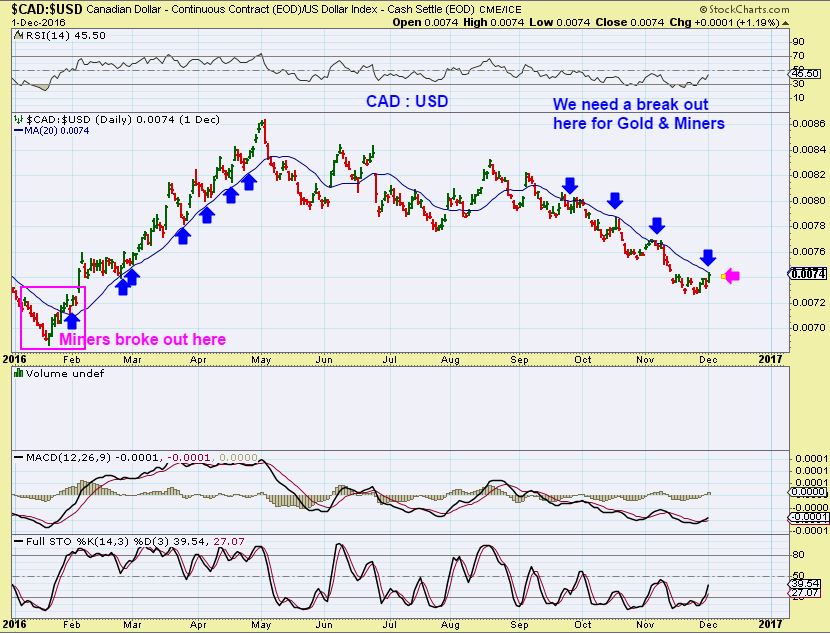
The chart of the $CAD VS $USD was used by me at the 2016 lows. I found this to be a bullish confirmation to Gold and the Miners break outs. This was my Feb 4th weekly chart from an early Feb report.
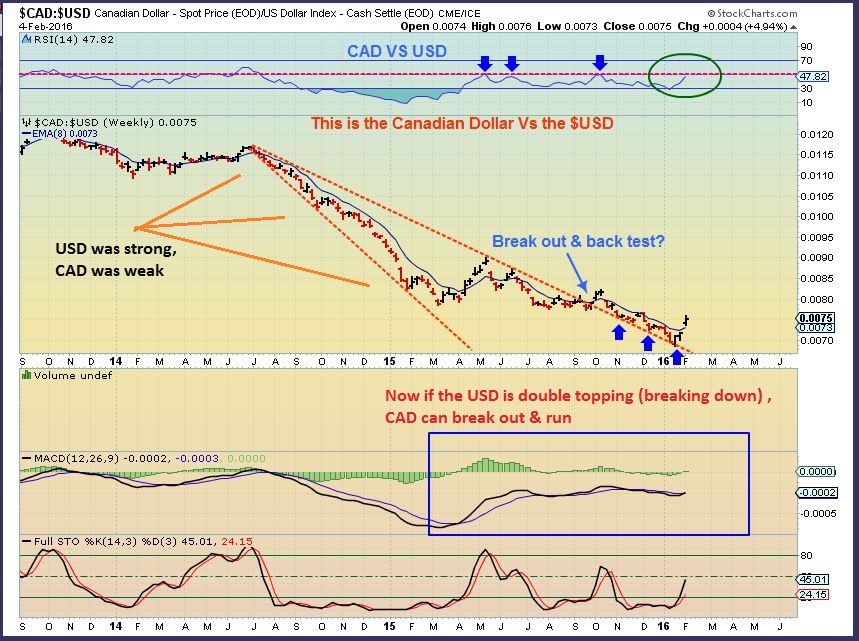
I think that the USD is due for a pullback. Lets look at the current CAD : USD Chart.
Notice that when this broke out above the 20ma in Jan 2016, Miners broke out (see the chart). Price then climbed up that 20ma as support into May. Now notice the struggle at the 20sma currently, but we look like we could break out this week. This is Bullish for Miners.
This recent selling has been a deep Sell off , difficult for long term investors to ride out. Many are giving up on Gold , Silver , and the Miners.
Take a look at this bumpy ride in 2007. We repeatedly saw ( blue arrows) a drop, a bounce, then another drop to new lows, then a bounce, followed by another drop to new lows, etc. Tiring! Ugly! Frustrating! Brutal! Each time new lows were produced, I’m sure that you can picture the screaming, the fear, and the loathing. Who wants to buy with all of this choppy action into July & August lows in 2007?
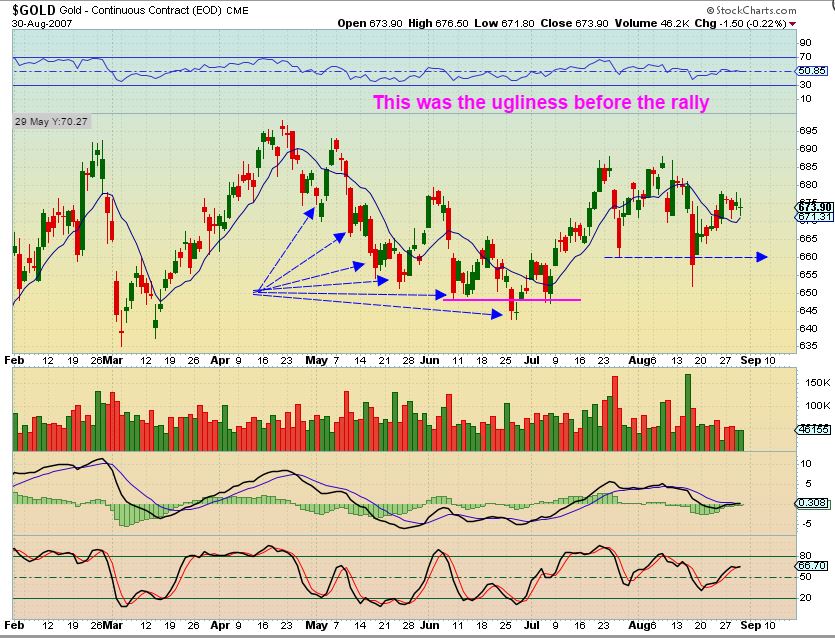
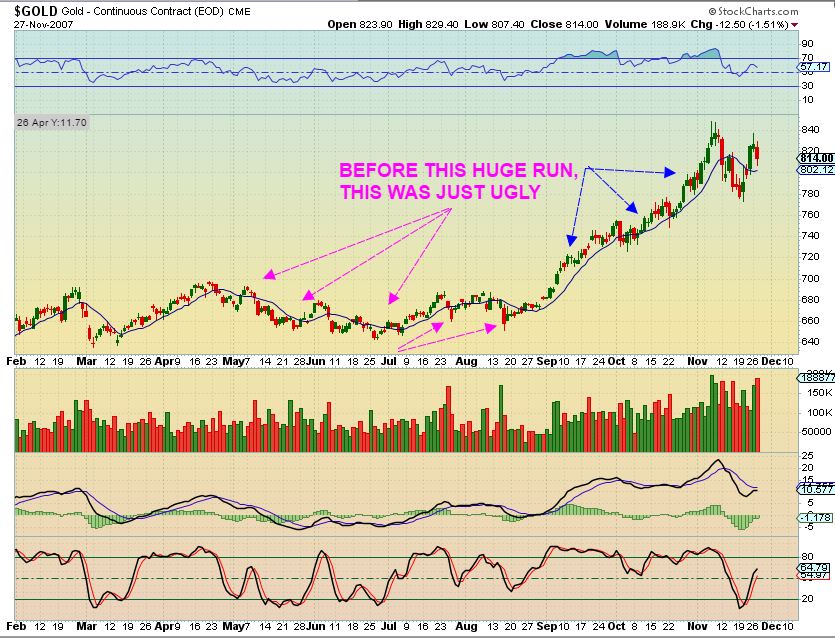
Look at July – November 2007 – In hindsight, it doesn’t look bad once that rally kicks in. The Bull ‘consolidations’ and ‘sell offs into ICLs’ always buck off riders at the lows. They always change sentiment from bullish to doubtful. People HATE miners at the lows. When everyone is afraid to hold on or get back on, they get left behind. Again, look at the rally that followed from July to November after that bumpy ride.
So I am expecting an ICL in Gold ( A deep tradeable low that should hold for weeks without being broken) . Looking at Steel and Copper, I am hoping for that type of reaction higher, but we’ll have to let Mr. Gold tell us what will happen. Miners look like they may be leading the way, because not only do we finally see a GDX close above the 10sma, but we see several individual Miners not even breaking their Oct lows, and now they are moving higher. If Gold sells off Sunday after the vote in Italy, I think that the downside is limited. If Gold takes off higher Sunday night after the vote, we are probably looking at our ICL last Thursday. The Miners are ignoring Gold more and more, I think that the lows and some good %-Gains are right ahead. Enjoy the rest of your weekend!
~ALEX
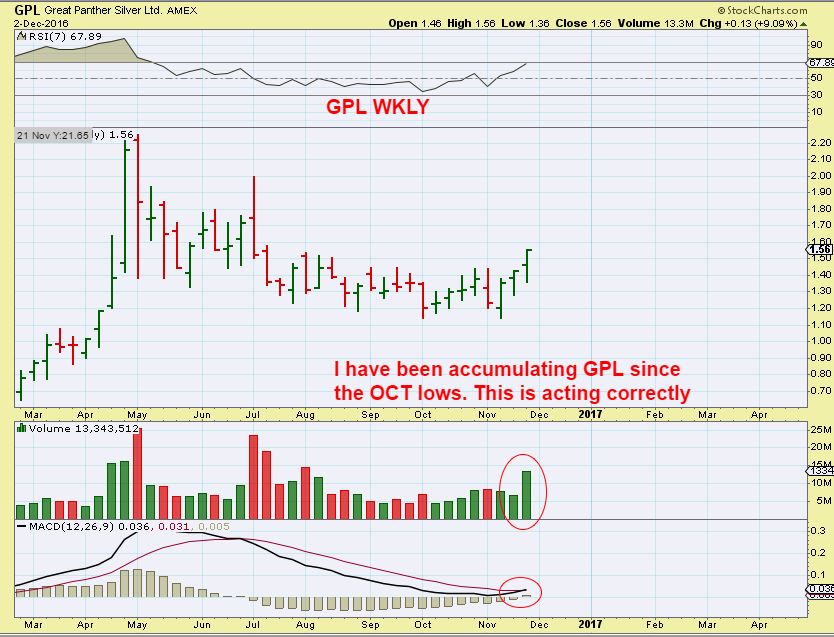
Final Note: As reported in the weekday reports, GPL, AG, PAAS, SA, GORO, SAND, KGC, etc. etc. daily charts look like they are starting to move.
GPL WKLY – I have been pushing this one for weeks. Now the weekly chart is really looking bullish. It closed at the highs last week and the week before, with Silver getting sold off.
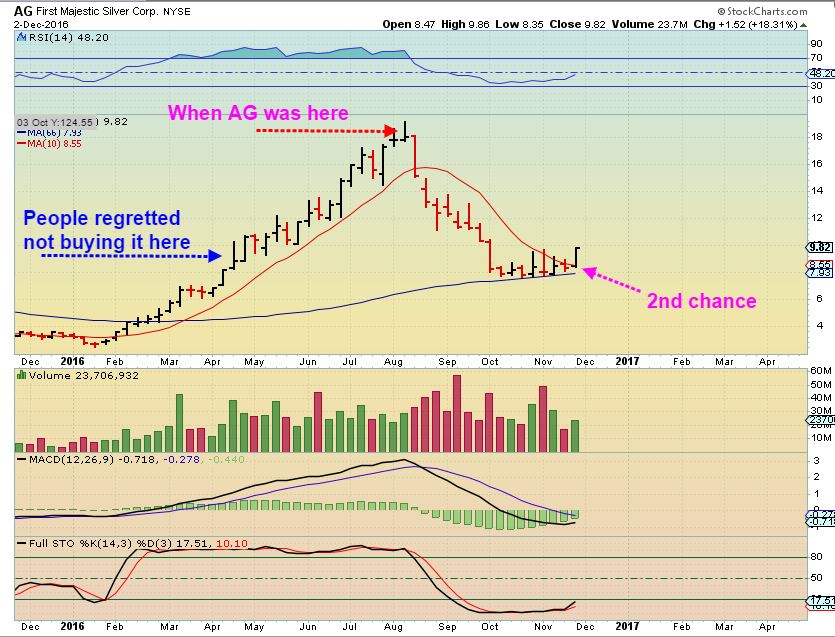
AG WKLY – $2 to $19 in 2016? Wow. When it was at $19, people really wished they bought it below $10. It has now run up from under $8 to almost $10 – while Silver got slammed.
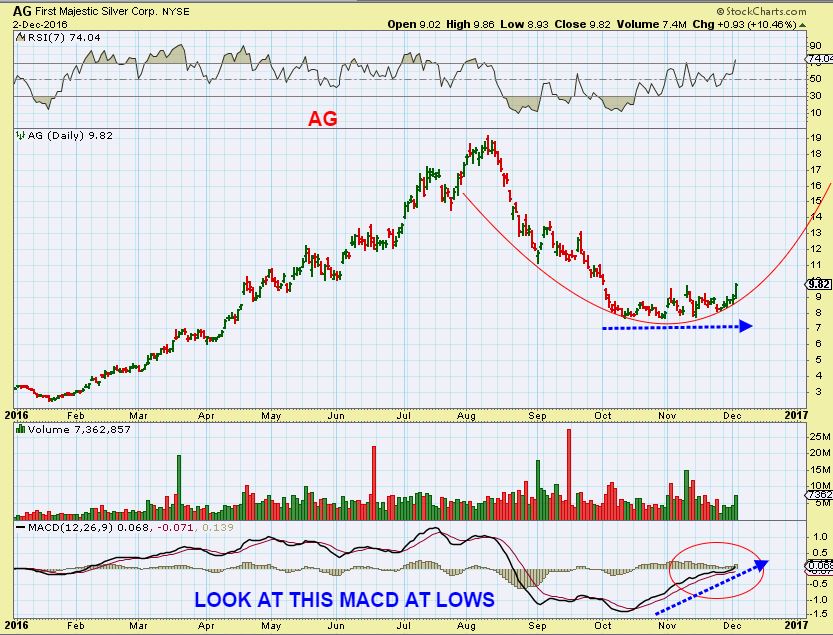
AG DAILY – What a beautiful chart, really. I can picture an inverse H&S forming in the coming weeks, and then a run to back to the highs if this bull remains in tact.
Certain Miners are ‘buys’, and we have been covering them in midweek reports. While Gold keeps making new lows, some Miners ( Like AG and GPL shown above) are looking more like they are being scooped up and accumulated. We will continue to look for opportunities as they arise in the coming weeks with Energy, Metals, and Precious Metals.
-SALE-
THE SERVICE HAS TRIPLED IN SIZE SINCE LAUNCHING AND ALEX HAS GREATLY EXPANDED THE CONTENT PRODUCED. THEREFORE, MEMBERSHIP RATES ARE GOING UP AN AVERAGE OF 15% ON DEC 7TH. LOCK IN THE OLD RATE TODAY FOR LIFE, BEFORE DEC 4TH. AND TO CELEBRATE OUR 2ND ANNIVERSARY, GET 10% OFF THE FIRST RECURRING PAYMENT TOO.
Chart Freak Premium – Limited time promotion.
Chart Freak members receive up to 5 premium reports per week covering a wide array of markets, as this public post illustrates. Come and join the ChartFreak community as we trade the new Gold Bull Market and various trending sectors.

Weekend report – See No Evil 
 Looking For A Little More Traction
Scroll to top

Just got back from lunch to see a happy surprise. I started the day down 3% but now am up 1% – good, if not great.
Several of my stocks are now on a daily and weekly buys. TLT is green, FXC on daily/weekly buys and above its 50 dma and close to its 50 wma, YCL up, and GLD is moving up to the upper trend line of the long triangle from 11/9. GDX(J) are green as is JNUG. These are all very positive signs after we had a nice Friday. This is not a blast off by any means (my three best stocks are AUMN, HL MUX all up 3+%), but a happy sign. Alex’s triangle below has extended up the upside as I am sure he expected.
I have to admit, I thought with the dollar dropping like this, I thought miners and gold would be screaming higher? pretty muted so far.
Thanks, Bill. I forgot to mention the buck. I agree golds are muted. As I posted below, my acct was up 1%, but it is currently up .3%. Not what I was expecting or hoping for.
Dang I wish I never sold HBM! Edit: I guess there are two tickers for Hudbay Minerals… apparently there is a plus version?
The 10 dsma held it all the way so far.
Also … there goes VGZ!
LoL that was some timing… i was just mulling over whether to buy it back at $0.88.. and thought well may as well cuz thats what i sold it for..
then within seconds of my buy.. it shot up to +8% ($0.93) 🙂
Thats a “gold rush” of another sort!
i’ll have to check my minute chart for ‘frisky VGZ’
Well done on your timely buy! My VGZ is still in the red but it is making good progress!
I was just going to mention that pop in VGZ- look at a 1 yr chart, that looks seriously good 🙂
It regained the 200sma and the 50sma
The week ending in 11/4 saw a run up of 19+%, then it pooped out on us then next Thurs. I am close to being green after a long time. Then, again, it ran from .80 to $2 in June! Now my trick is to figure out how I can distinguish between the two so I don’t go back into the swamp. 🙂
May lows was an ICL . That June run brought VGZ closer to a top,
Now we ahould be at an Intermediate bottom again.
You have the odds in your favor this time, watch it over the next 2 daily cycles 🙂
Thanks. If we don’t get an immediate turn down, I have a clear exit on my daily chart in June. I would end up getting out on 6/20, back in on 6/22, and finally out on 6/30. What concerns me now is that VGZ is holding up my acct today. Will the rest of the golds get going. Less than half of my golds are green and GDX just turned red.
beautiful BCEI!
problem is.. dont know when to sell these energy beasts.. just when you think theyve topped out, they jump up another 10%
At the top of the current wave 3…. 😉
Very nice. I dont see a reason to sell this unless they are BK and this is short cover.
I havent read anything fundamentally about them
If was a BK case, and this pop was short cover, I’d maybe sell a portion if the position was big. If it’s not big, I’d probably let it ride a bit more. They can get explosive.
i didnt go mad on the purchase size,… kept it small for that very reason, with everyone here (well, one or two) warning of possible BKs.
but i do have quite a few of them ie.TPLM LGCY BCEI EVEP SXE
That small bag of rocks could become a nice little stone collection over time 🙂
AUMN is getting ready to break out strongly higher I.M.O.
but I own it, I may be biased 🙂
Go AUMN team!
you’re sounding like Bob Moriarty 🙂
TGB … got it in my basket.. though is it gold, silver or copper?
copper…but they have a promising gold holding that caused a big climb when everyone thought it would get approval….but it got stopped from going forward by opposition and TGB crashed some years back. If ever they could get approval…pshew, up it would go.
Thanks Nancy — I figured copper was behind this move 🙂
NOG is starting to move higher too, back above the 50sma
I am posting this here before Tweeting it out soon. I figure that I’ve talked about it here enough over the past several weeks, but it really showed strength with the Gold sell off.
No guarantees, but it looks set up nicely ( barring any dreaded public offerings! ).
.
Refresh
.
https://uploads.disquscdn.com/images/94c2a652776f931f639b64d989f37d3cc0dfe4965a280c06ea52b3c4480ca44e.jpg
GPL only seems to do good when Silver is down – lol
GPL & TRX … at different ends of the scale, are spoiling my green list
same… buttt .. it’s ‘roughly’ 400% just to the ‘3rd’ or “C” wave … and that’s if it doesn’t extend.. ;O)
for TRX….
i dont own GPL
ya gotta chart for that? TIA 🙂
I was looking at the potential upside too.
Even back to the summer highs alone is a couple hundred %
well.. im sitting here comparing ‘3rd’ wave potentials… saying .. sorrrry Mux.. ur only projecting 143%.. gotta trade u in for …vgz – 232%..jnug – 600% lol…. nugt 575%…. guesssssss THAT would make it worth the wait… ;o)
c’mon Bull ……………… as Nike says … Just Do IT
you calculating fibonaccis?
yes… 1.618% of “1”
As long as you
‘Don’t count your money,
when you’re sittin at the table.
There’ll be time enough for countin’
When the dealin’s done’.
yes daddy.. i know.. i hate to even talk out loud… just sayn… i am projecting downward moves as well…lol.. buttttttttttt … as Maya said… “Hoping for the best, prepared for the worst, and unsurprised by anything in between.”
Ya know what, I just bought TRX recently as a ” it must be at the lows, looks like a 100% upside move possible, should be sitting on support from May and June and look at THAT run that it makde after that,etc etc ”
So far, not so good, but this chart is showing a bullish pinch. I should have bought the break out when it comes, but I’m going to hang on for a bit to see what happened
.
No Guarantee in the markets, but at an ICL, this could do well.
.
https://uploads.disquscdn.com/images/854acc4eae8701f1fc438d87b4ede15aa8e034f9c8da3c97813e324579eaea45.jpg
Alex this might be a repeat question, but what’s the best way to buy breakouts? Do you buy when retest of breakout occur or buy when you see volume is surging and stock is about to breakout?
As a “trader” I approach it a few different ways.
If I see a break out , often I wait for the back test, but if the sector looks really strong, I might buy a little , and if it pulls back to ‘test’ that break out and holds, I add.
I also watch a cup & handle form, you are supposed to wait for the break out from the handle. I often BUY the handle with a stop below and try to get in ahead of the move,
And yes, If I see a stock approaching a break out point and volume is swelling, I do get in before the break out, and sometime sell 1/2 after the break out in case of a back test. Sometime just let it ride, because I got in low and the back test still wont take profits..
It’s a good question, but for me everything has become “Situational” in my trading based on past experience, more of a principle than a rule. We all find our own style over time. 🙂
Thanks Alex. This helps.
Not sure what just happened to AUMN?
But we don’t like it!
I tweeted out the AUMN chart, and someone tried to add 100,000 shares and hit sell instead.
They’ll buy it back before the close : )
(Just kidding)
it looks like an expanded flat correction,, following the earlier impulse higher
What the heck just hit AUMN?!