Precious Metals – “Oh My Precious”
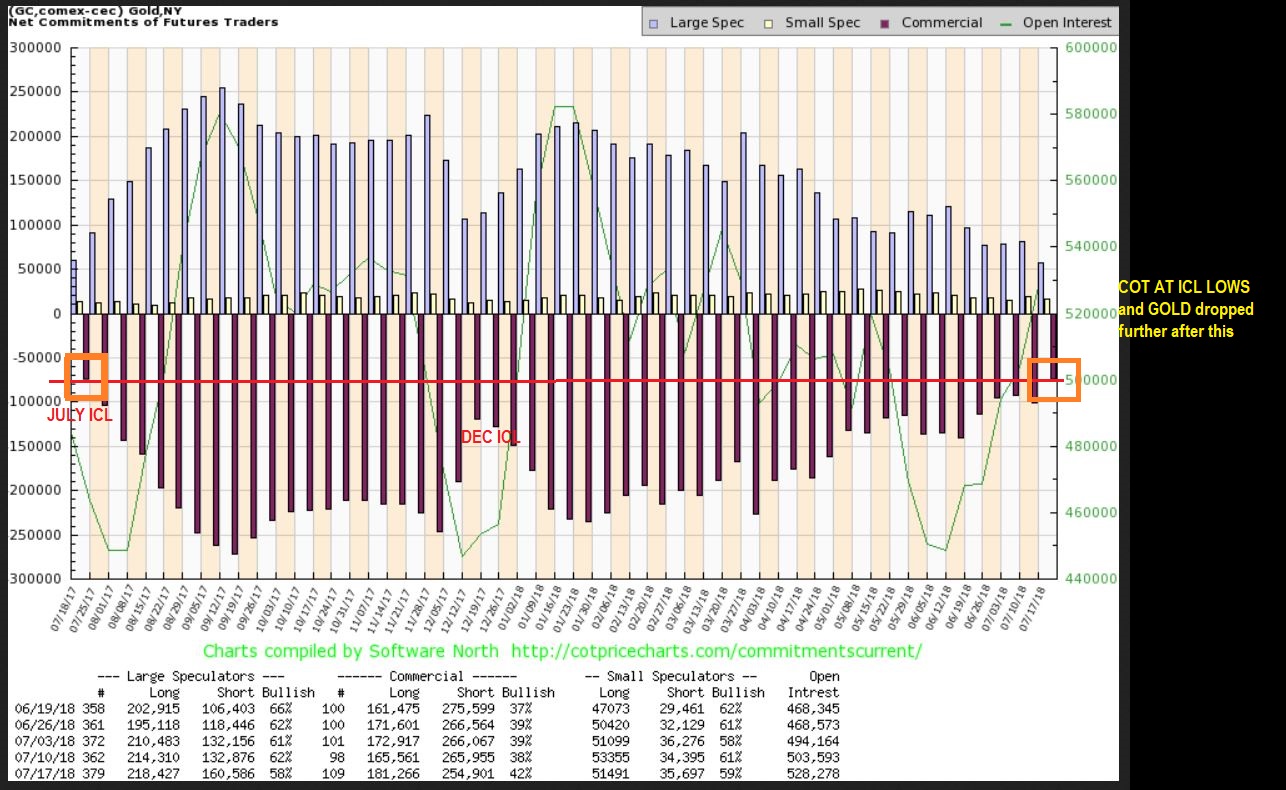
Let’s take a look at Precious Metals
(Below is a sample of Alex’s work from the week)
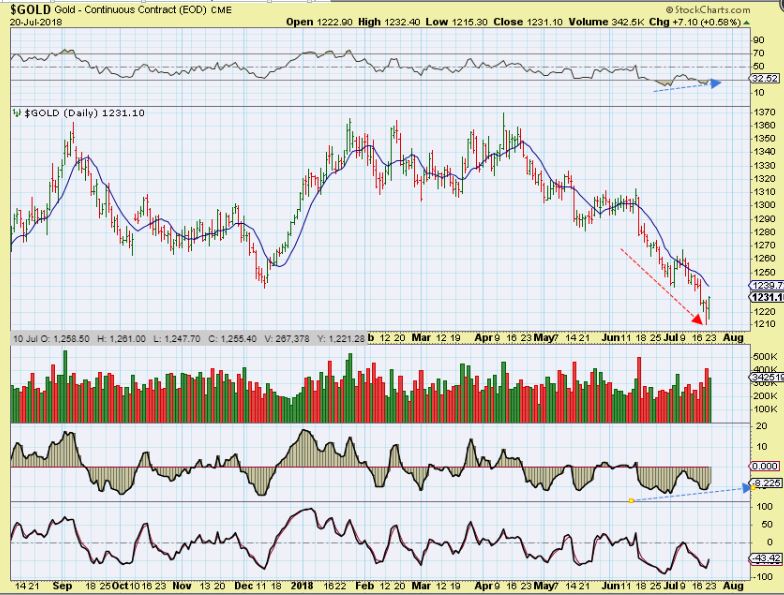
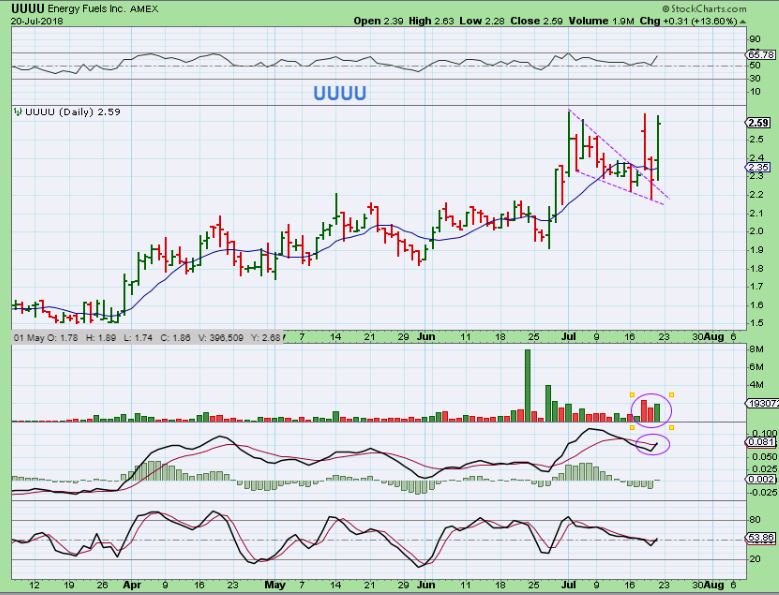
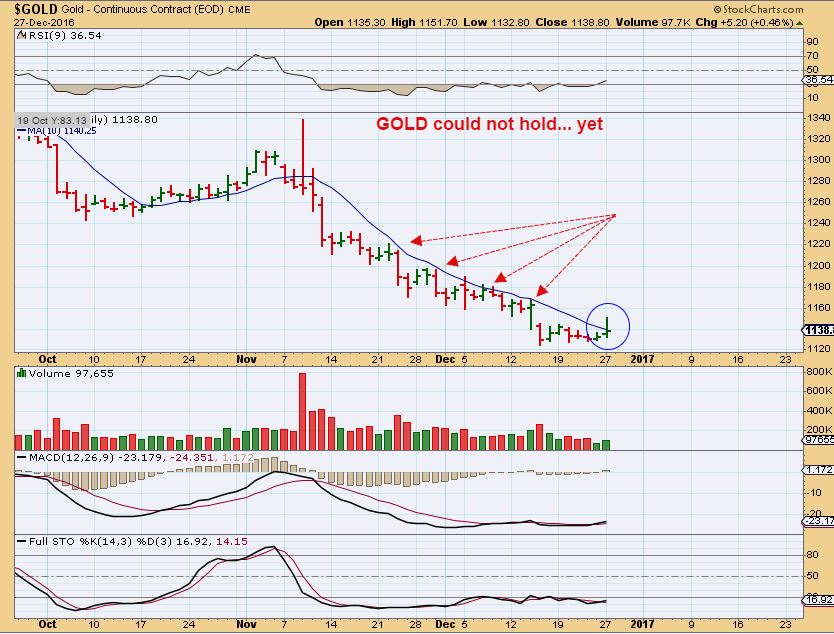
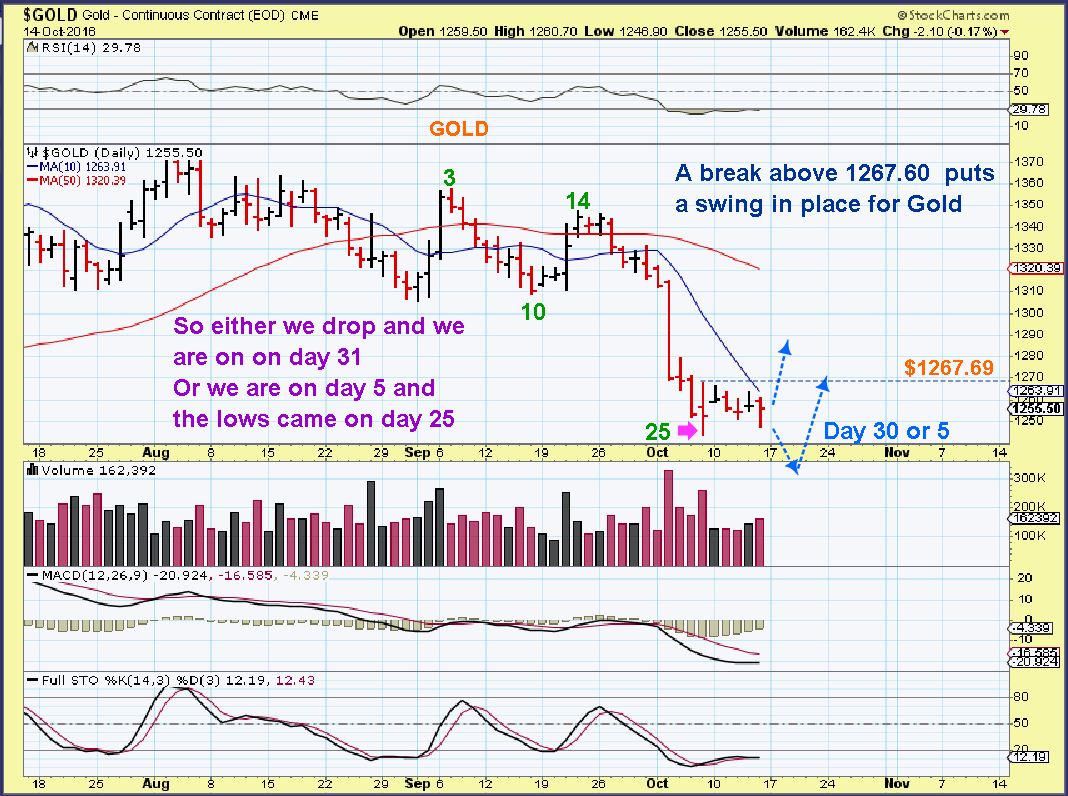
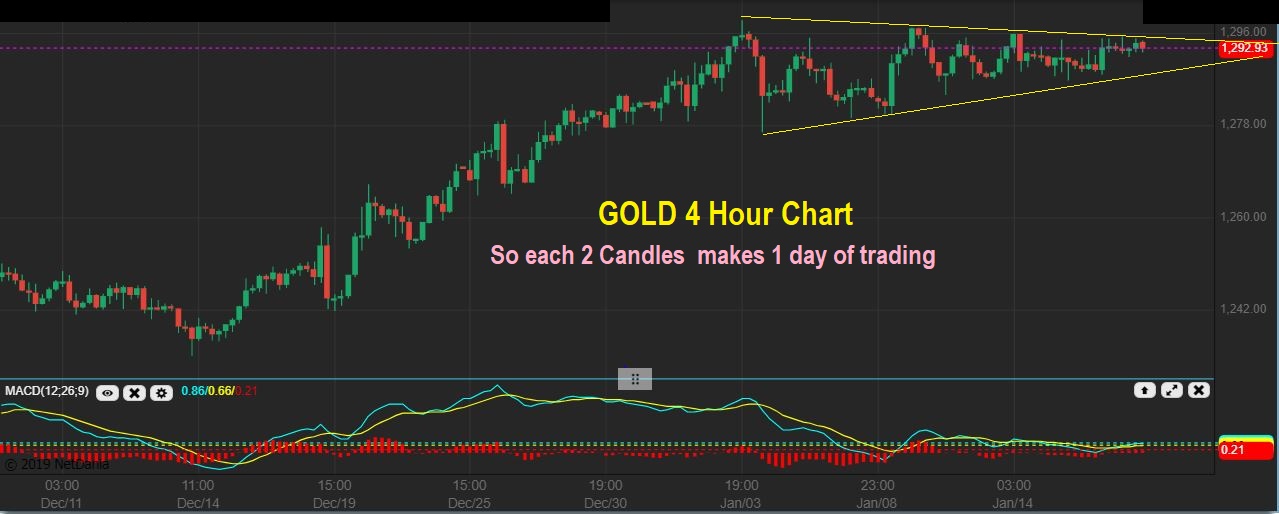
GOLD – I posted this in the comments, just showing how GOLD does not want to sell off, it has formed a triangle so far.
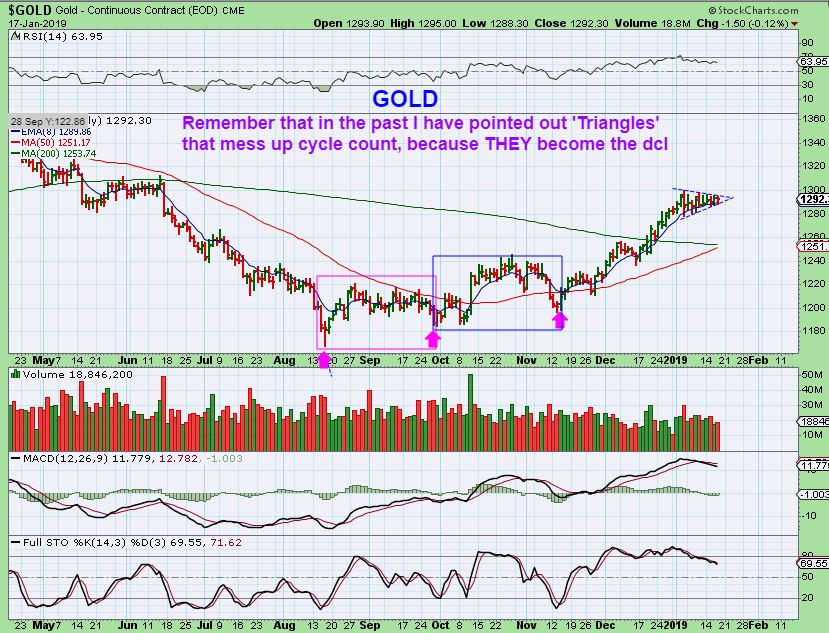
GOLD #1 – I have stated in the past that ‘TRIANGLES’ usually mess up daily cycle counts, so I just focus on what is in front of me. At this point, it is a Bull flag chewing away at consolidation on the far left ( May / June trading). I would have expected a back test of the 50 & 200sma, but so far it just wont sell down.
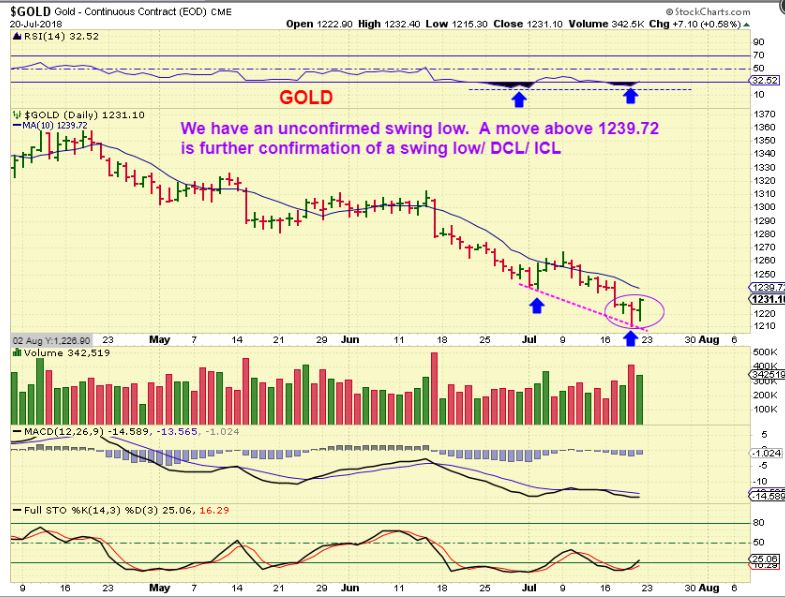
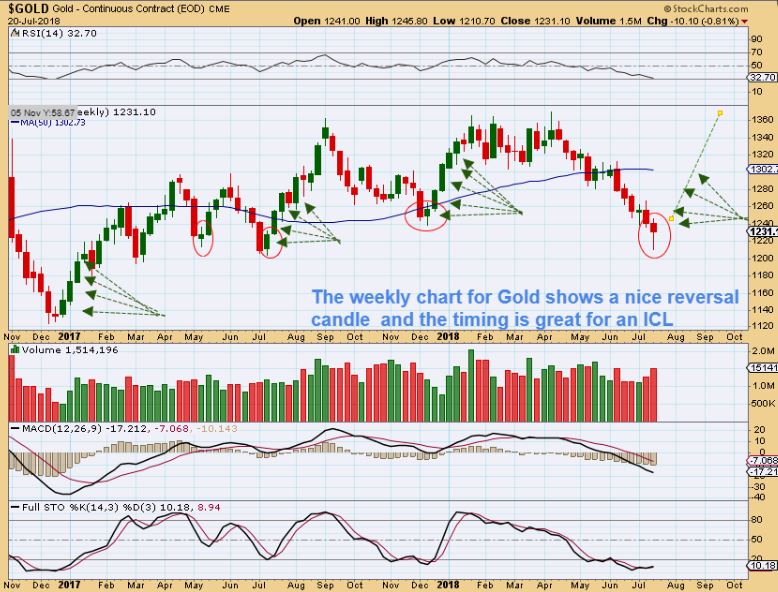
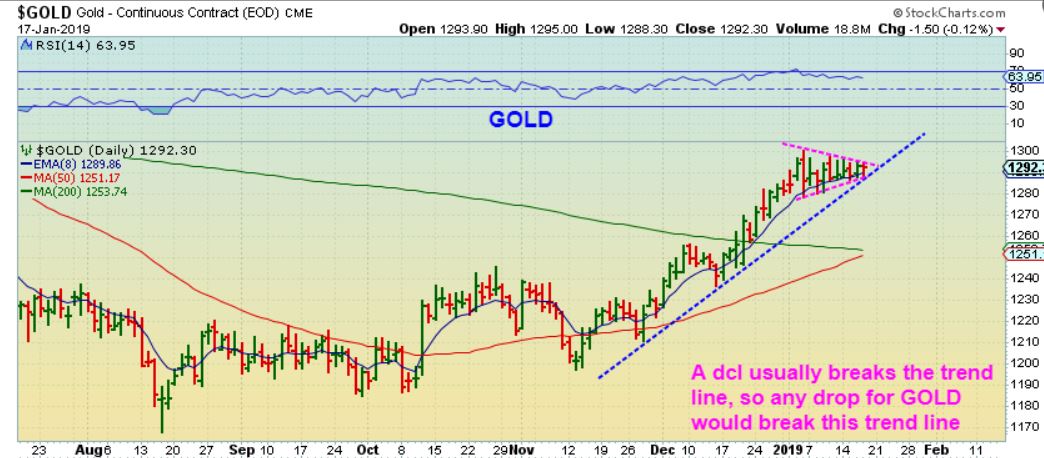
GOLD – We are in the APEX, so this has to break up or down now. Breaking down would break the blue trend line, and usually that is what we see as a dcl, so look for a break of the blue trend line, and a reversal higher may indicate a dcl. Honestly though, I ignore cycles when triangles form & Bullishness persists.
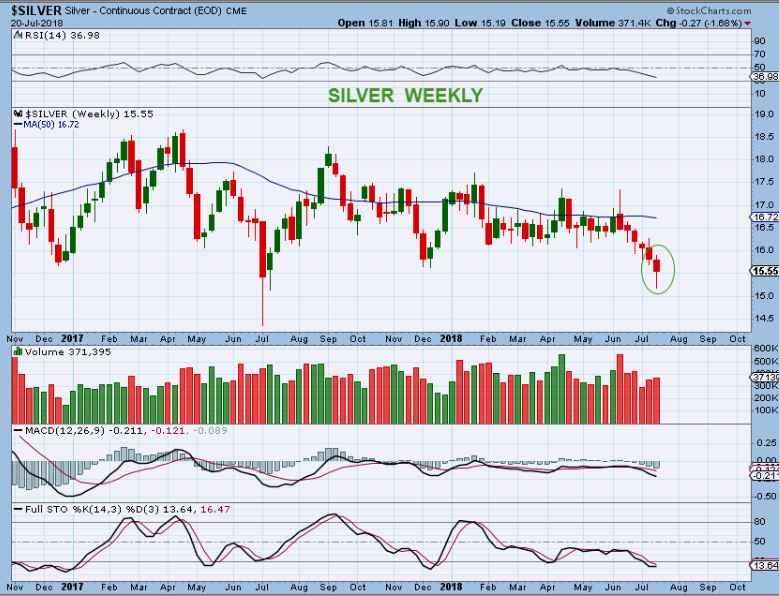
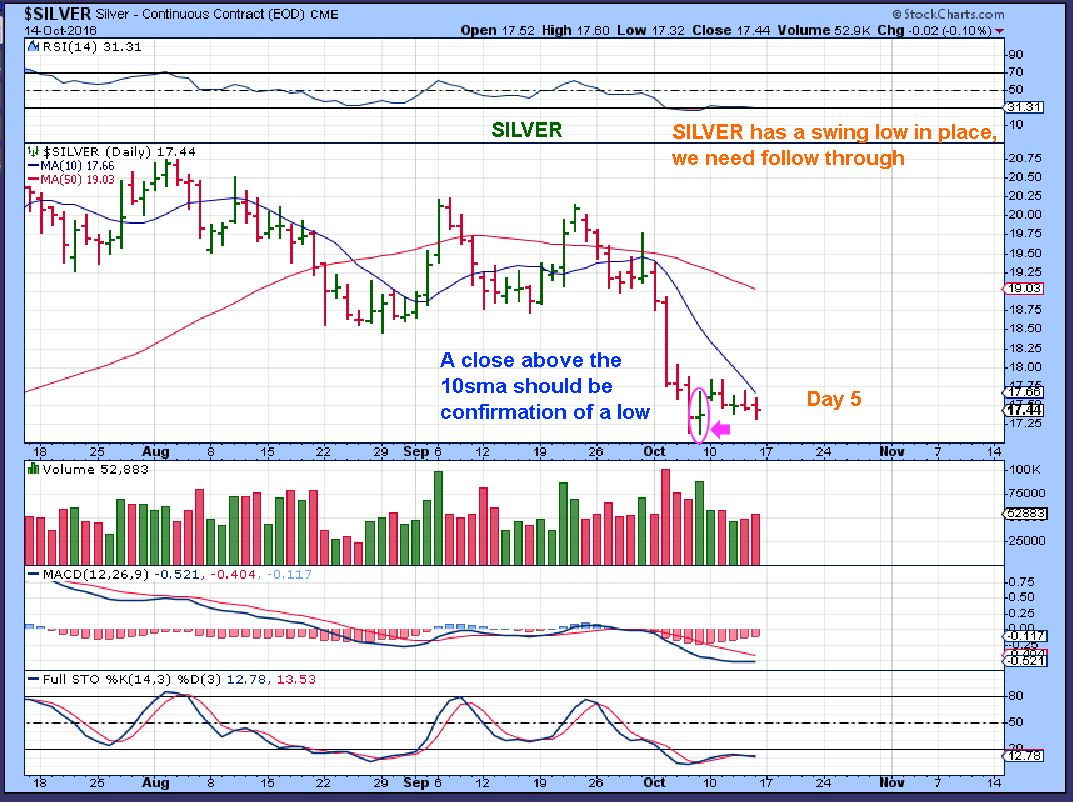
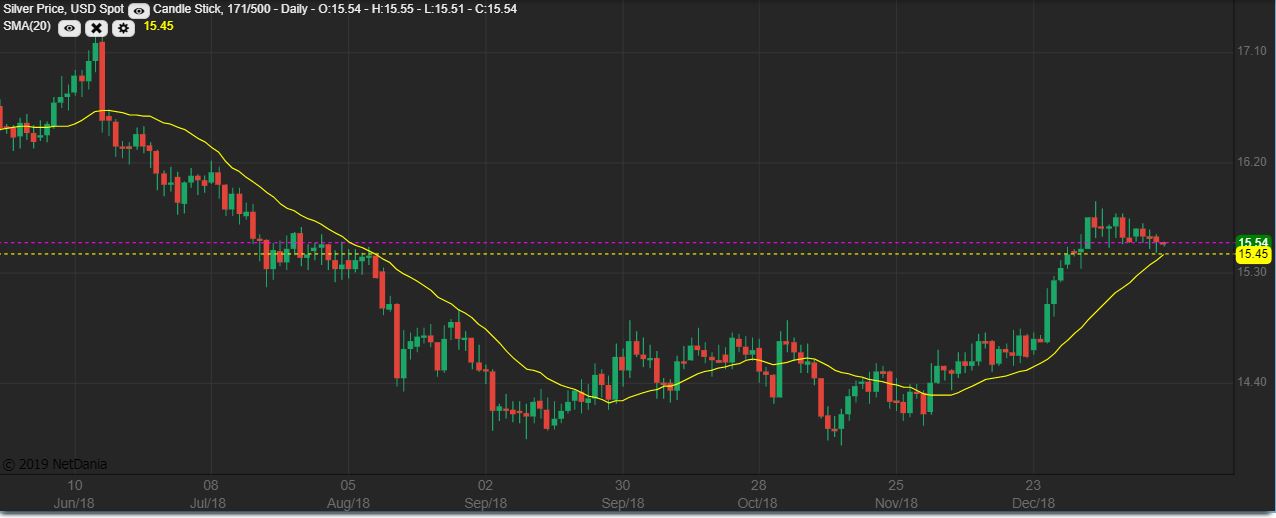
SILVER 10 sma – Silver broke below the 10 sma, but it also looks like a bull flag, so…
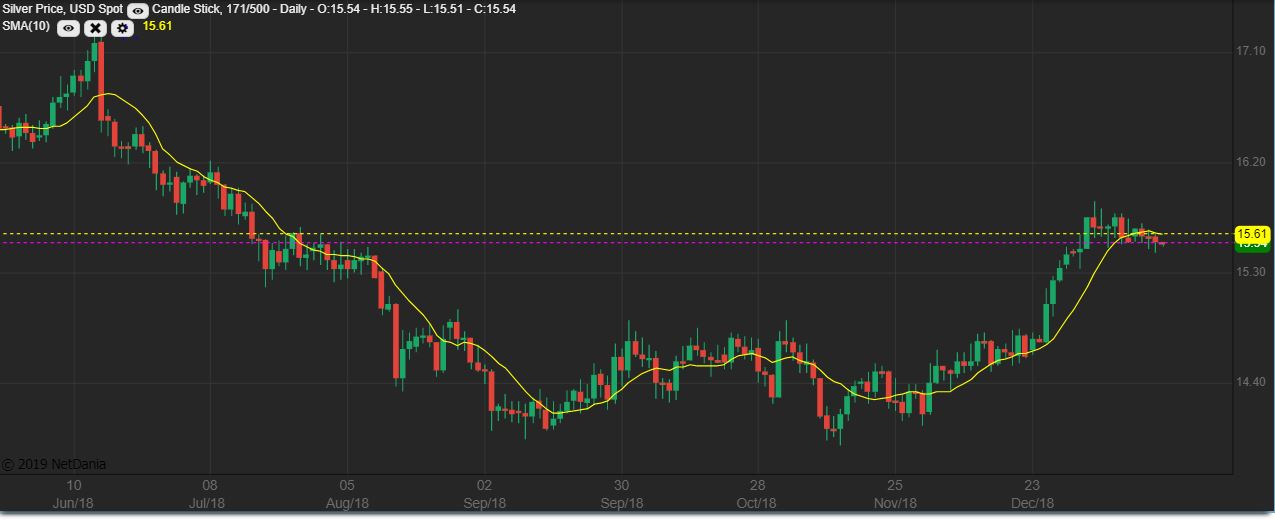
SILVER 20 sma – Let’s see if the 20 sma acts as support, price did not break the 20sma on the run higher in November.
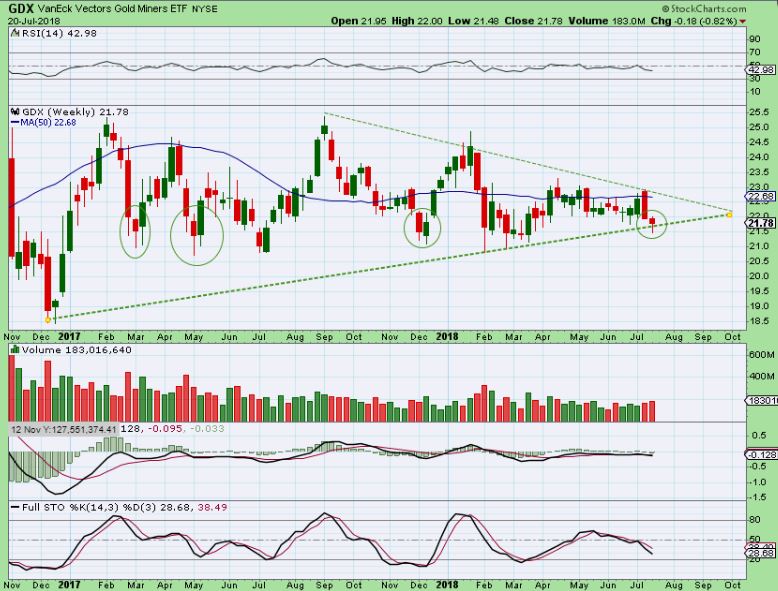
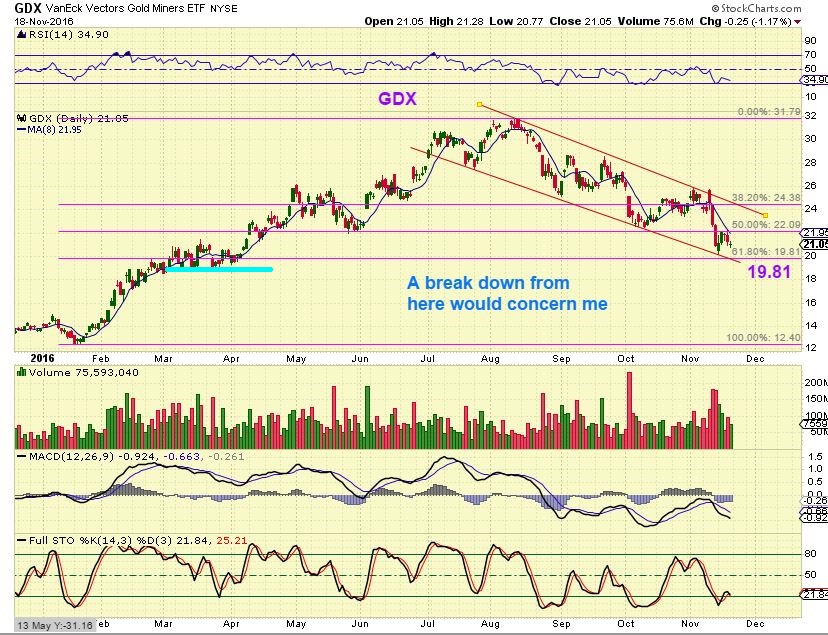
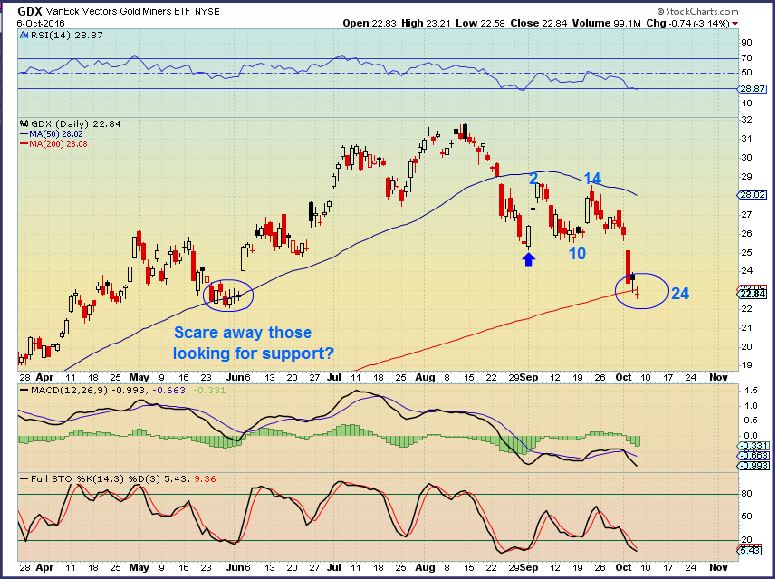
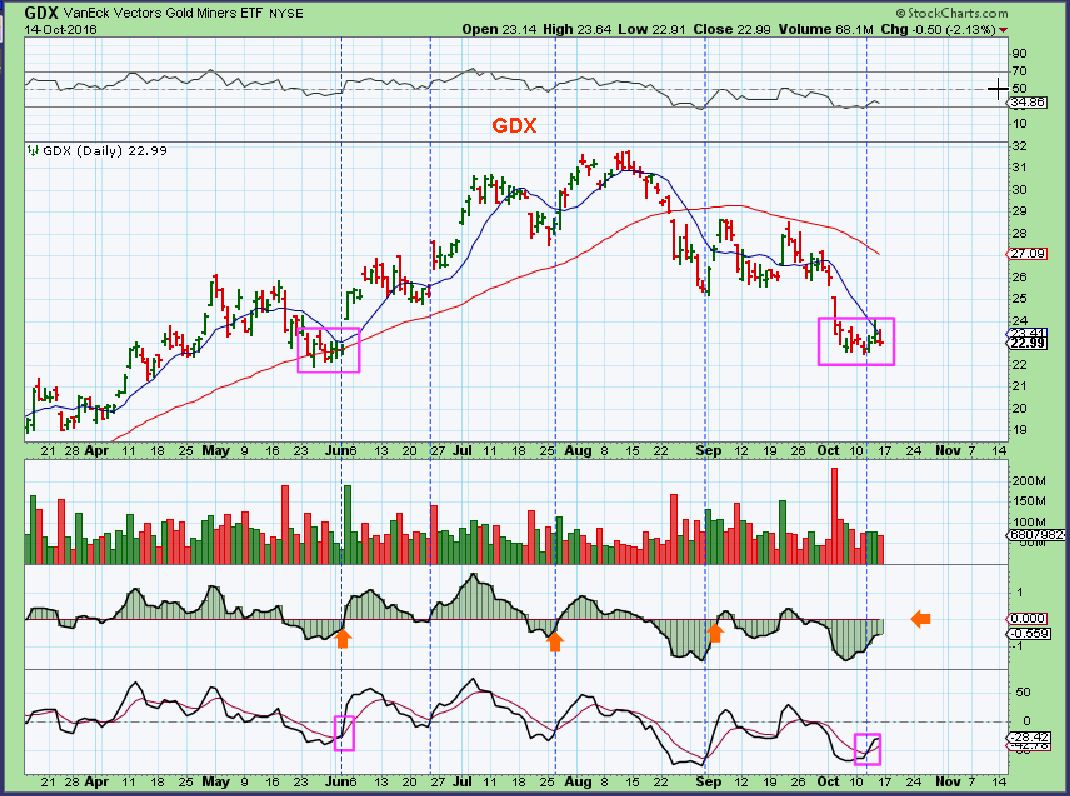
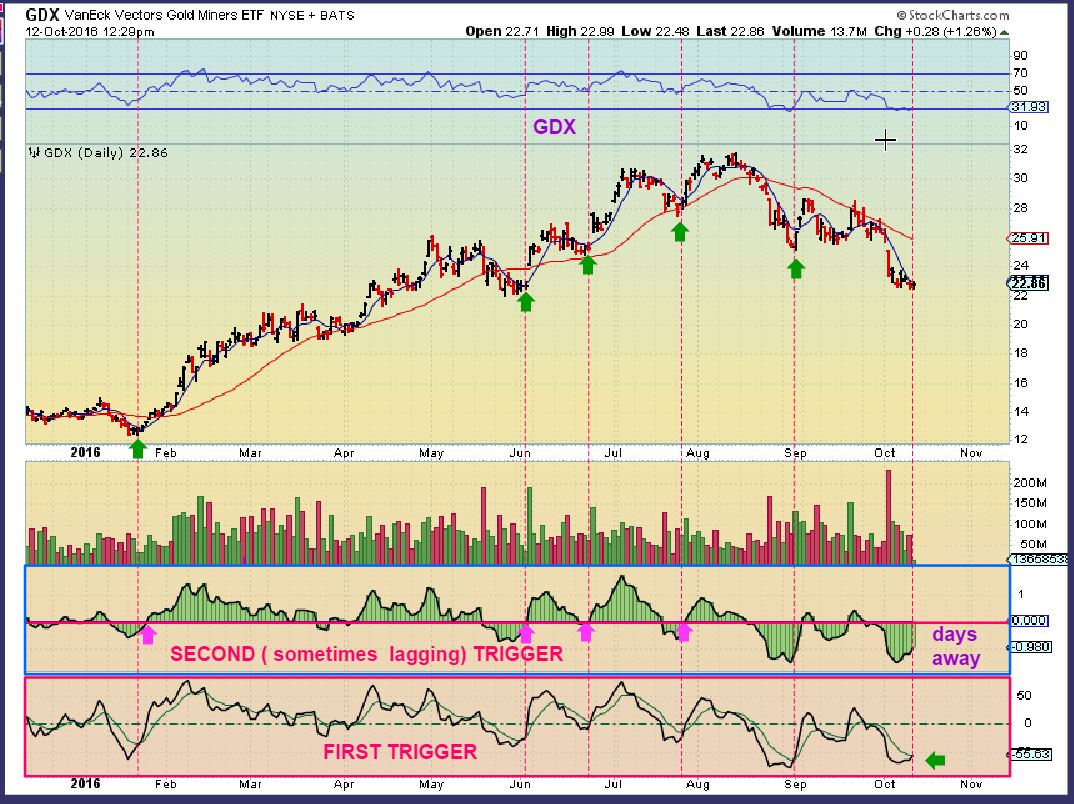
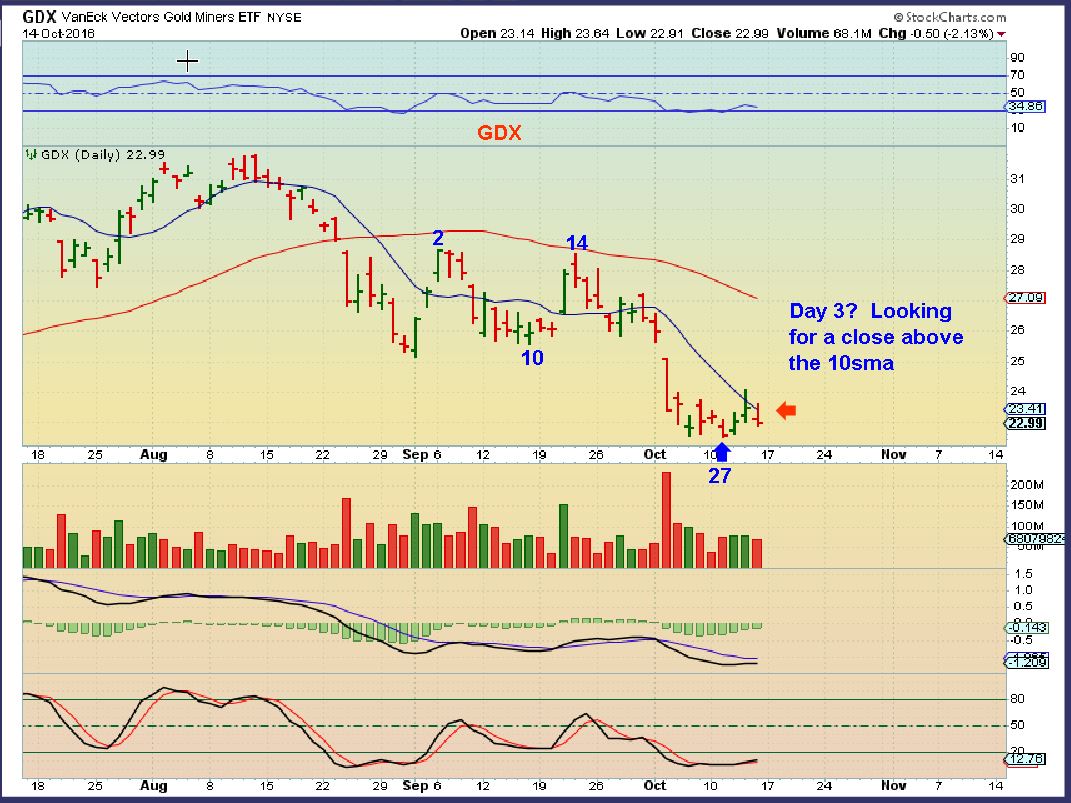
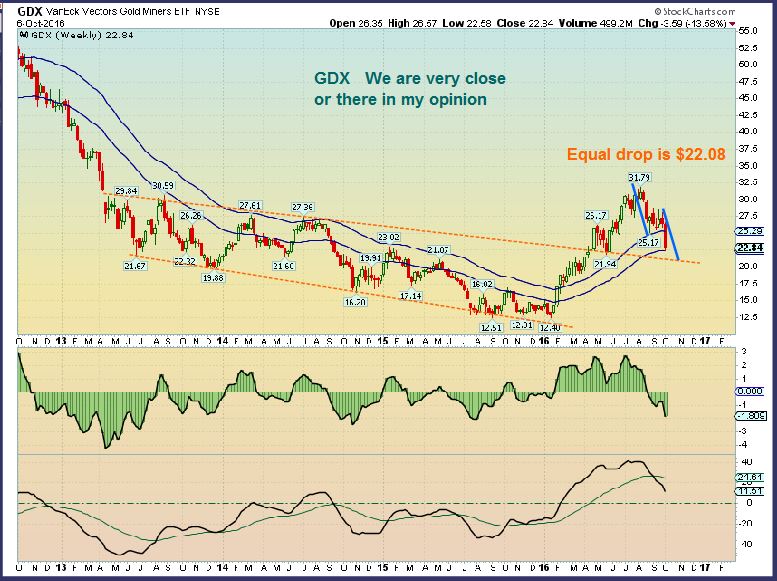
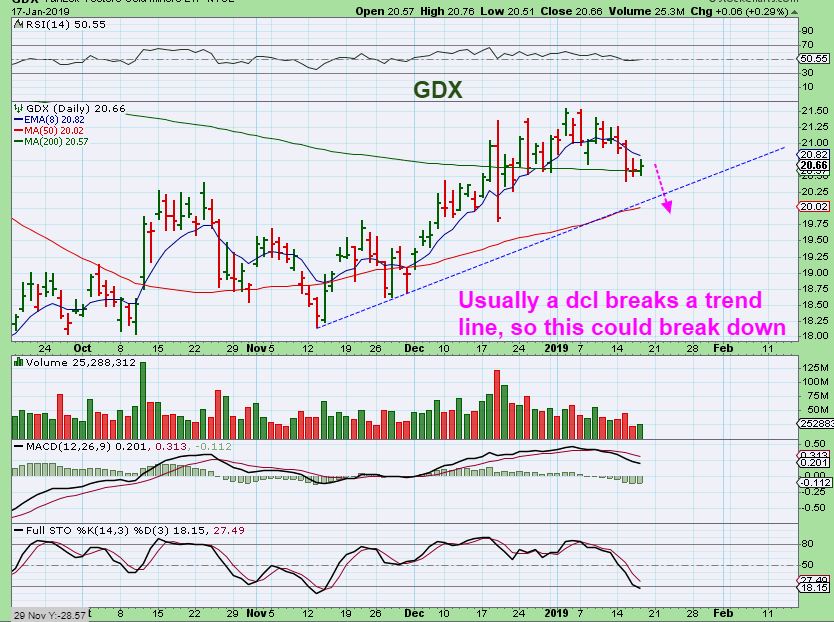
GDX – My current thoughts : I know that GDX held the 200 sma lately, but is it a mini bear flag? I think that this can drop to the 50sma. Notice – It is under the 10sma, the 10sma is curled down, and I would normally expect a break of the blue trend line. So I’m still watching for a tag or break of the 50sma. IF THIS BREAKS OUT HIGHER above the 10sma, you can simply ‘adjust to that’ and Buy it with a tighter stop under the 200sma, or a loose one under the 50sma. .
(from 1/17/19)
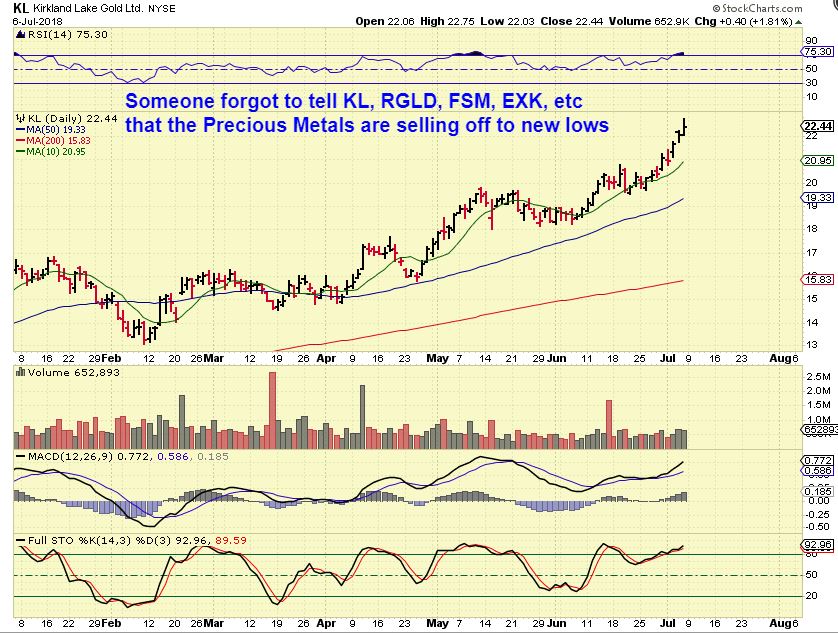
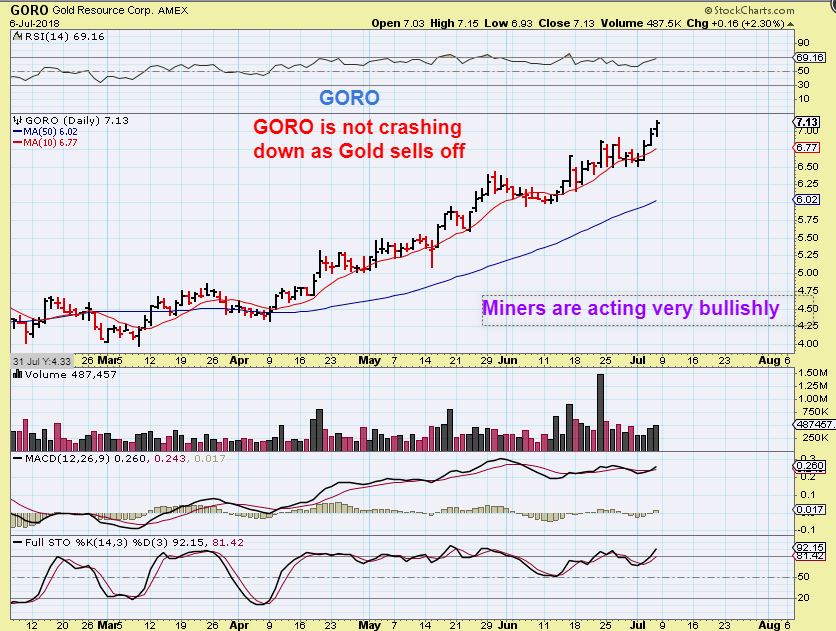
Let’s look at some Bullish Metals leaders, and then some that should play catch up
.
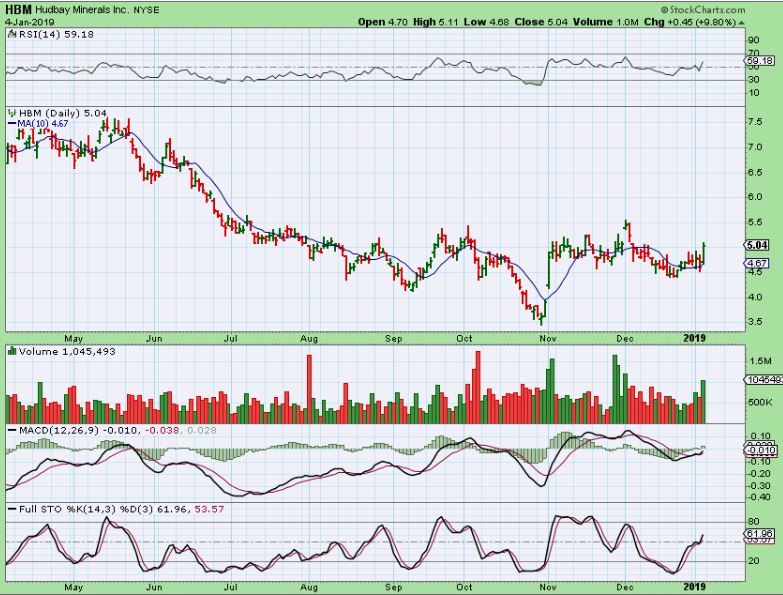
HBM – I pointed out This as a BUY, inverse H&S. I also had some other bullish looking METALS stocks . HBM as an inverse H&S, TGB, WRN, CPST, X, AKS, etc etc . were bullishly popping too. Here on Jan 4th, the HBM volume pops look Bullish…
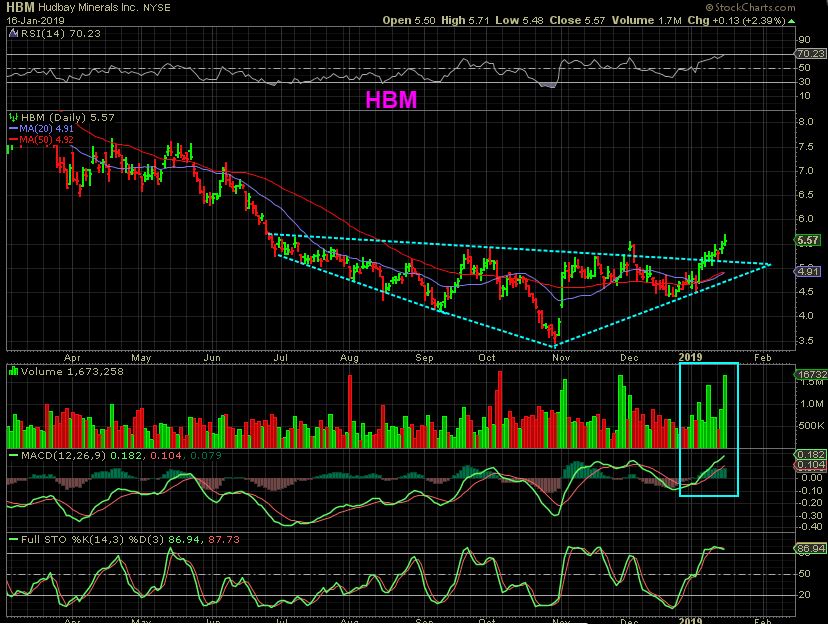
HBM – HBM has been running with strong volume from there, and the Metals still seem to be basing and Bullish.
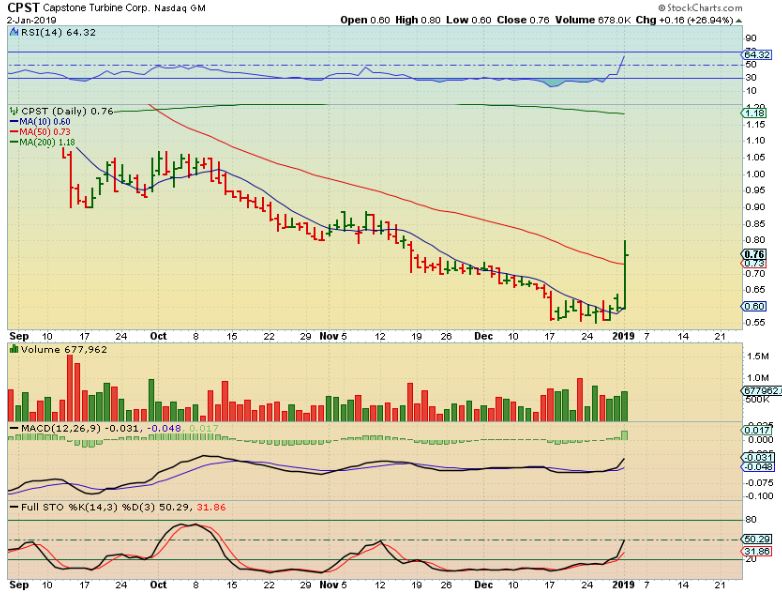
CPST #1 – Capstone Turbine usually runs with Metals. I posted that this had a large POP out of the base, look for a possible bull flag to buy…
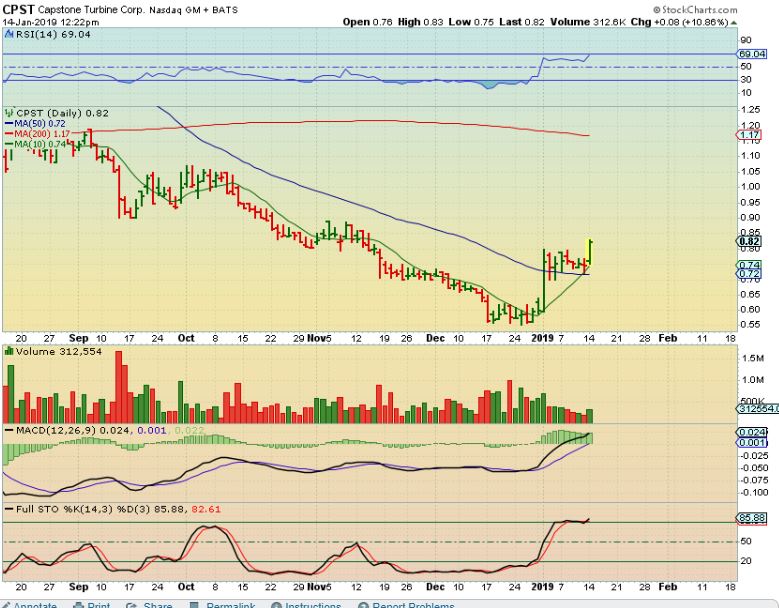
CPST #2 – I posted this as a bullish crawl along the 50 sma, a Bull Flag, and a break out. It popped 10% again as a leader. It continued higher as the day went on…
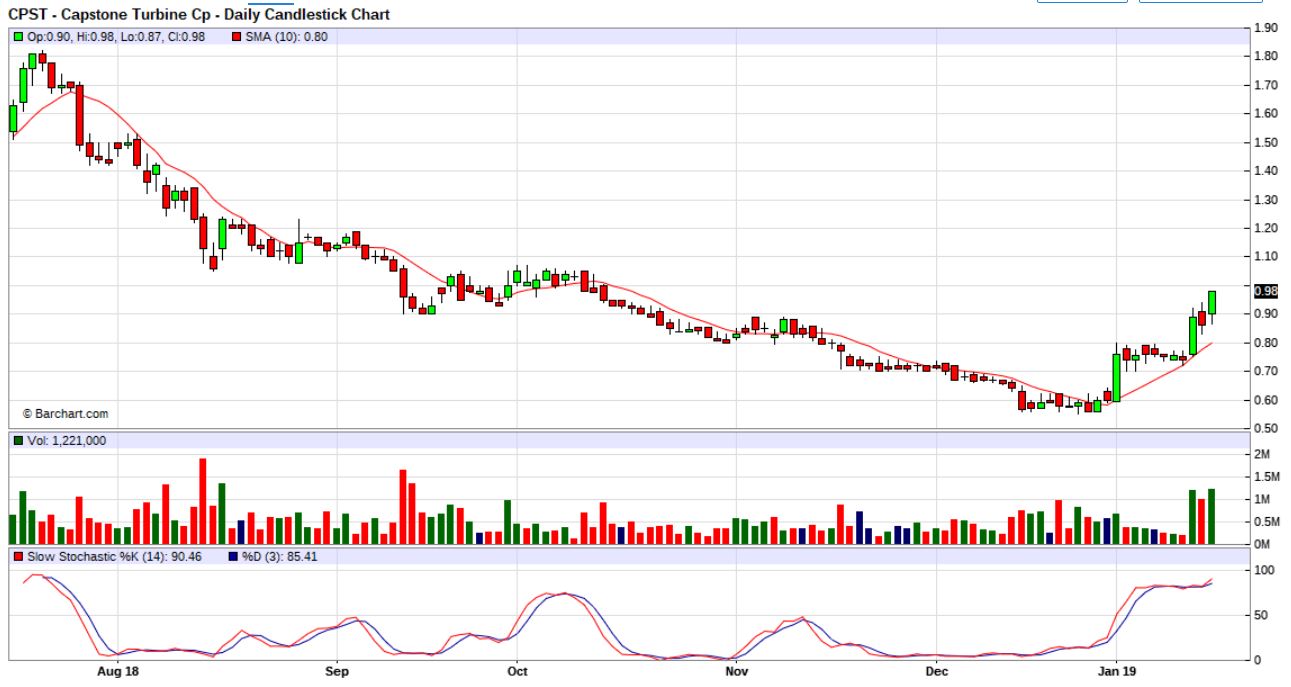
CPST #3– And closed up almost 20%, and …
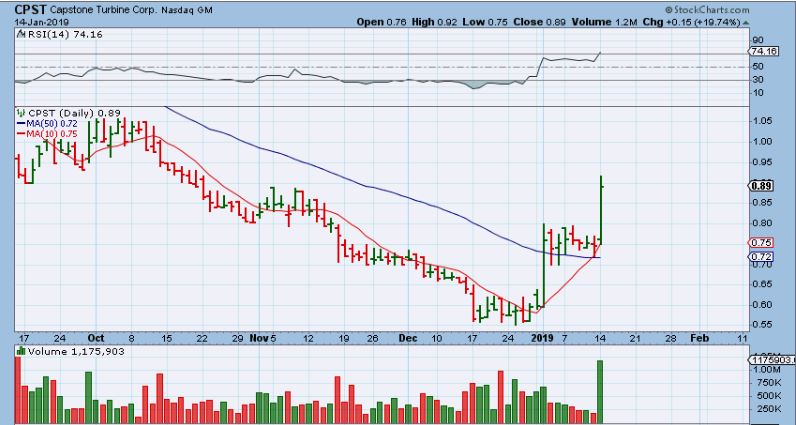
CPST #3 – CPST continues to lead the way higher. So let’s look at a few other Metals stocks setting up bullishly…
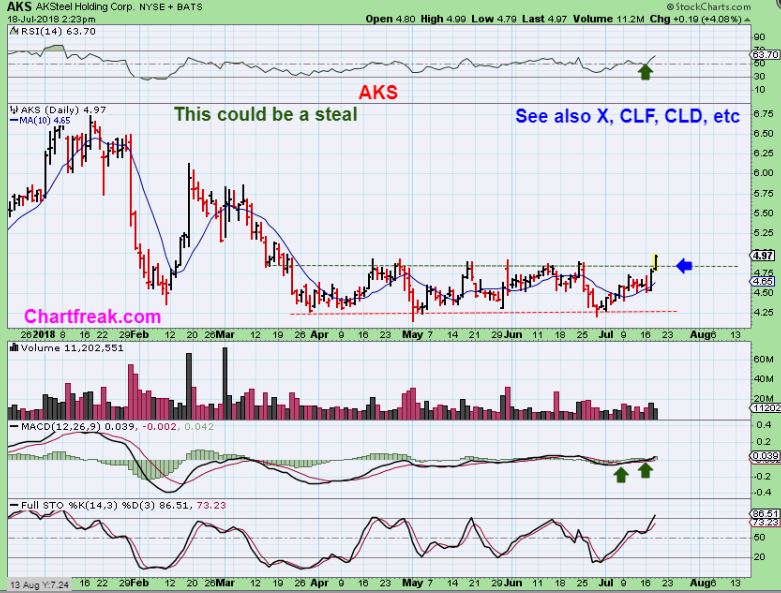
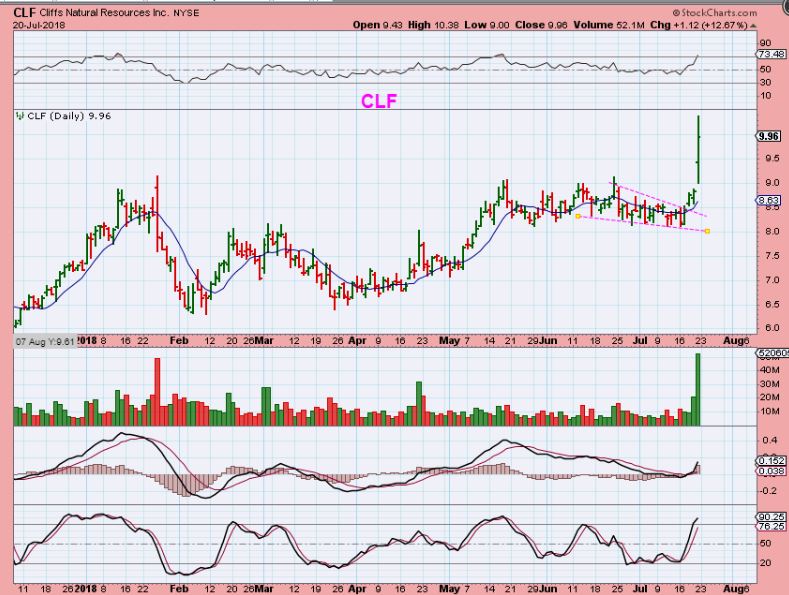
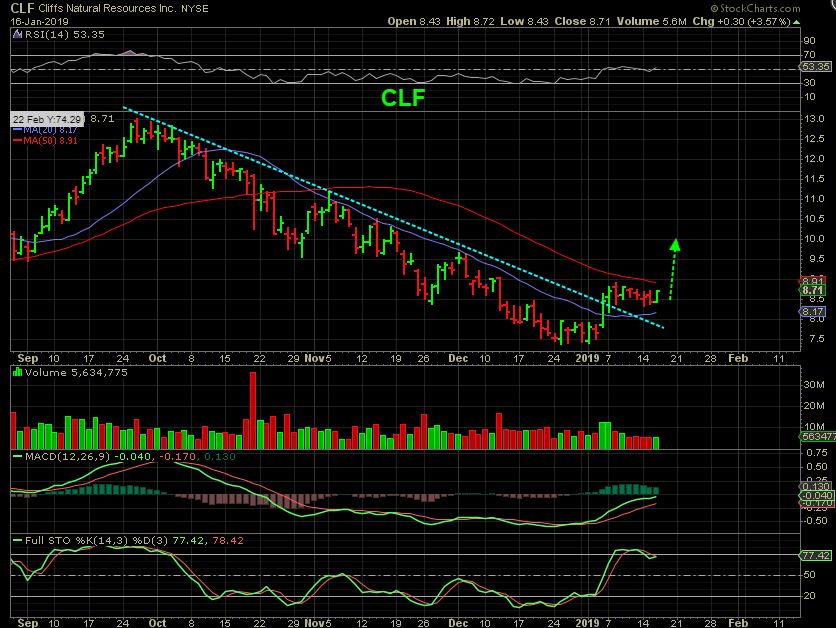
CLF – Crawling under the 50sma, this looks ready to pop higher soon. I would buy this , AKS, X, or many of these below with a stop in a reasonable place , in case of any bed news releases. Hold a small basket of stocks for safety or start with smaller positions.
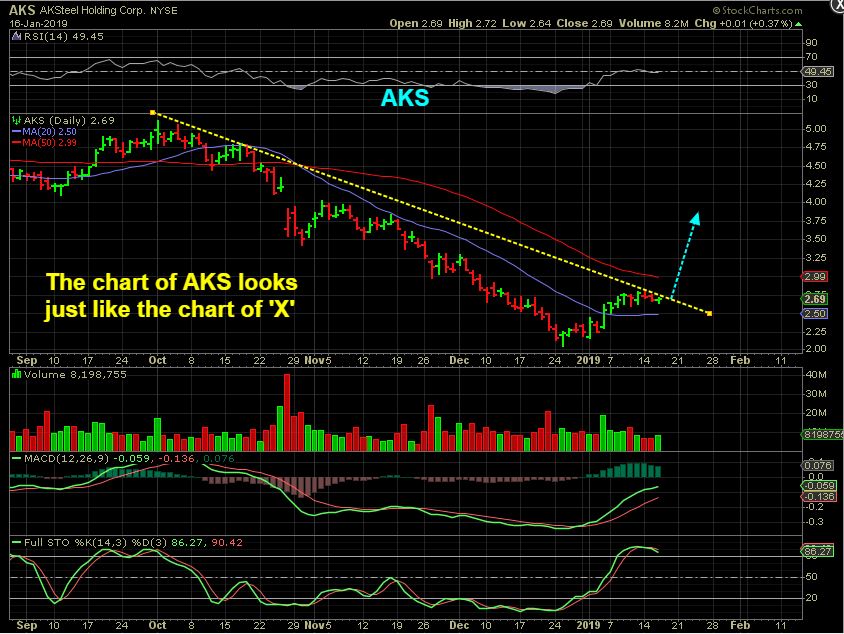
AKS – This is also crawling sideways and looks ready to pop soon. Read the chart. So keep your eye on your watchlist of X, CENX, AA, VALE, TGB, WRN, ETC.
ZEUS broke out yesterday, as a possible leader, so watch X, AKS, etc.
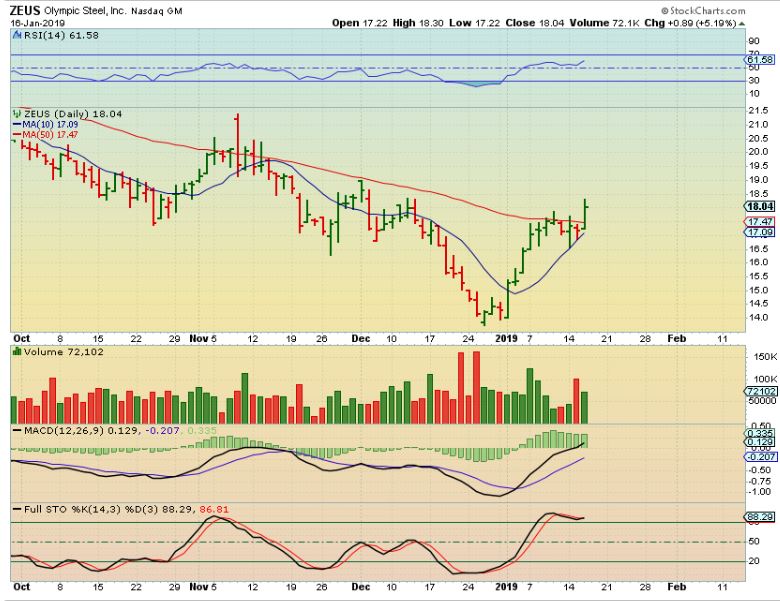
Chart Freak Membership
Alex has been successfully writing a daily newsletter service for nearly four years now and is considered one of the best traders of precious metals miners, energy/uranium stocks, and biotechs. This is your opportunity to join his service as a member and follow along as we enter the next bullish gold Cycle higher.
If you would like to find out more about the service or sign up, please click the buy option for more details.