I received a couple of emails recently from the public readers ( one was an old friend, Thanks Bob C. !) , either asking where have I been when it comes to my public posts, or asking me to review what I have been seeing lately. I’ve been very busy this spring with the premium reports and a private chat area that we have in there, plus other outdoor activities and responsibilities that I care for every spring, but as for a review? I would be happy to do that. 🙂
The General Markets became choppy in March and I was expecting a drop into a daily cycle low. I estimated that the 50sma would be a good target.
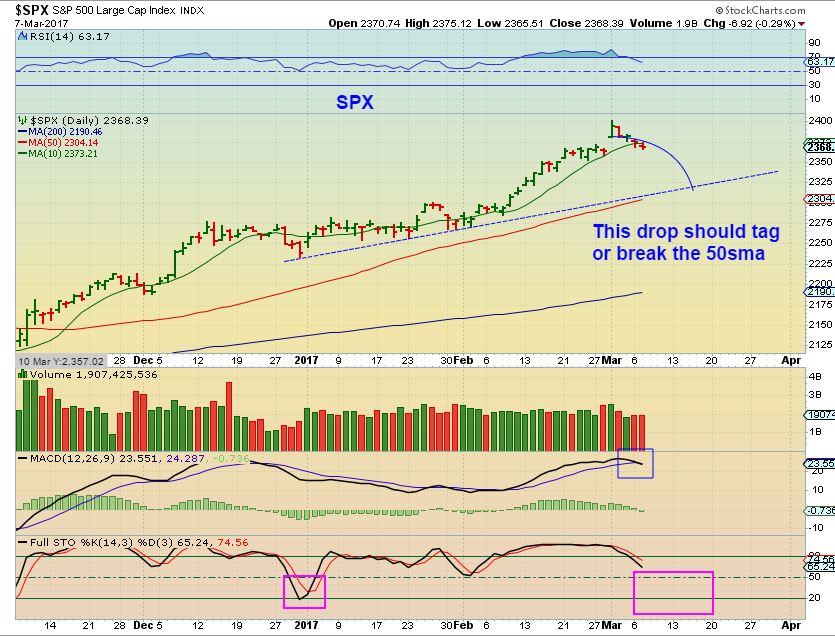
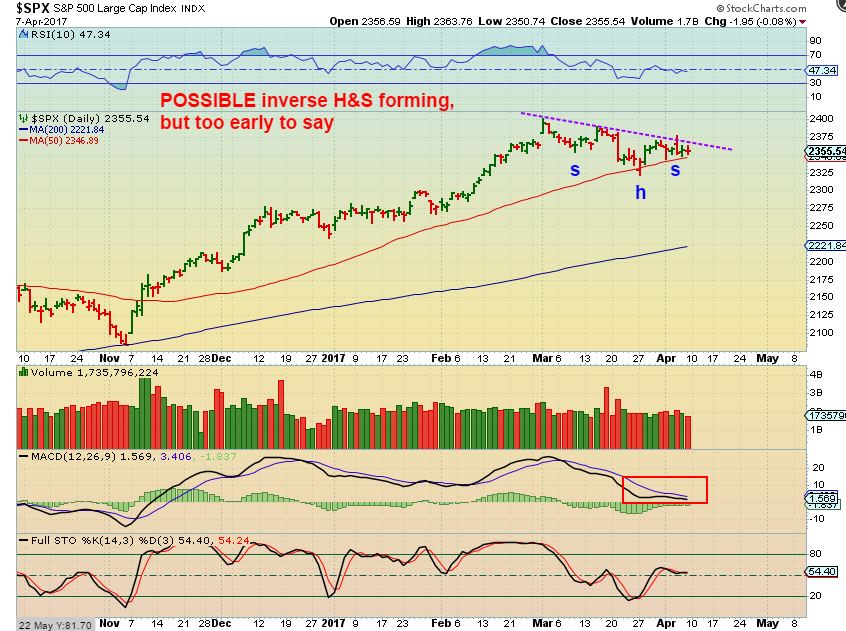
For over a month things were choppy and difficult to trade really, until we got a directional break. The drop was not as sharp as I had imagined, so some of the trades that I was taking were working out, but others lacked follow through, got choppy, and stopped me out. I admit that this was choppy and a difficult environment to trade in.
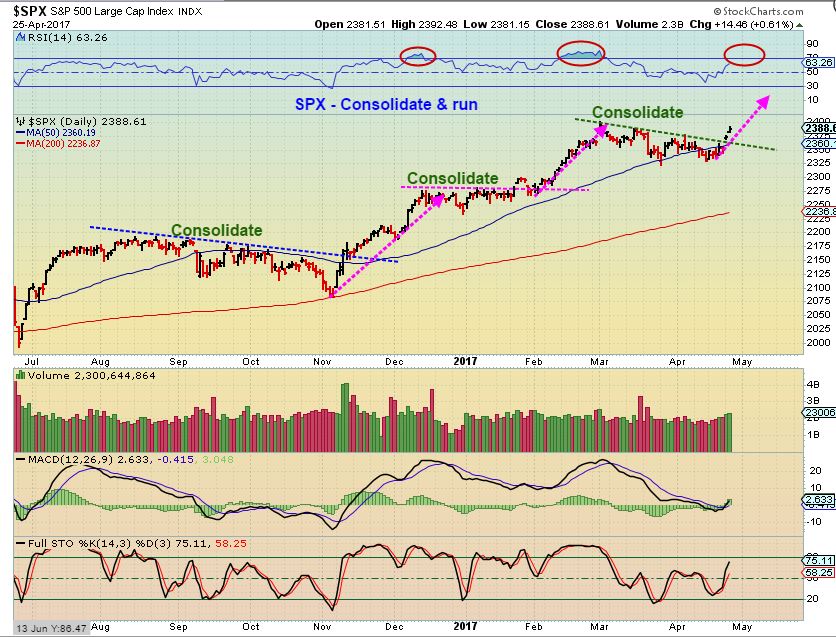
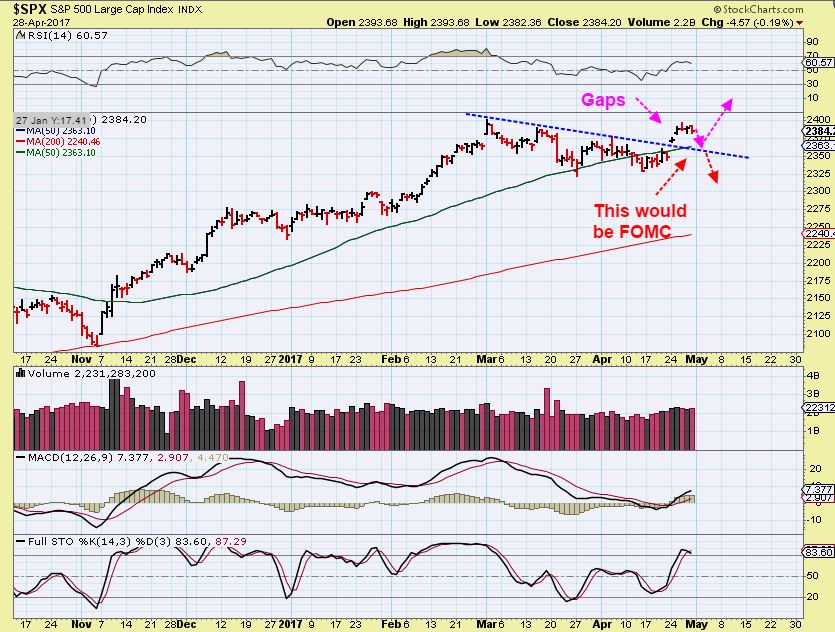
From April 25 – Currently we see a pattern of consolidation and then moves higher ( With pullbacks along the way). We do have a FOMC MTG this week, and there is a chance that that may cause the markets to dip into a low
This chart was in the weekend report, but the markets are higher today. I still expect this back test, and it may come after the FED MTG or JOBS report Friday. Then we see what happens at that support.
– So we have entered trades in various sectors this spring, and as mentioned, it was a bit choppy and difficult. Some trades followed through and others remained choppy. We also had some Energy trades that looked to be setting up at the lows. A few of those trades ( SWN, OAS, LPI, WPX, etc) did break out, but also refused to follow through in the following days, so this caused me to re-evaluate the OIL markets. Let’s look at Oil & energy at that time.
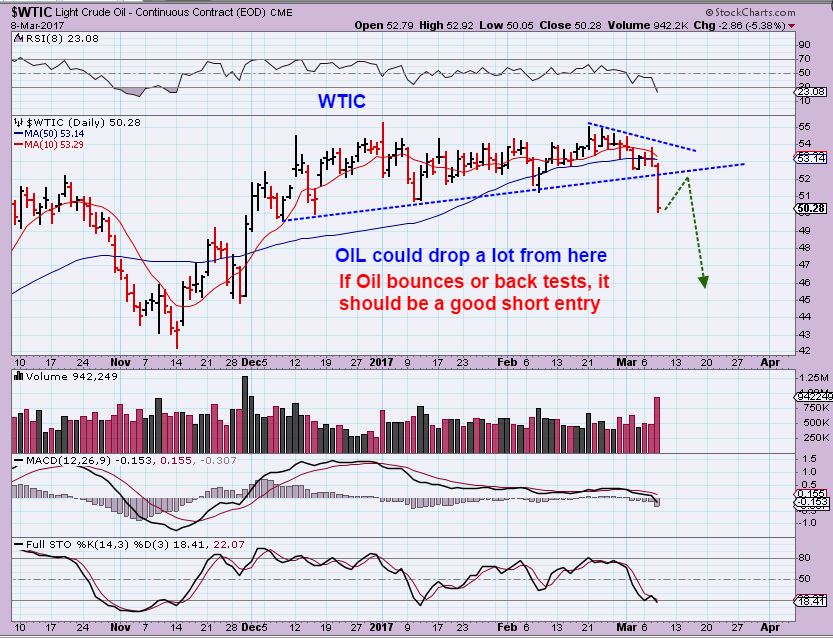
WTIC – The Oil COT showed that smart money shorts were at record levels, so I was looking for a deep sell off. After this initial slam down day, I expected a back test of the break down and continuation of the drop as shown. I also noted that I have seen OIL just sell straight down, so we would be aware of that.
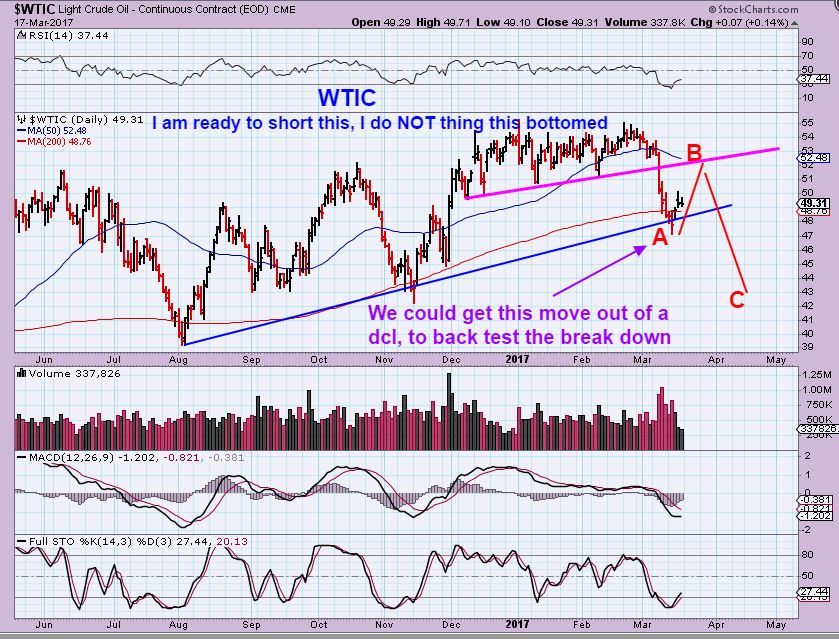
WTIC – Oils drop just continued to a support level, so I drew this A-B-C , and discussed shorting Oil at ‘B’ ( The back test).
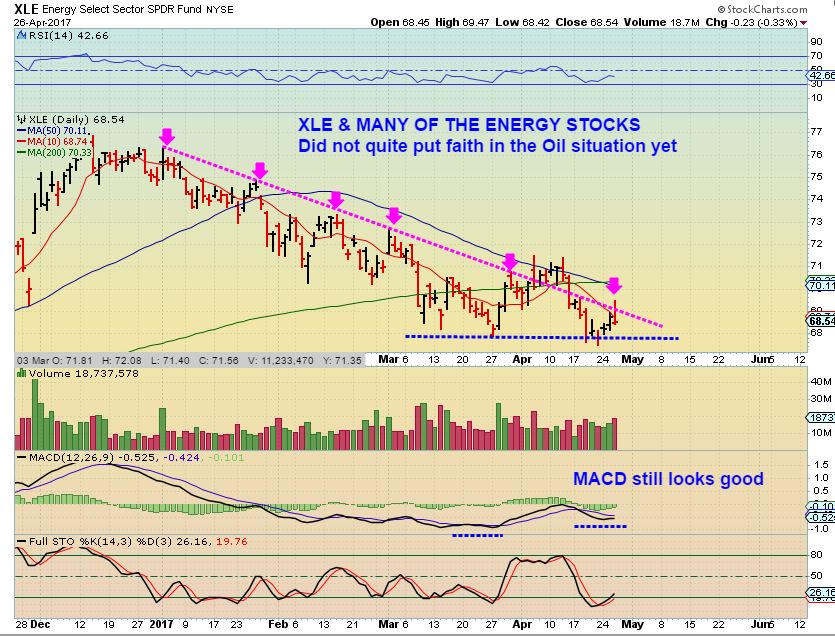
Clues were found in the XLE – At this point I began to notice that the XLE & many energy stocks were possibly firming up for a break out. This caused me to hesitated shorting Oils bounce if I did see Energy stocks break out, since they could be leading the way higher and indicating that Oil may strengthen too. This is where I added a few energy stocks to see if the bounce has follow though.
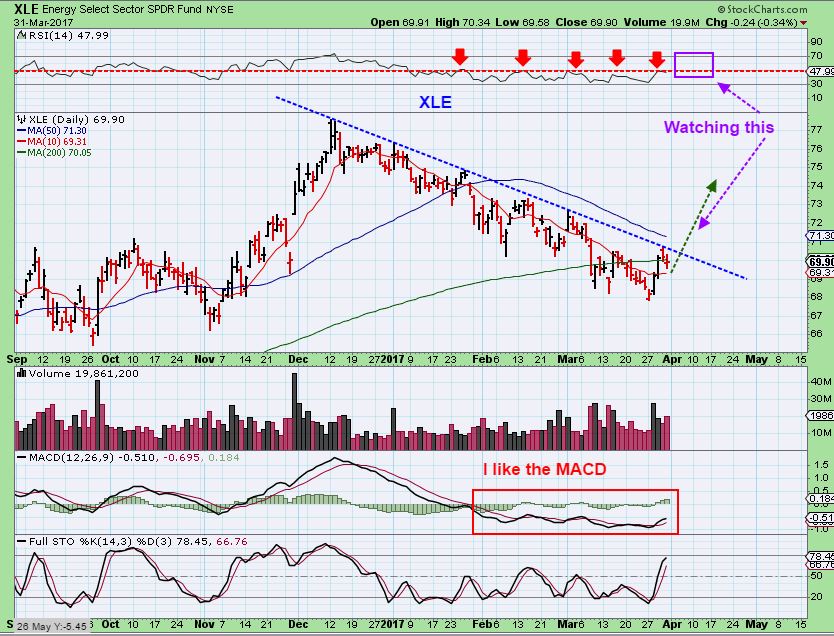
XLE – The XLE did start to break from the downtrend, and my energy picks did well for a few days.
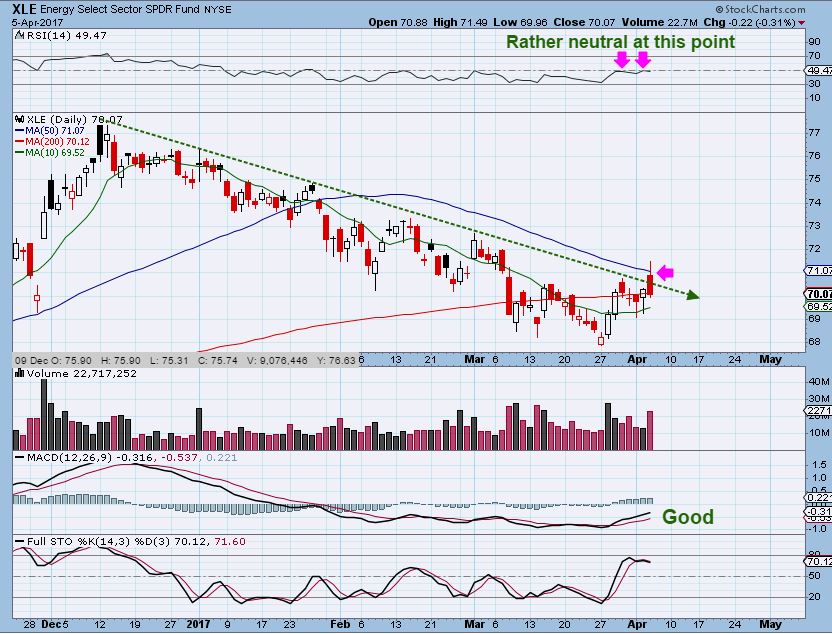
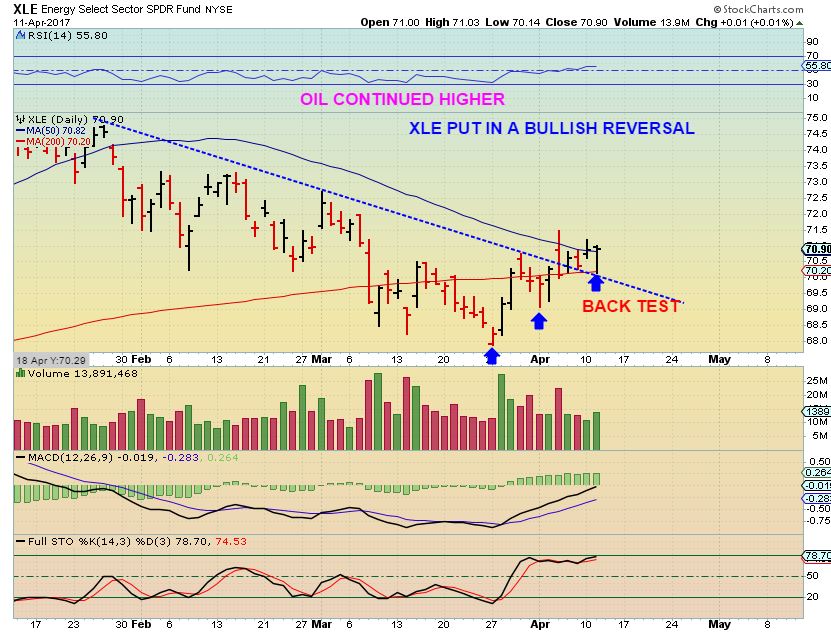
XLE APRIL 11 – Xle also started to move above the 50sma and looked to be recovering. Our energy stocks broke out too, but then a few days later they fell back under their down trend lines, so I took profits. This choppy action is difficult to discern too, and the set ups needed more time.
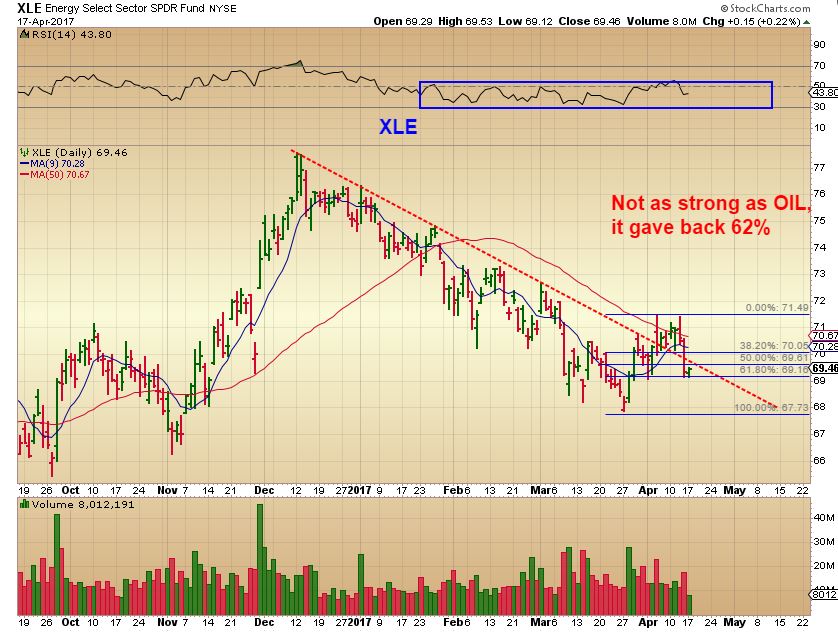
XLE APRIL 17 – XLE broke out , but it seemed to be a false break out. Now I began to think that my original analyses calling for OIL to do that A-B-C drop could be the correct call and could still play out.
XLE– XLE is currently possibly bottoming, but is still finding resistance and may need more time.
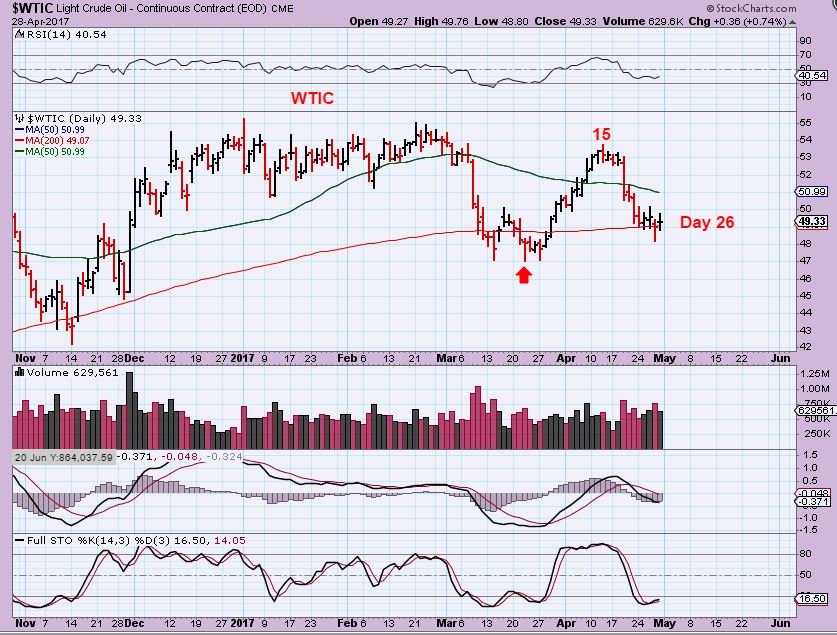
WTIC – Oil sits on the 200sma and is oversold, but there is still weakness and patience may be needed in the Oil sector. This could still break down. It didn’t pop & run higher on last weeks rather bullish inventory report.
NATGAS IS A TRADE THAT DID WORK
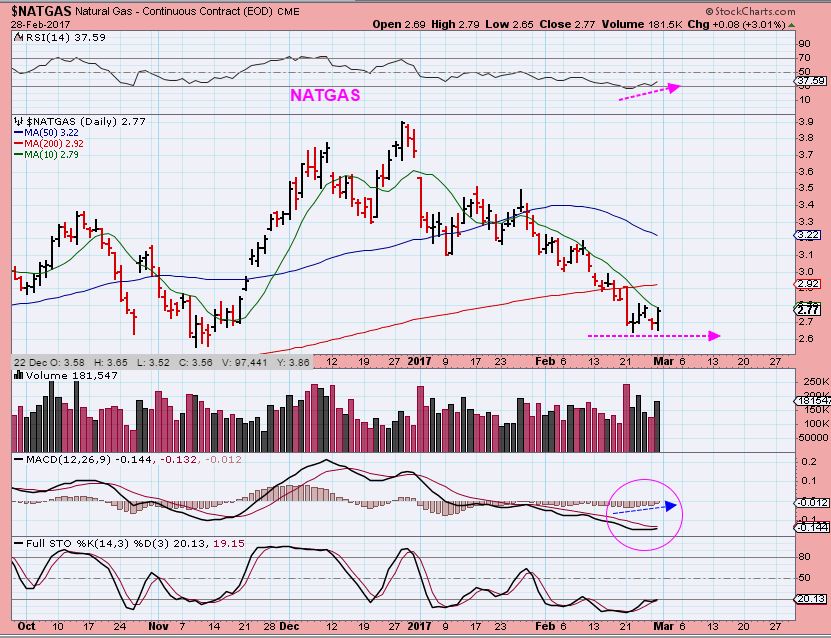
NATGAS FEB 28th – NATGAS was around $2.70 and began to bottom in Late February. Cycle timing wise, I was expecting this to be the lows, and possibly a ‘shake out’ or a false break down at the 200sma. I was looking to go long ( Via BOIL & UGAZ). Some of my readers chose to use options.
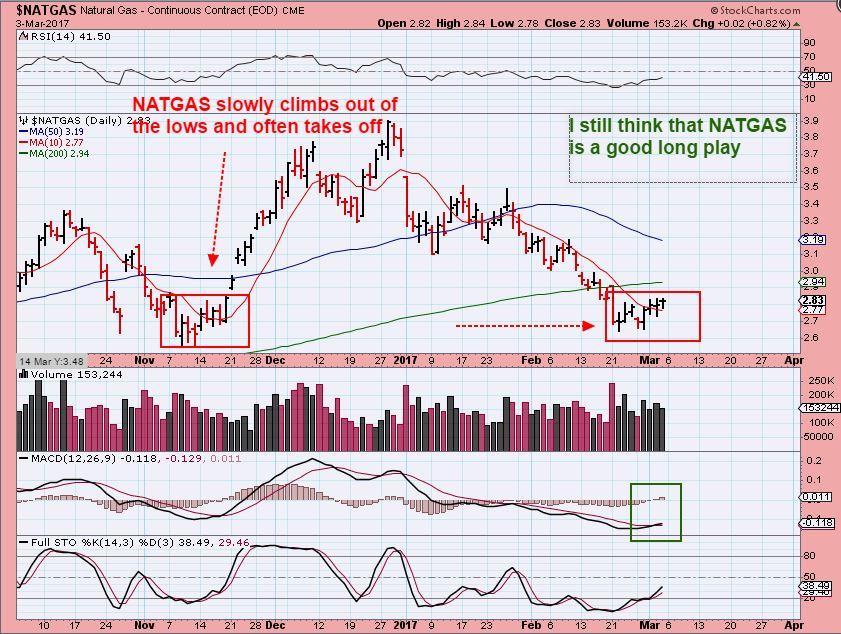
NATGAS – March 3rd – SO at this point, we were long around $2.75.
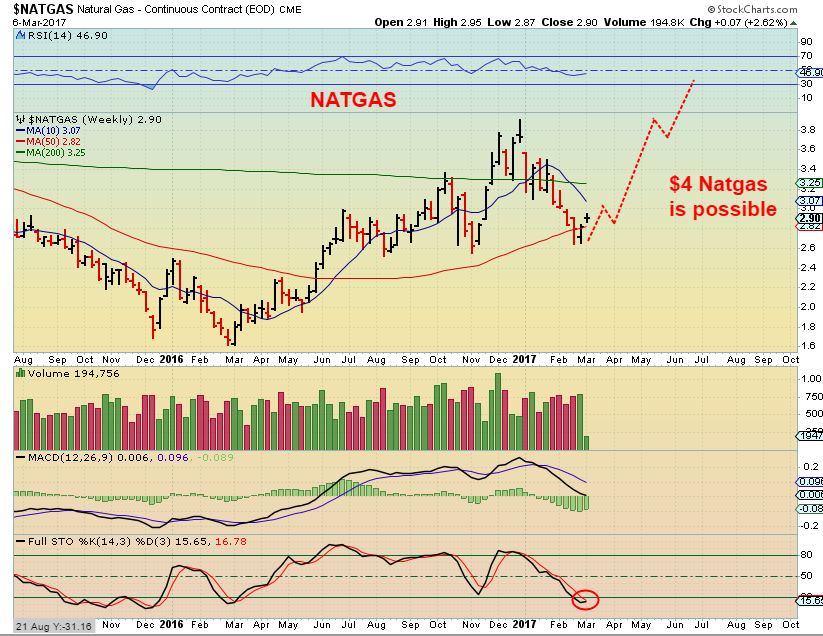
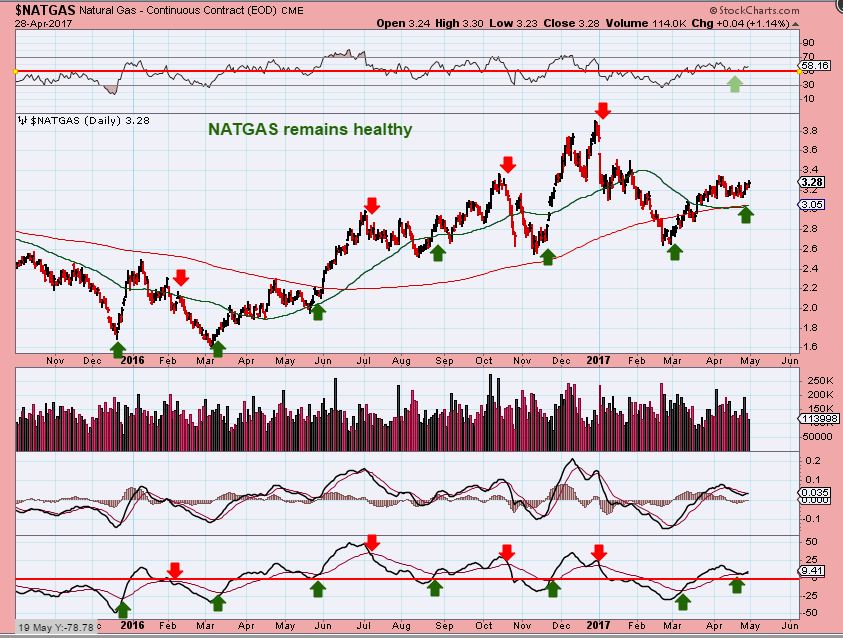
NATGAS – The weekly chart showed a possible shake out & recovery at the 50 sma. NATGAS was now $2.90.
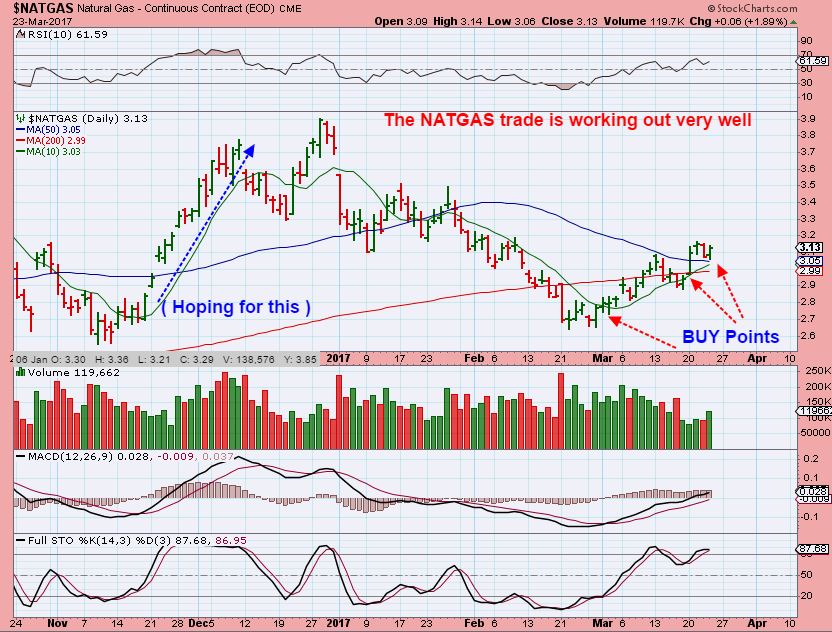
NATGAS – NATGAS ran to $3.10 and pulled back, I added to my NATGAS TRADE at the recovery of the daily 200sma.
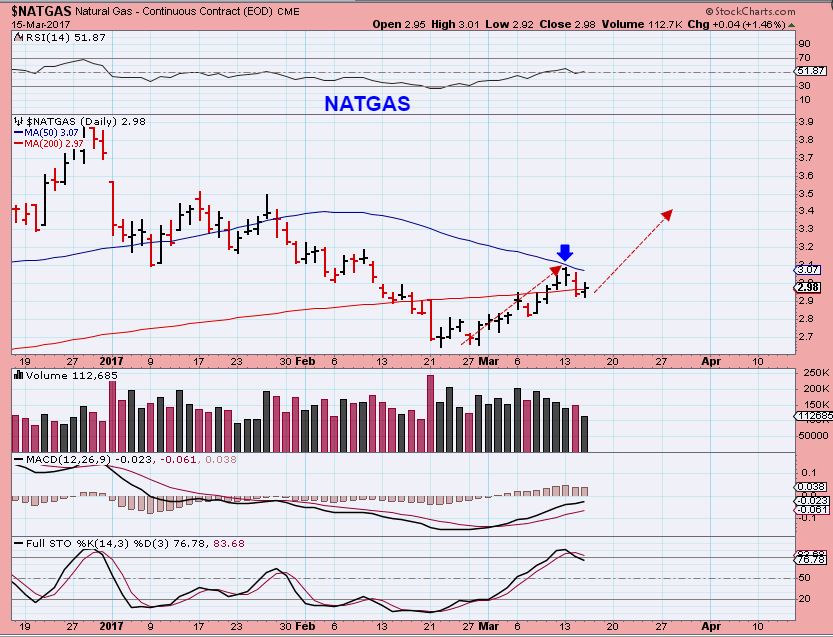
NATGAS DAILY – The trade was going well & even recovered the 50sma.
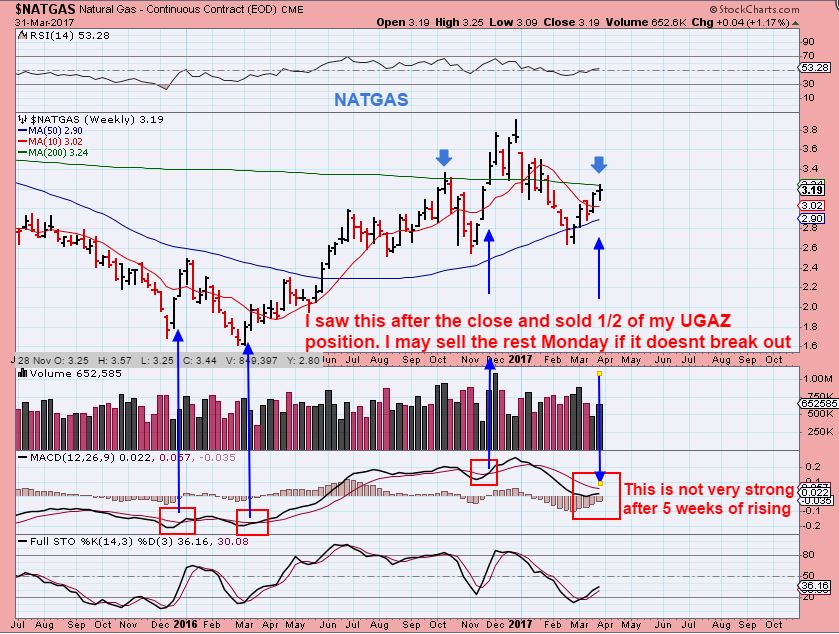
NATGAS March 31 weekly – This was a sell point for 1/2 of my position , and we could watch how NATGAS plays out from here, hoping to re-enter. As you will see, I sold early and Natgas kept rising.
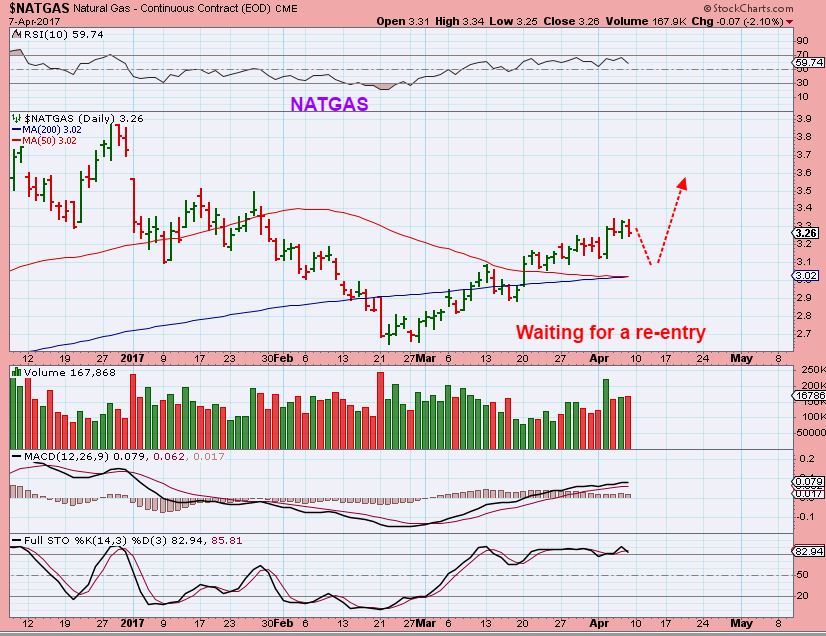
NATGAS – APRIL 7th NATGAS kept on moving higher. I had now exited my entire position expecting a cycle low as shown, so I would look to re-enter on the next dip. Though this is a bullish looking chart, We were due timing-wise for a dip in NATGAS.
NATGAS – April 13 , we got the dip, but I didnt re-buy yet…
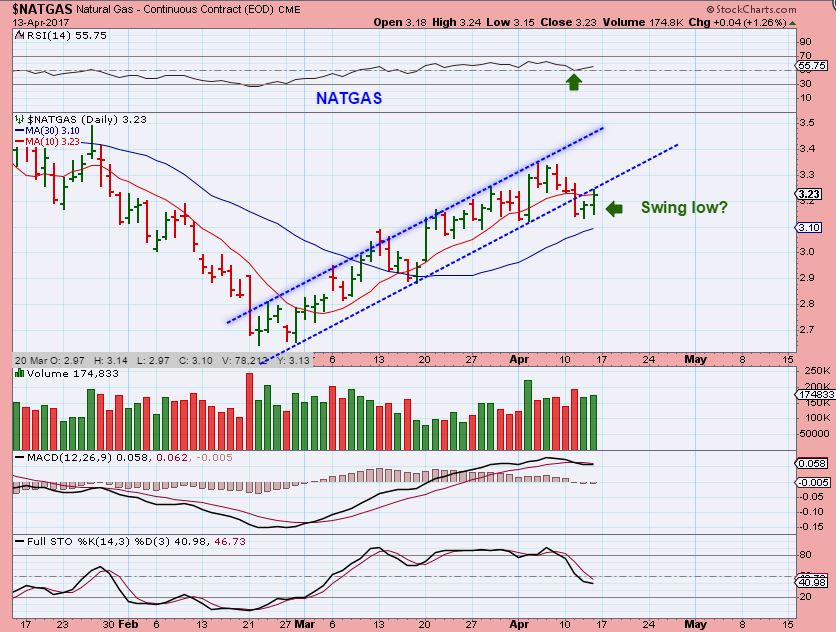
NATGAS – April 21 – I started to think that this was a back test of the trend line break and we could drop a bit more and tag the 50 & 200sma, I will buy there if that happens. If it just takes off higher, I would enter then too, possible wave 3 of 5.
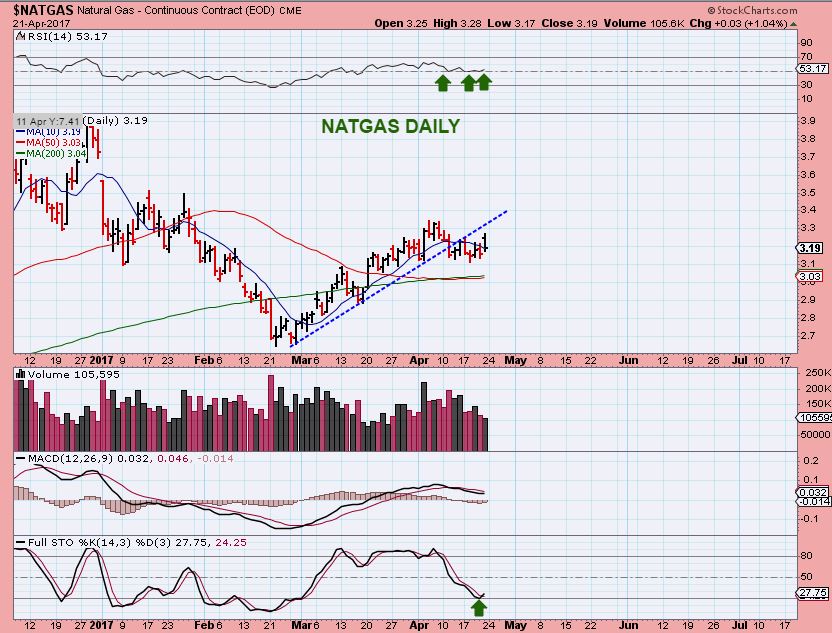
NATGAS – To date, NATGAS will not drop to the 50 & 200sma, but I am watching for that dip right now, and will buy if conditions remain bullish.
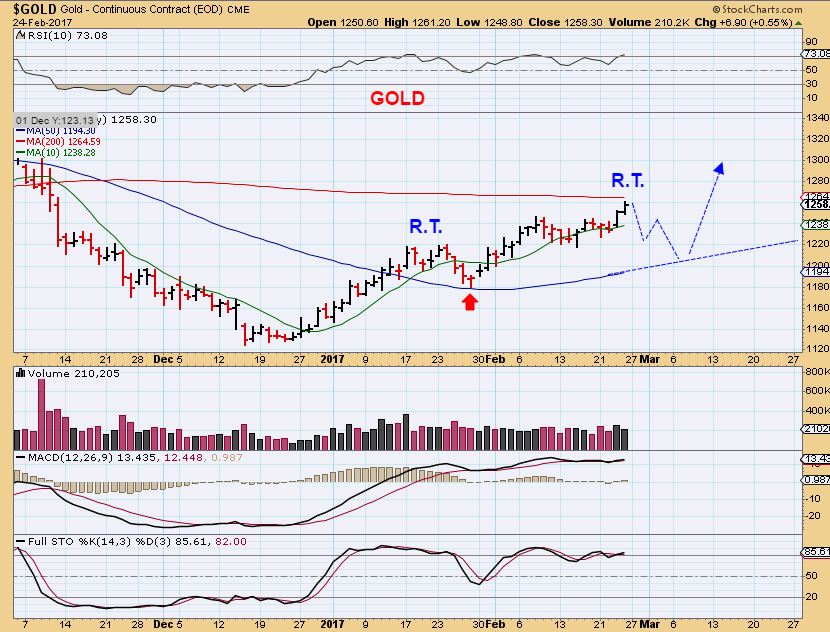
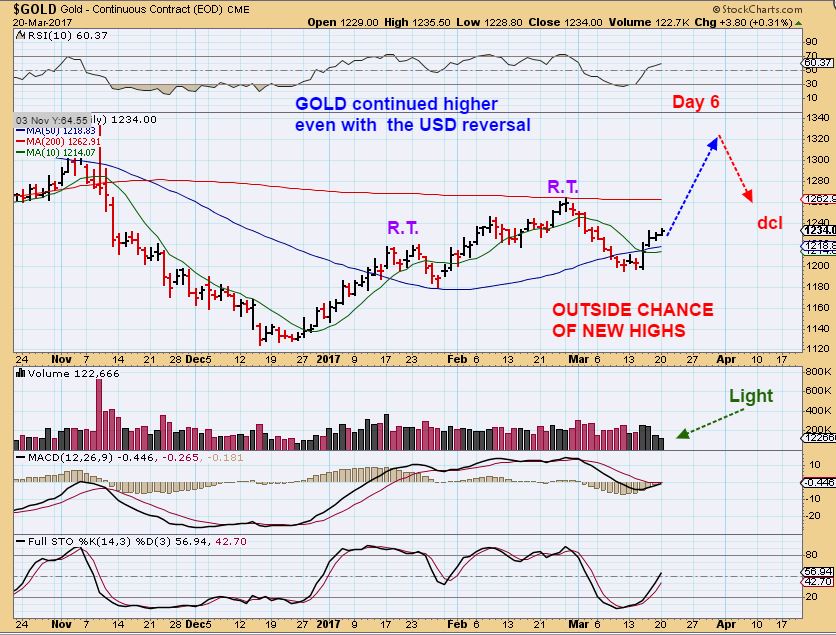
GOLD FEB 24 – We always trade Gold, Silver, & Miners. At this point Gold would probably drop into a daily cycle low . For short term traders, this could be an exit and re-enter later, or ride the dip out. We bought the deep sell off into DEC lows at the lows. I usually sell 1/2 of my position and ride the rest, but I was mostly trading Miners out of the Dec lows.
GOLD – We started to get the expected dip. Maybe a buy at the 50sma.
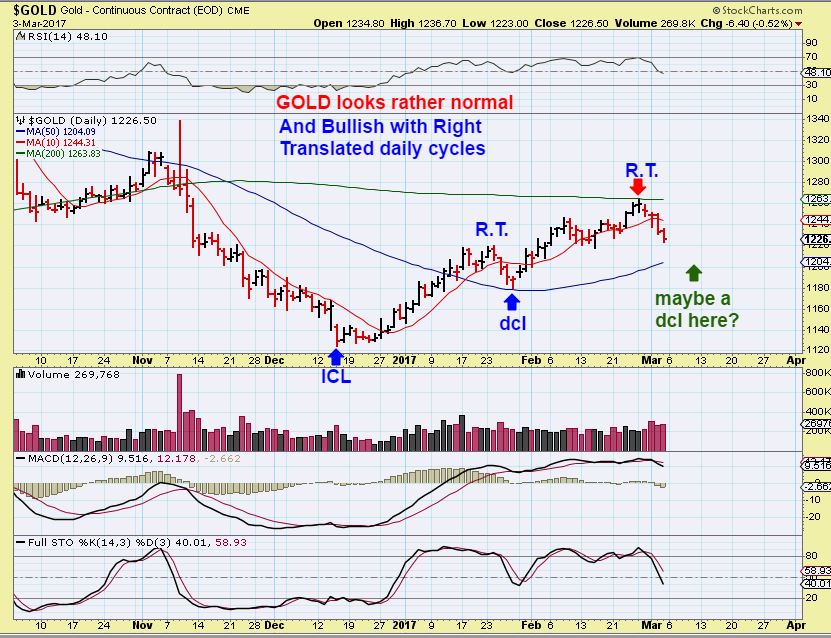
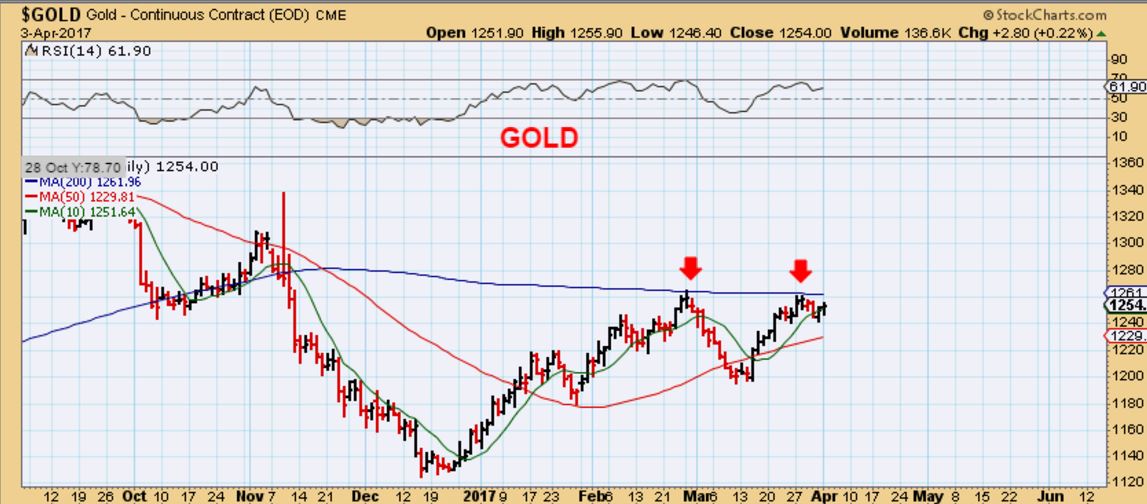
GOLD – A break down and recovery ( Shake out) at the 50sma could be a buy for Gold. By now, Miners were showing weakness and NO LONGER leading or even following Gold very well. I started discussing a shorting plan ( Via JDST & DUST), even though GOLD should move higher with 2 right translated daily cycles in place. Target = Gold $1300- $1320? .
GOLD APRIL 3 – Gold stalled at the 200 sma and crawled sideways, possibly building steam to break out, Miners were weak.
GOLD – a POP in Volume and Gold.
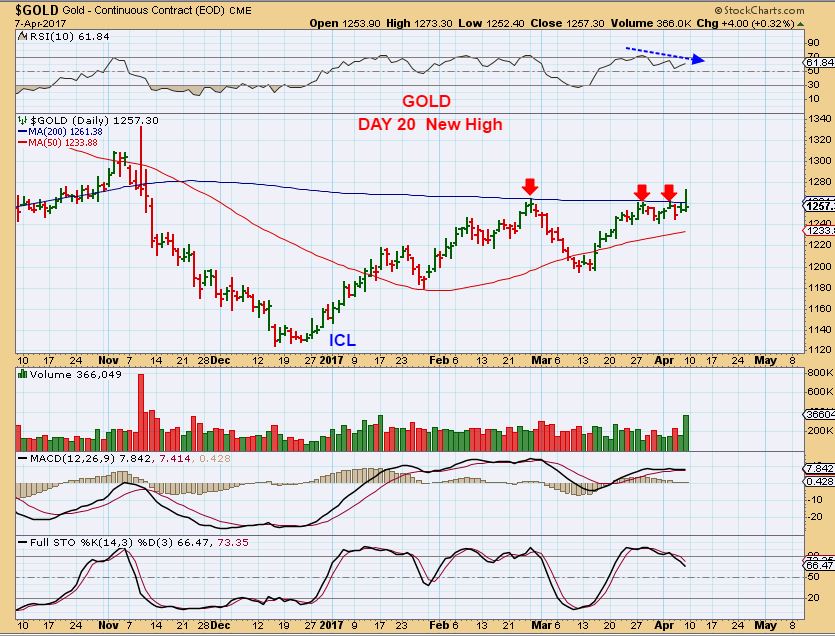
GOLD – And the expected run should lead to $1300 plus, but again, at this time I was actually discussing shorting GDXJ, as you will see in charts later in this report.
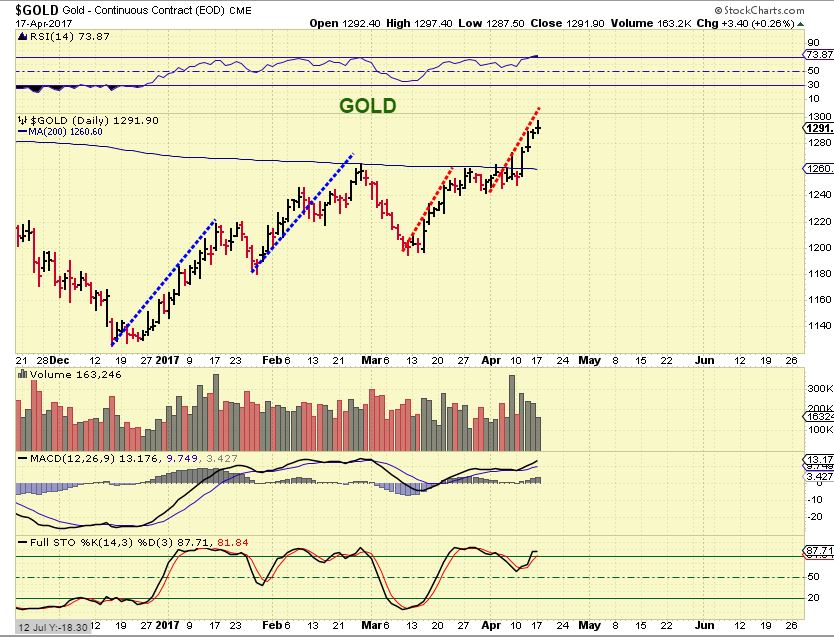
I MUST SAY – THIS WAS A CONFUSING TIME FOR PRECIOUS METALS, WHERE GOLD & SILVER LOOKED GOOD & MINERS WERE WEAK. I BECAME BEARISH SHORT TERM IN MINERS AND EXPECTED GOLD TO TOP SOON.
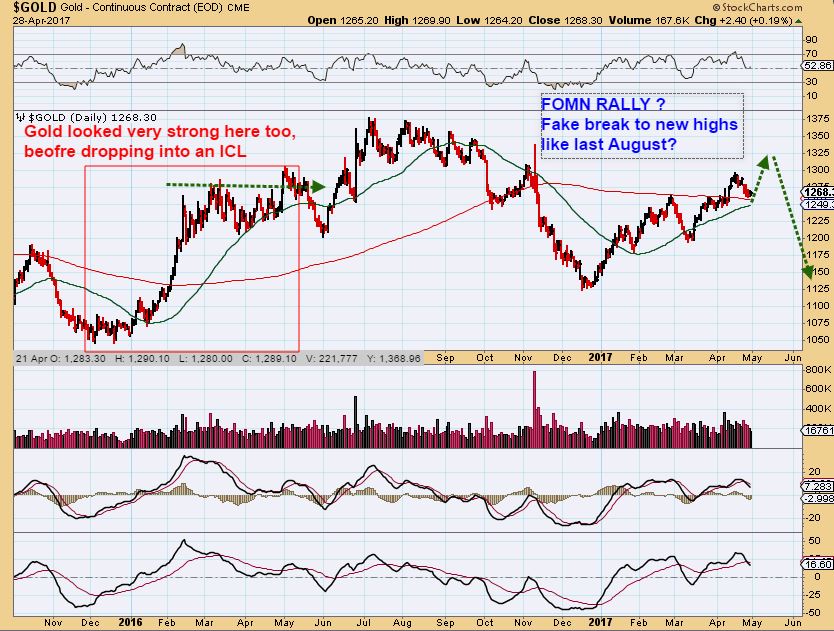
GOLD – Currently Gold tagged the $1300 area and it did drop. The short miners trade eventually played out well. We approach the FOMC meeting on Wednesday, and I do expect a reaction in the Precious Metals.
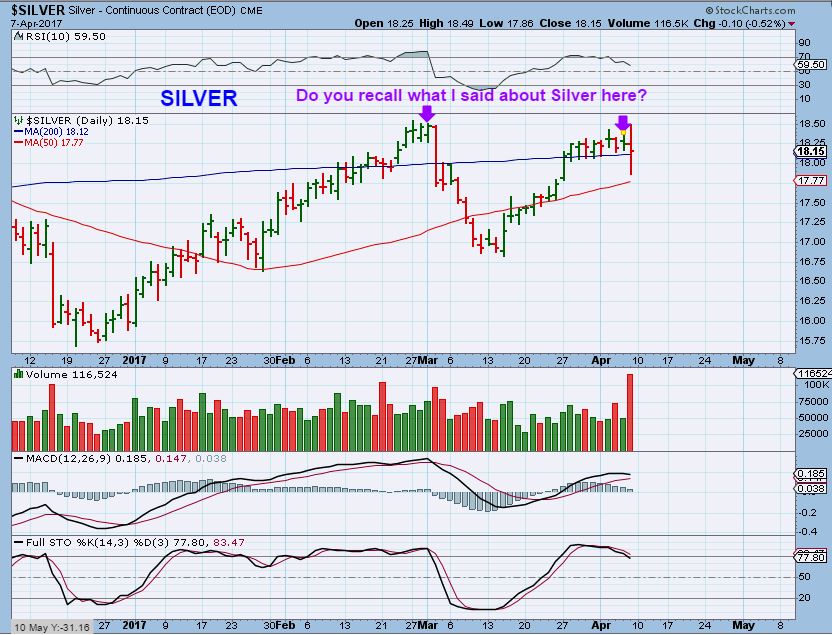
SILVER MARCH 31 warning – I showed how SILVER looked strong, but because Miners were weak, I tried to help readers see that even though this looks strong along with Gold, Caution was warranted (see the chart) …
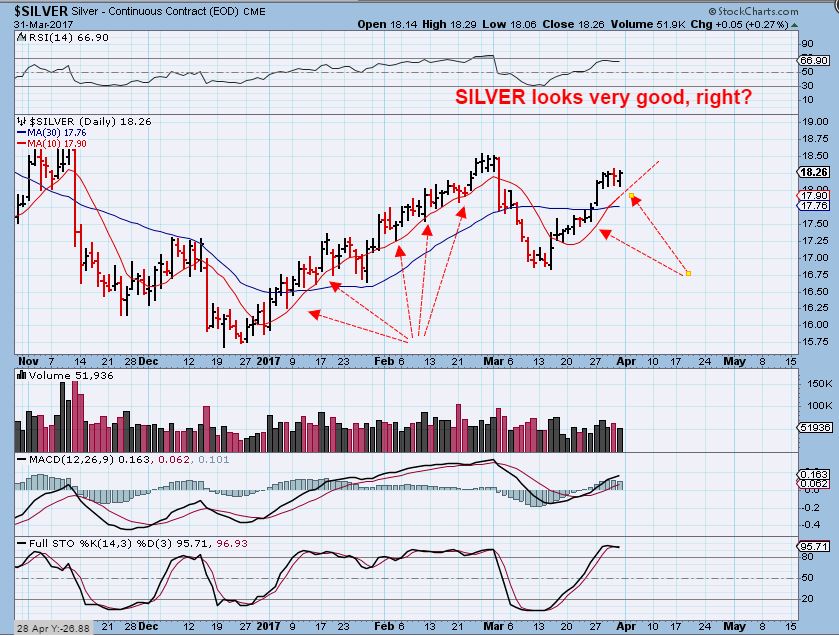
SILVER – THIS OLDER CHART WAS POSTED ON MARCH 31 – Notice how quickly a strong Silver chart can change on this chart. I used this chart to warn my readers that I expected Silver to drop and not rally. Some were leveraged ‘long’ on their own analysis.
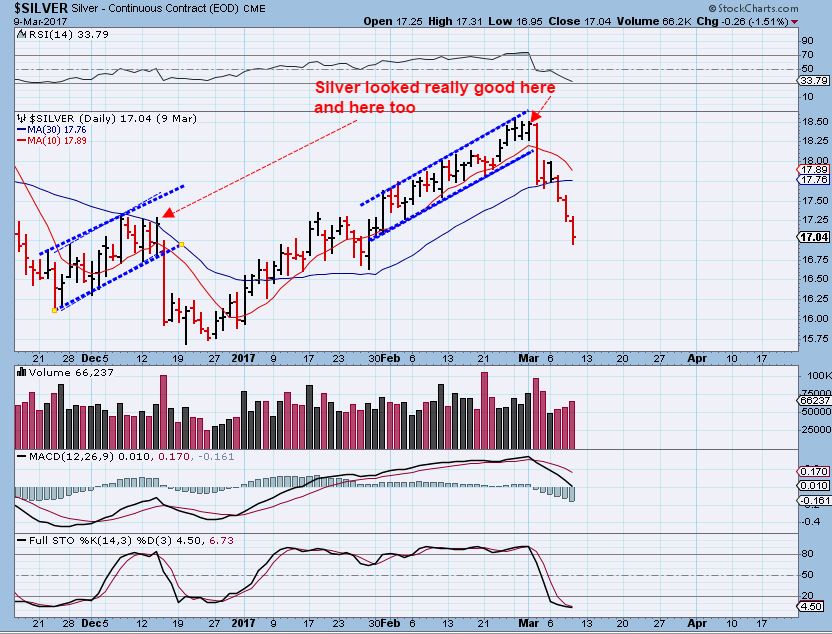
SILVER – We saw a rumbling a week later, and before that, Silver only went sideways.
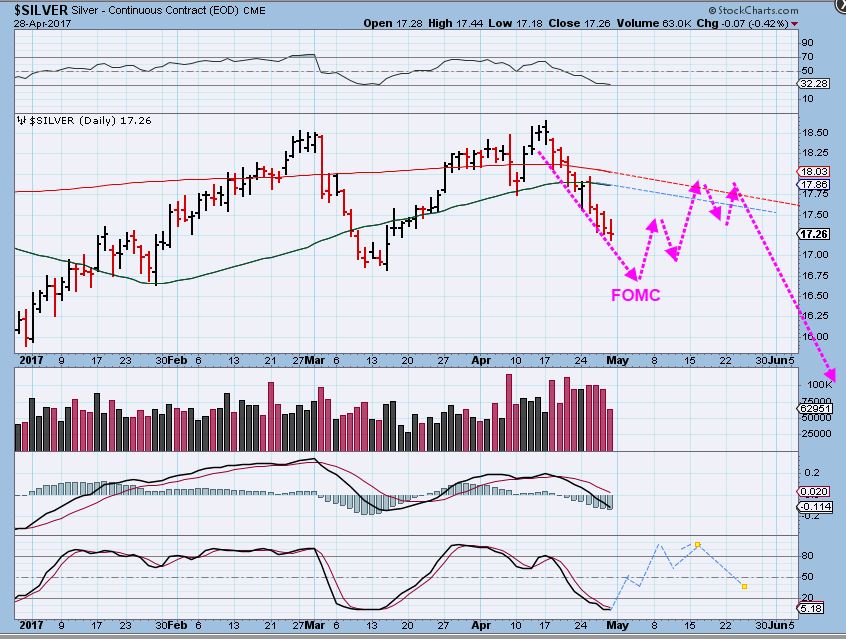
SILVER – And now we got that anticipated drop in Silver. This is the current Silver chart. We could bottom and rally after the FOMC meeting, but did you notice that I did not draw a rally to new highs? There is a reason for that.
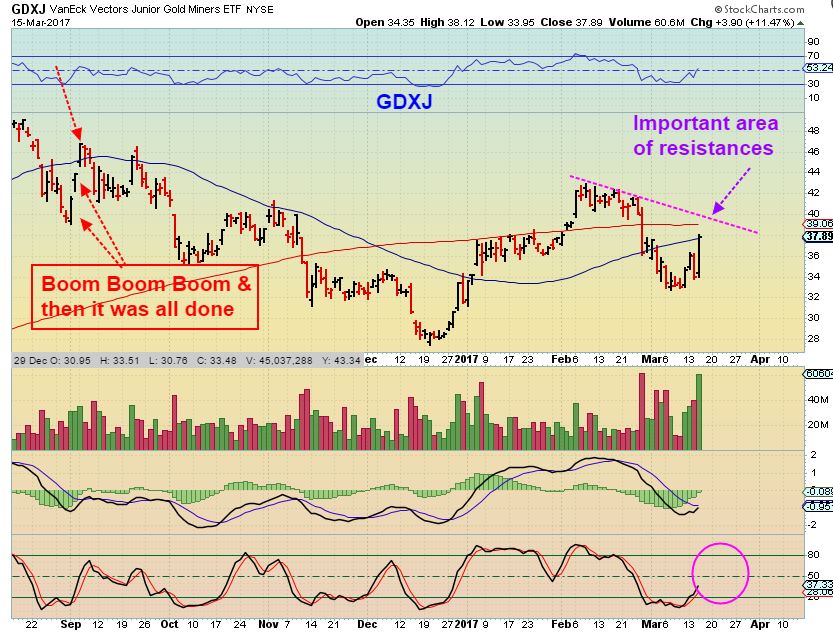
GDXJ – Here on March 15th we had a strong high volume surge, but I pointed out this resistance area. I did not expect this Boom in Miners to run strongly, though Gold was.
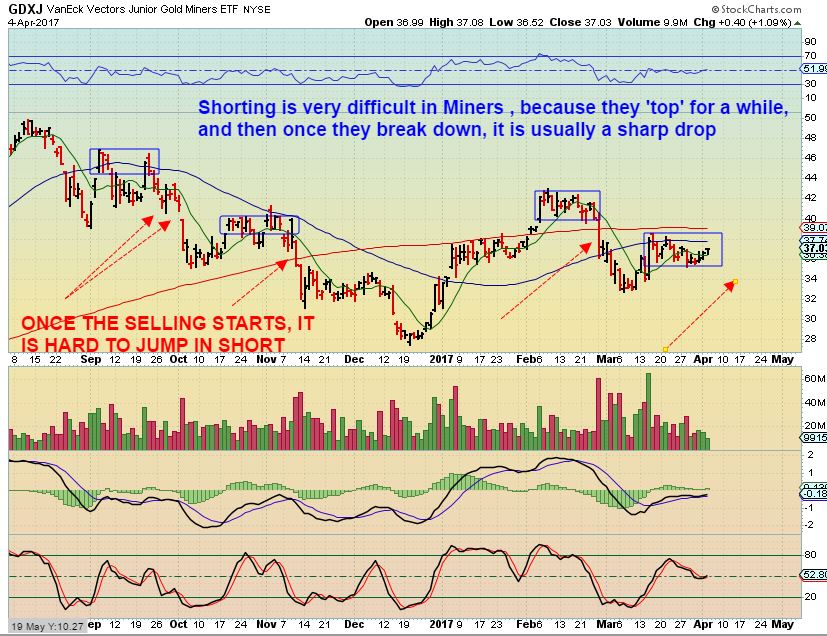
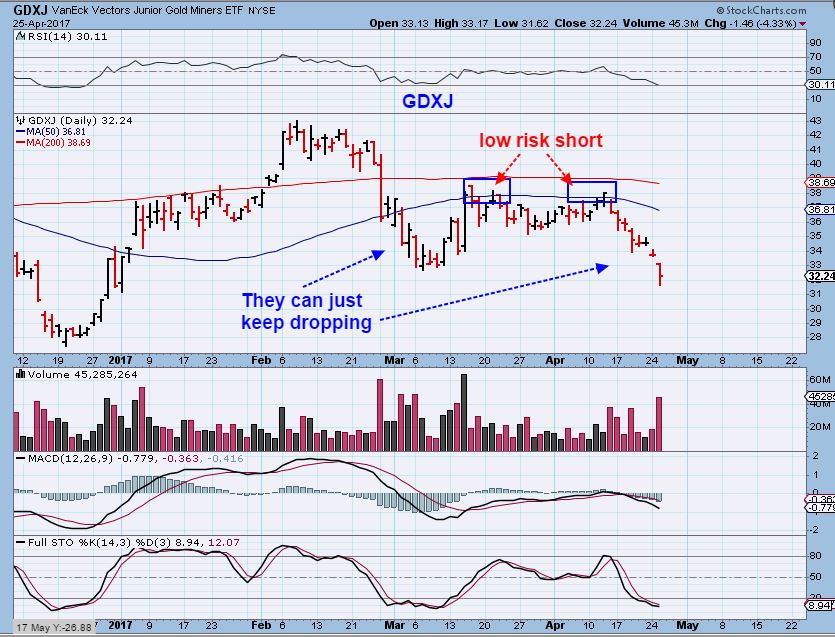
GDXJ – After that BOOM, GDXJ did not continue higher. IT stalled at the 50sma, and I began saying that shorting GDXJ at the 50sma was a good low risk set up, and I expected a good drop in Miners. I bought JDST at the tags of the 50sma. It looked a lot like previous tops ( blue boxes).
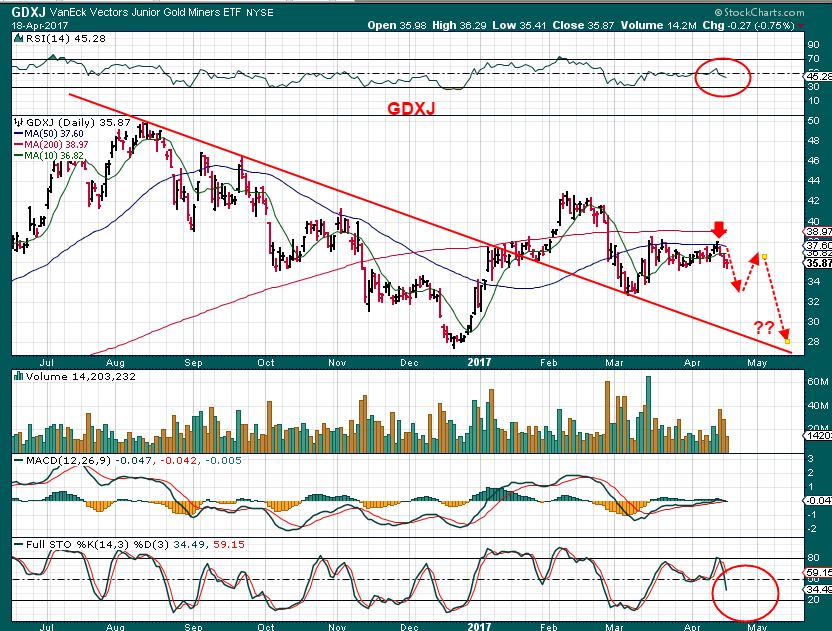
GDXJ APRIL 18th – Still struggling at the 50sma, and now ‘Time’ was a factor. It was ‘Time’ for a drop and I added to short position. This was a possible target. THIS WAS A VERY HARD SHORT TRADE TO TAKE ON APRIL 18. WHY?
AGAIN, this was GOLD on April 18, racing to new highs and looking very bullish. Even so, it was ‘Time’ for Miners to drop & we went short GDXJ again. Not easy for many.
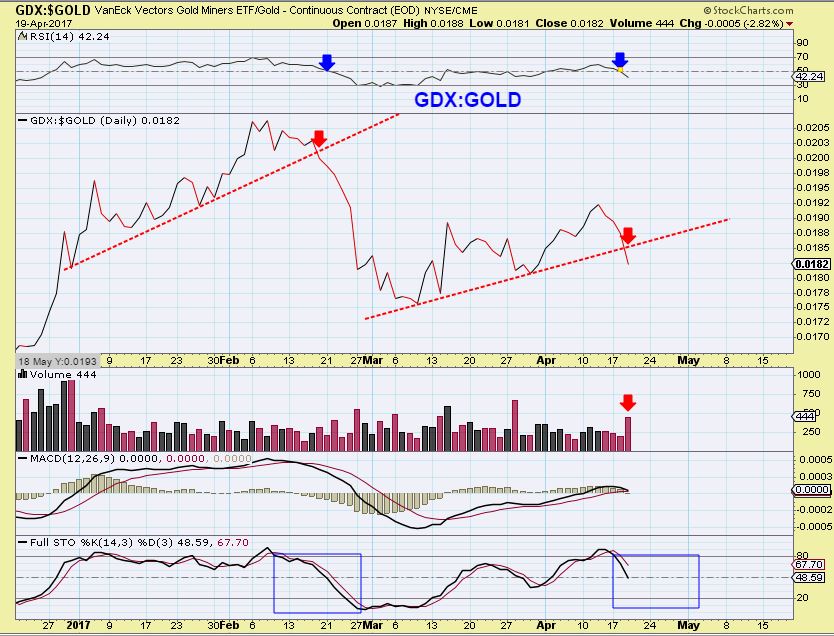
This was an added clue that something was not quite right with the Miners lagging behind gold, so I used GDX:GOLD in my reports from time to time too.
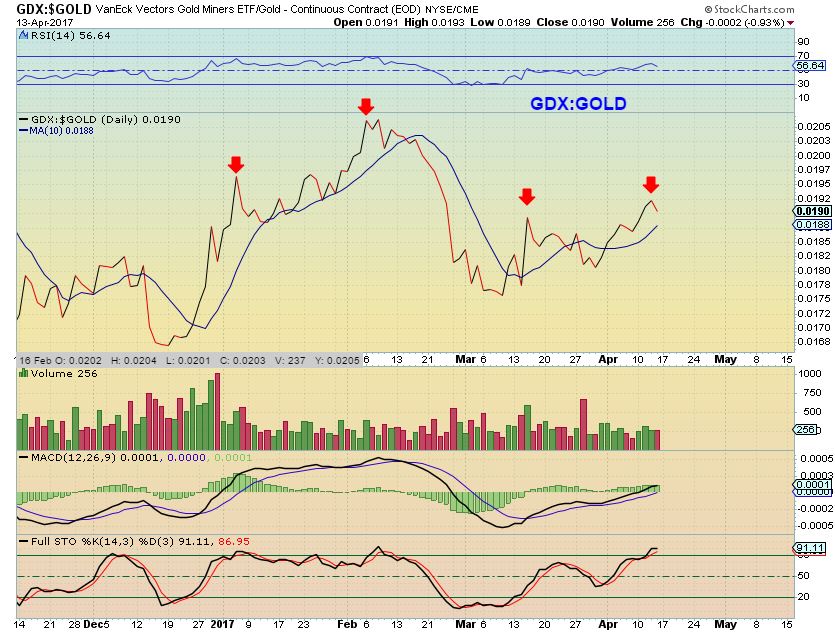
APRIL 19th – We were short the Miners, and they were breaking down.
GDXJ – GDXJ sold off as expected after tagging that 50sma.
GDXJ – This is a more current chart of GDXJ. I expect a reaction at the FOMC too, but again I am not drawing a break to new highs and there is a reason for that. I have explained the timing to my premium readers.
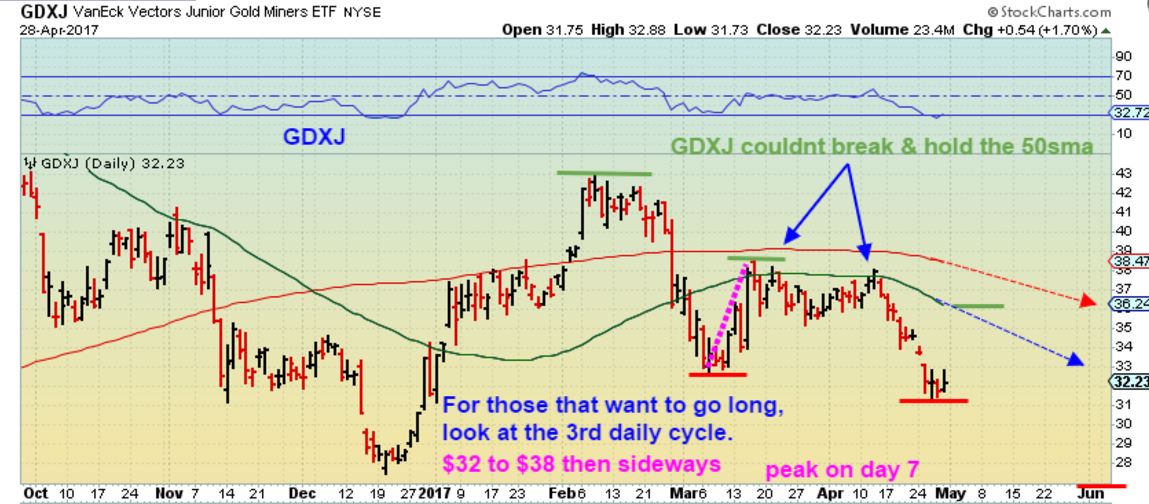
SO am I just bearish longer term on the Precious Metals? NO I am not. I am actually thinking that the 2nd half of 2017 could be excellent for the Miners, and I plan on taking full advantage of the set ups that present themselves. The problem is ‘Timing’, and I do not think that a possible rally at the FOMC meeting is the right time to go long and just ride it out. We may get a tradeable low, but even if we do Rally after the FOMC meeting, I am expecting a deeper sell off later in May. That drop would begin to set up the Precious Metals Market for another great run.
I am going to try to post more regularly, so if you are not signed up on our free email alert, please do so. Whenever I post a public report you will receive an email notification.
I also encourage any active traders, swing traders, Gold Bulls, etc. to sign up in the premium section for reports that come out daily, plus a weekend report. Adding my analysis to your own trading plan can be helpful. As you can see from the above charts, The General Markets were quite choppy this spring and it has been a very tricky time in OIL, Energy, and Precious Metals too. Gold was very bullish this spring, Silver looked bullish, so many were buying Miners right before the sell off. The Miners were not about to play ‘catch up’, as many thought that they would. Reading my reports would have been a good cautionary reminder of that.
Future reports can be used with your own analysis to help you make some very good trades too. As mentioned, I am expecting one of the best set ups of the year for Precious Metals, it’s just a matter of ‘time’. 🙂 Thanks for reading along!
Chart Freak Premium
Chart Freak members receive up to 5 premium reports per week covering a wide array of markets. Come and join the ChartFreak community as we trade the new Gold Bull Market and various trending sectors.

A few of our more recent stock picks that are still acting correctly.
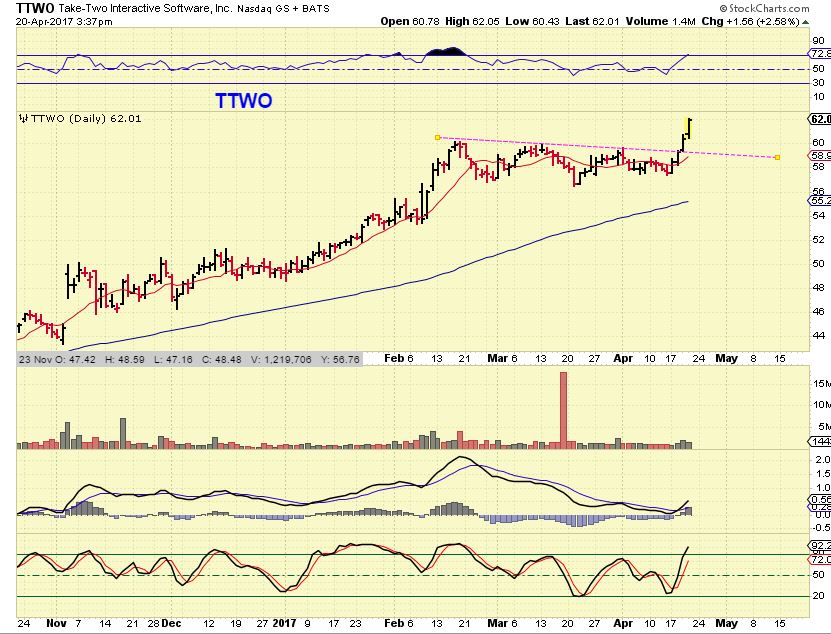
TTWO – Follow through on the break out
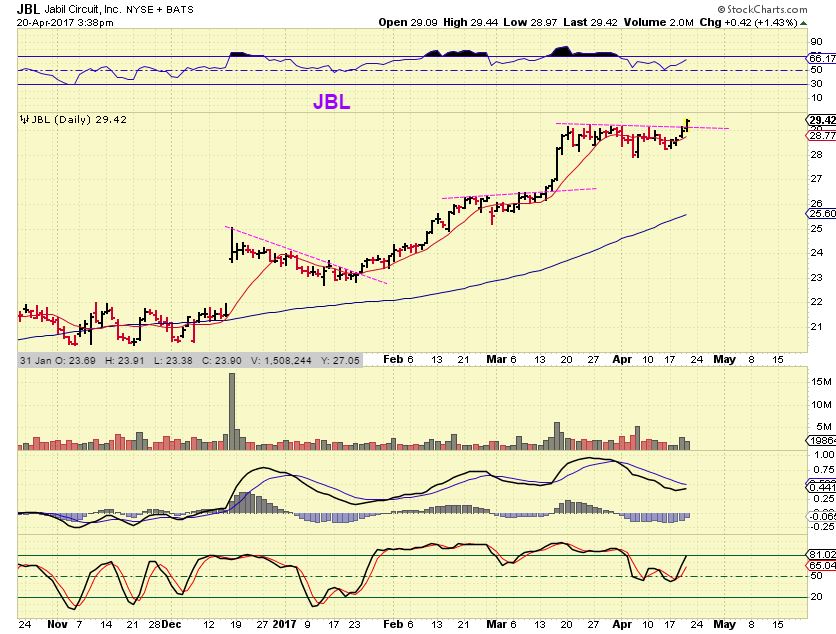
JBL breaking out
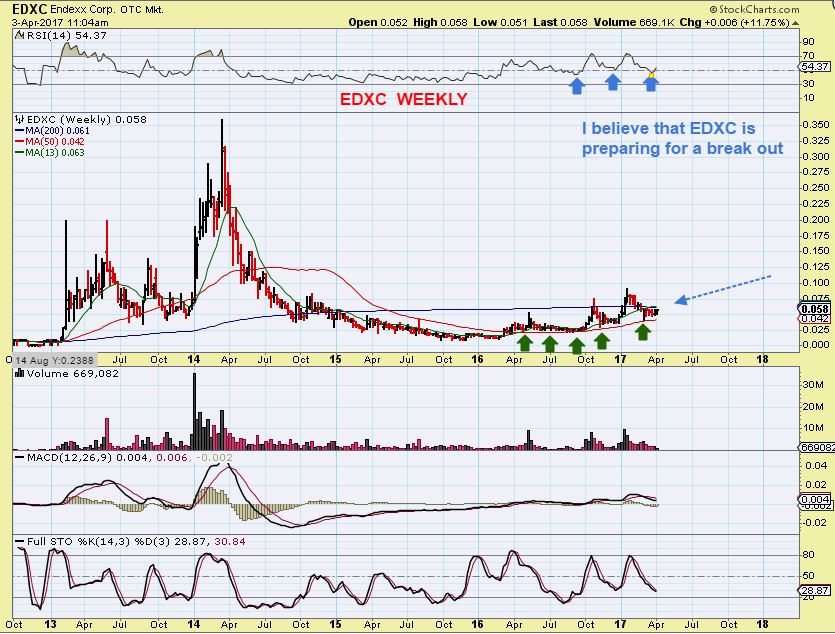
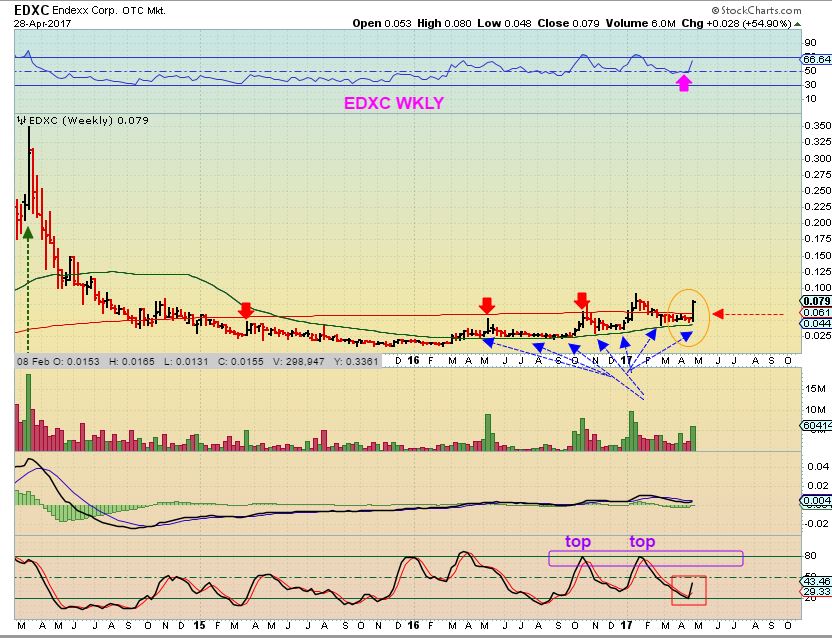
EDXC – This is actually a longer term BUY & HOLD experiment . It was purchased at 3 cents originally, but there have been places to add along the way, since it does remain bullishly set up, though the progress has been a tad slow at times.
APRIL 3 – I posted this as a squeeze play that looked bullish
APRIL 26th, it started to pop
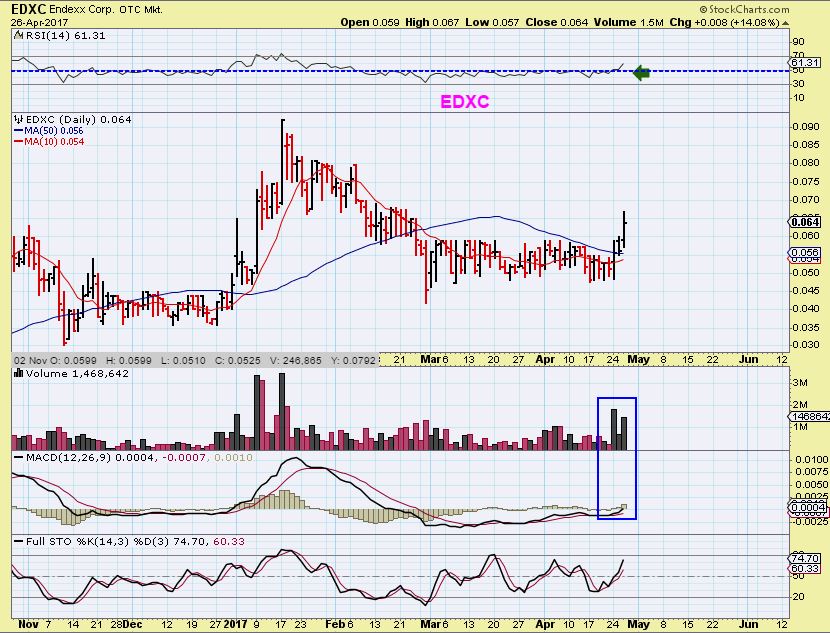
Last week – I love the long base and the set up remains bullish.
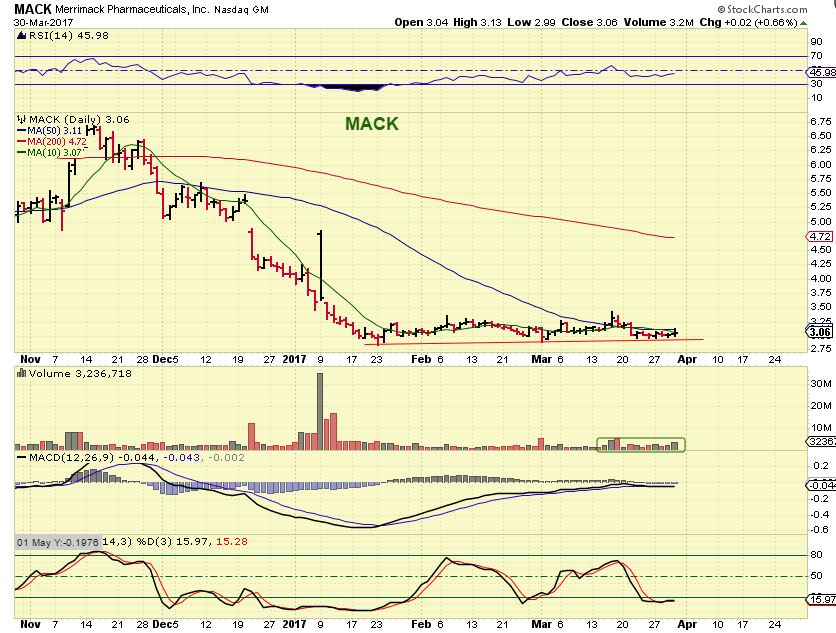
MACK – inside of a base, a low risk entry
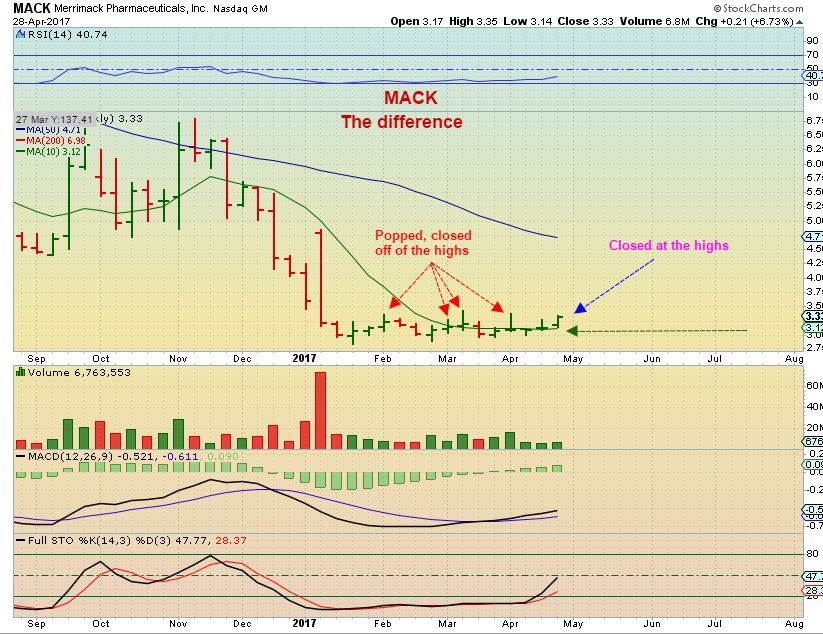
MACK last week.
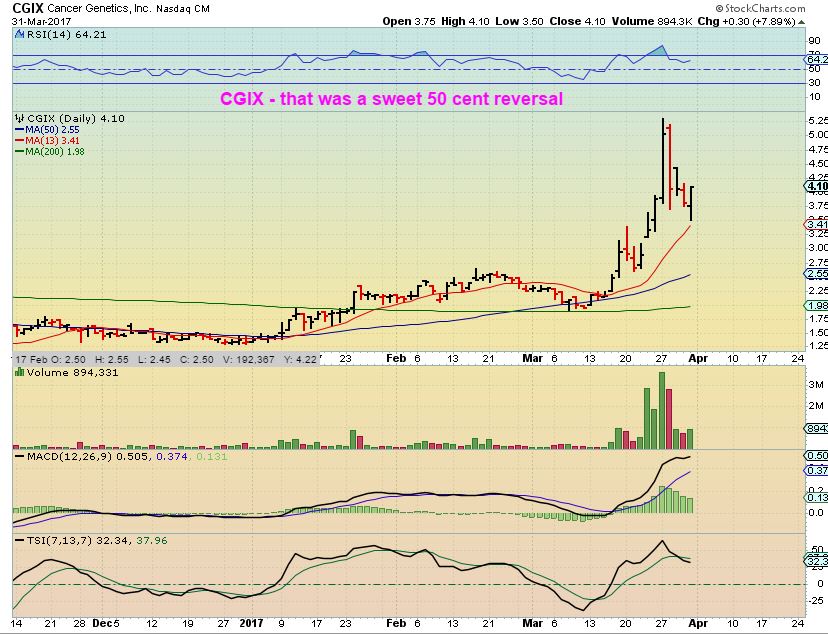
CGIX -We bought before the break out and this back test
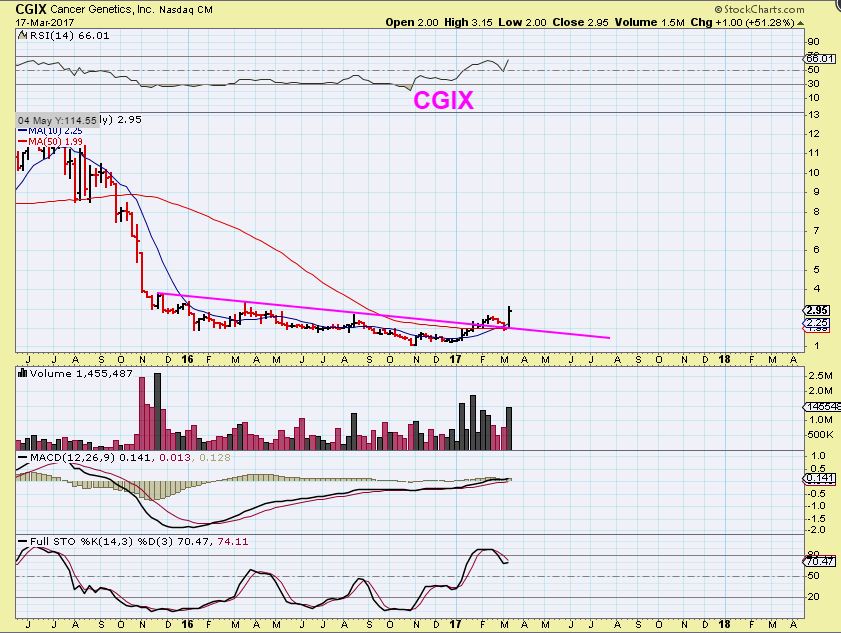
CGIX – It had an excellent run from there, up over 150% at one point
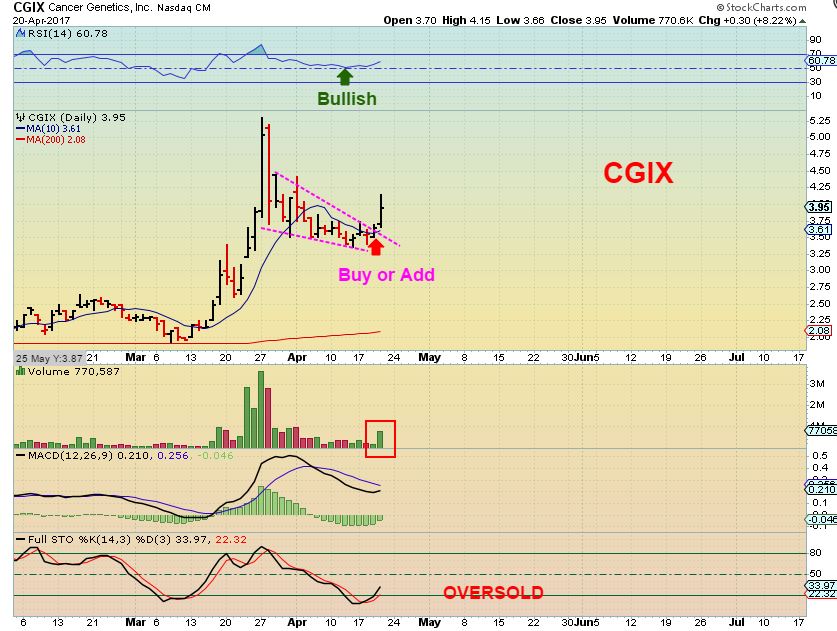
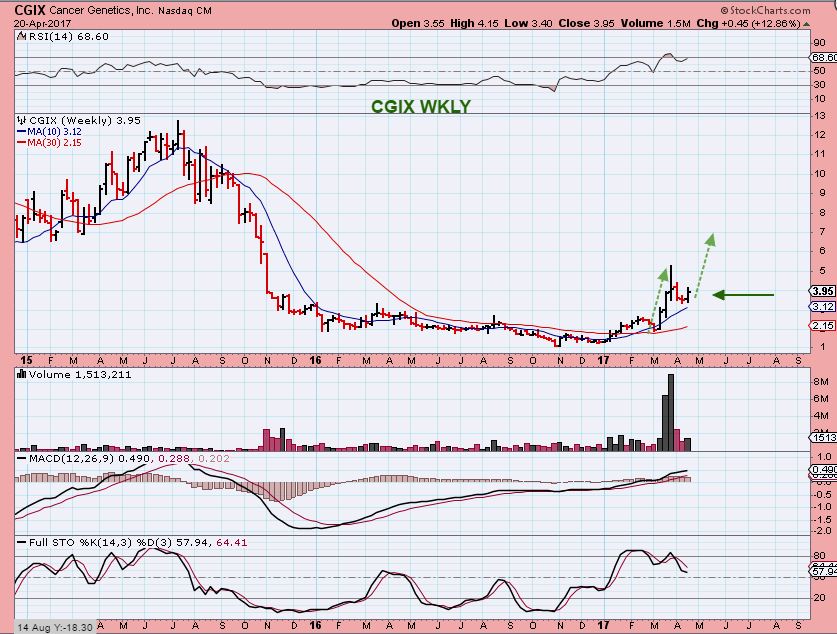
CGIX – Buy or add to current positions near $3.50.
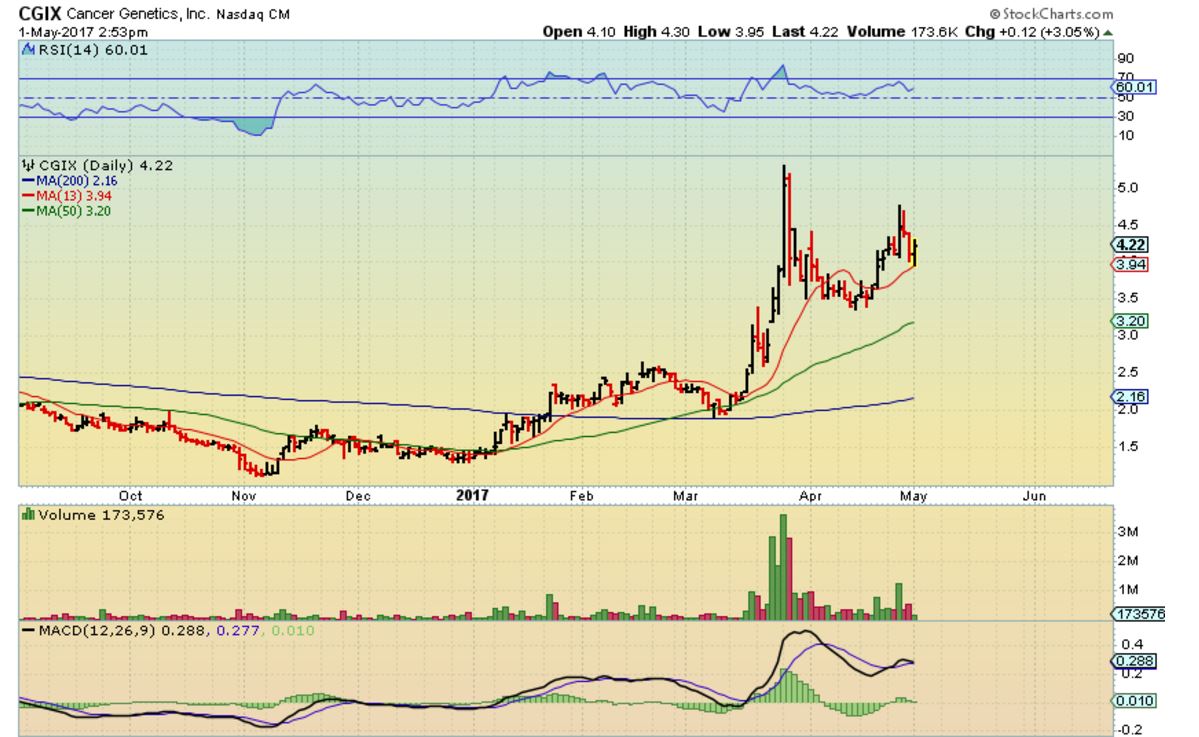
CGIX Currently – So far so good, but the MACD looks to be weakening. This can consolidate for a while longer if things do not strengthen. It has been an excellent trade though.
April 29th – Sounds Like A Plan 
 Tuesday May 2nd
Scroll to top