You are here: Home1 / Public
I AM RELEASING MY PREMIUM EDITION WEEKEND REPORT TO THE PUBLIC, IT IS MORE OF A BIG PICTURE VIEW OF THE MARKETS, ENJOY!
In baseball, the simple call that this is " The Bottom of the Ninth' means that the game has entered the second part of the ninth and final inning. Unless there is another rally that extends the game, we reach The end of that game. For the team worried about going home with losses, it is the beginning of the end, unless this final opportunity provides a winning rally ( or at least extends the game into extra innings).
Could the General Markets be nearing that time? I'm not necessarily talking about THE TOP, but maybe the end of this winning run and a consolidation period would follow? Maybe, lets discuss this further.
.
In my last 'Weekend Report' we took a deeper look at the 'Big Picture', because we had additional views to examine at the end of March. This gave us not only a weekly view , but also the end of the months Monthly view, and also a Quarterly view. I went over that report today and it did point out that behind the beauty, cracks appeared. This week the cracks continued, and though I do not think that necessarily signals The End of the Bull Markets season, We could be in the Bottom of the Ninth for this run. Let's look at our Big Picture View...
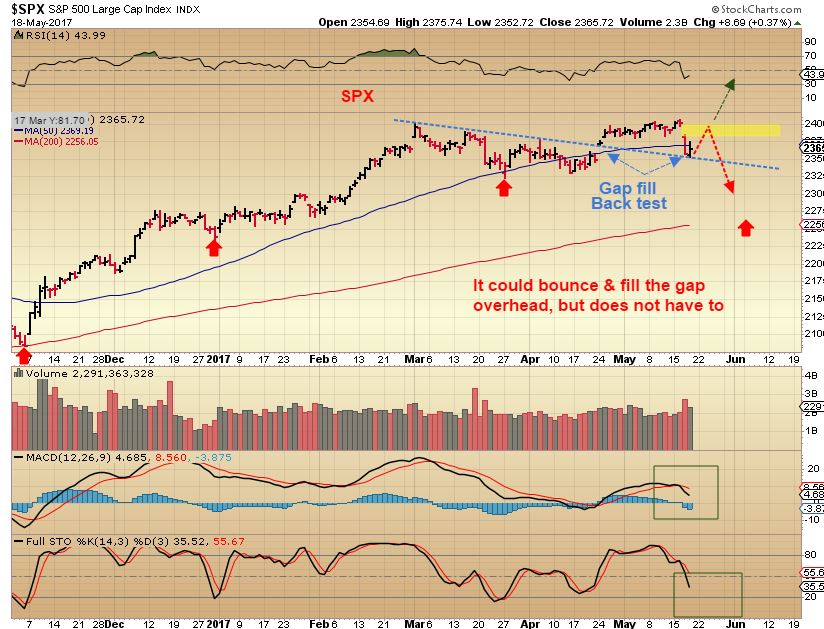
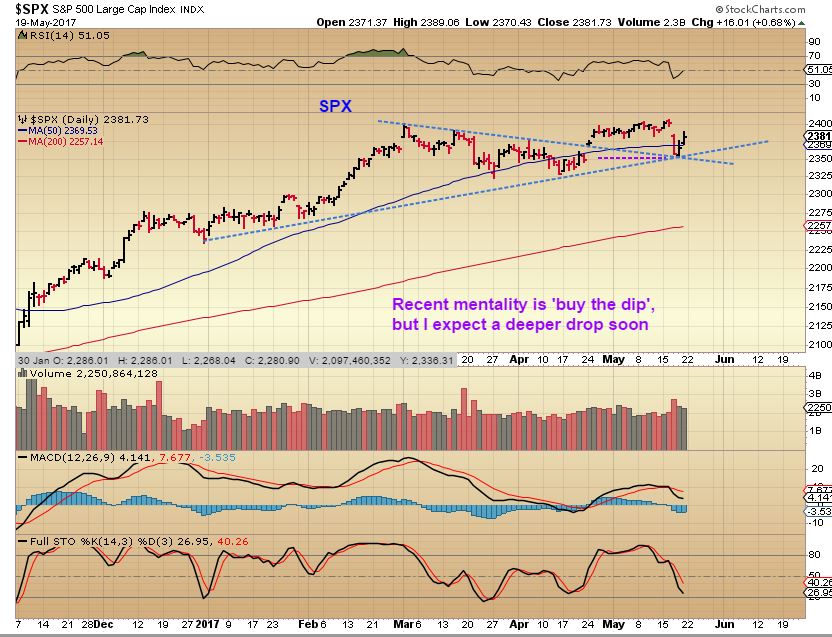
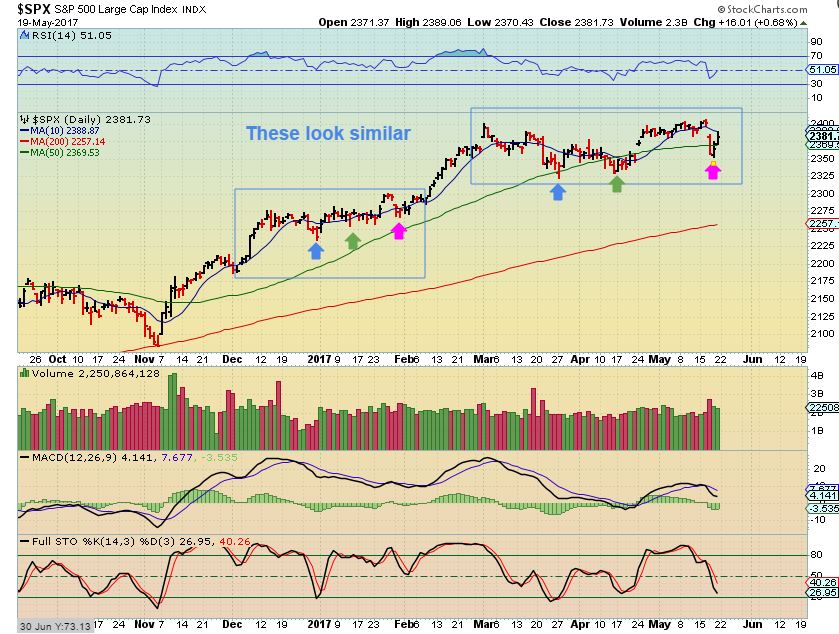
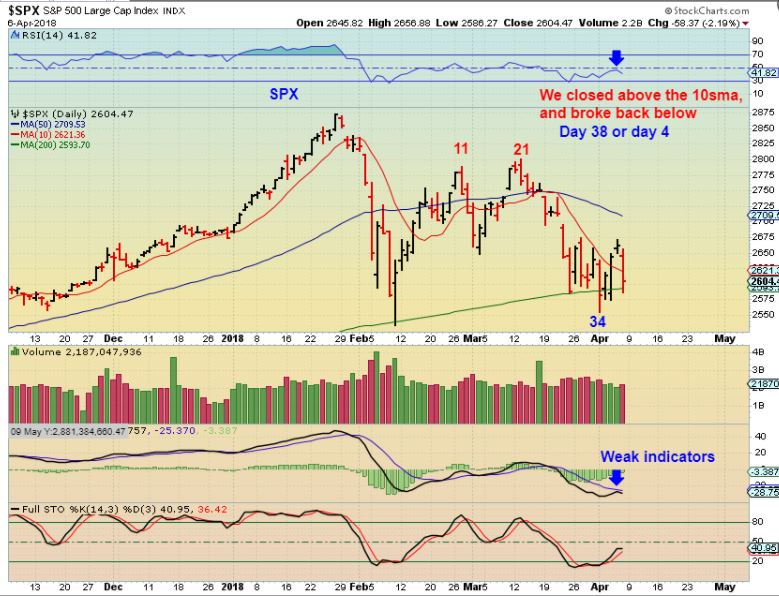
SPX DAILY - This is our daily cycle count, with the most recent low of the SPX still at day 34, and it looks like we have a dcl when it closed over the 10sma. Could that change? Unless buyers step in on Monday, I'd say that another 'shake out' dip below the 200sma is not out of the question into day 40 + and here is why I say that...
 Read More
 A large part of my weekend report was directed to The USD, Gold, Silver, & the Miners. We caught the lows in December and have been investing in various Miners (& JNUG/NUGT) since even before Mid December. In the daily reports I discuss various bullish set ups and buying opportunities, but each weekend I often take a step back and give it a good ‘Big Picture View’.
I want to share some of this weekends report here. Things are playing out exactly as I have been thinking they would, and this is a good time to share some thoughts about it with you here. Thanks for checking in, and enjoy…
USD
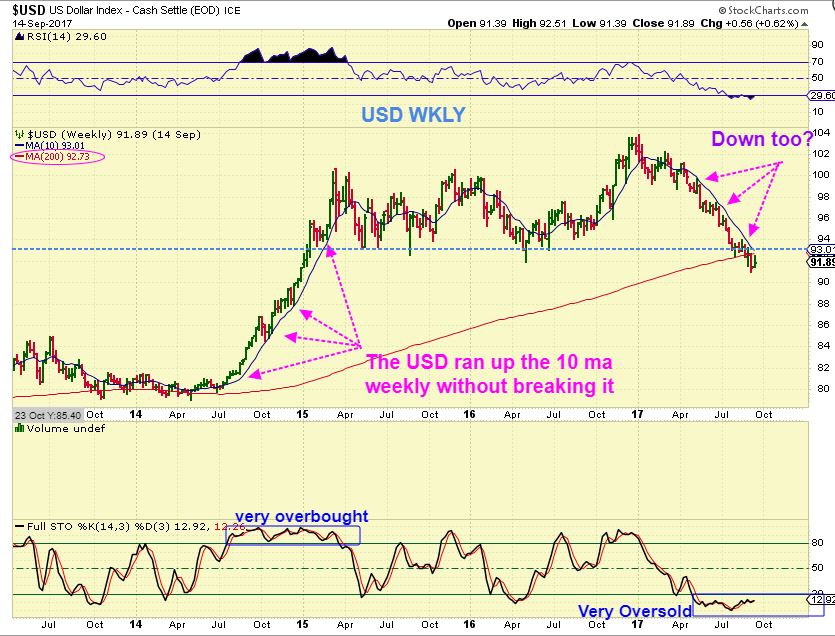
MY USD CHART FROM SEPTEMBER – If you have been with me for a while, then you know that a break down in the USD is exactly what I have been expecting around the end of 2017. The USD broke below the 200 week MA and after a bounce I expected it to roll over. This would be a catalyst for the Gold Bull to continue running higher.
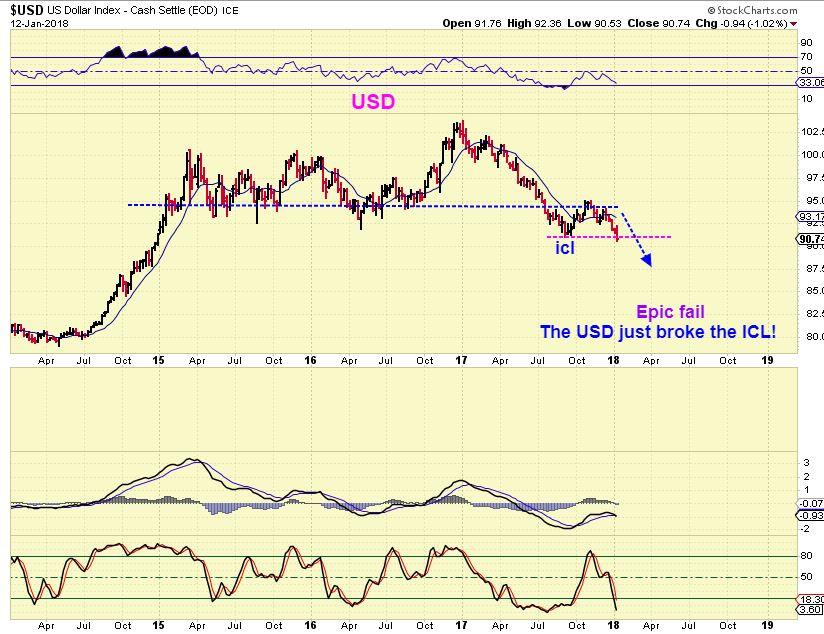
USD CURRENTLY – The USD did bounce, and then dropped below the ICL/YCL from early September on Friday. THAT is a Failed Intermediate Cycle and can lead to much lower prices over time. This is a weak USD, and that bodes well for Precious Metals.
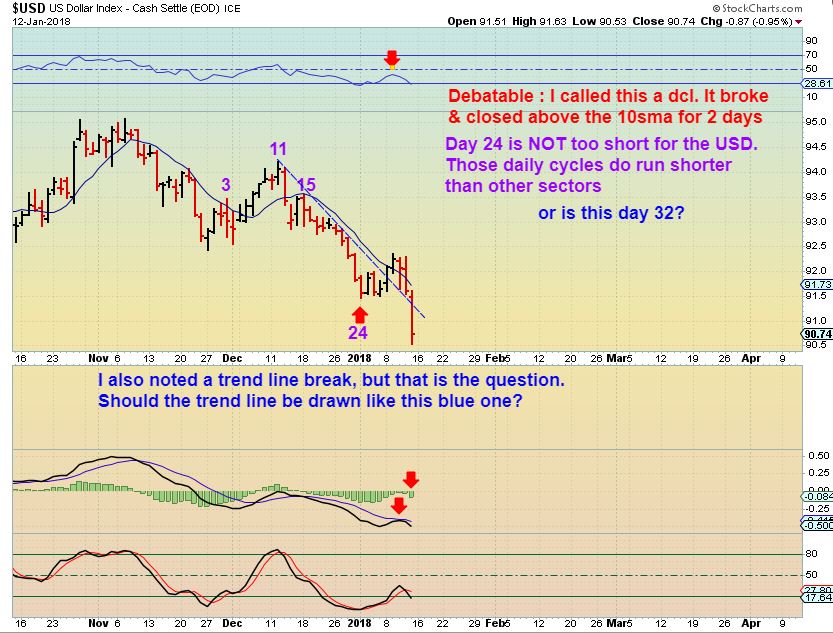
USD DAILY – about 2 weeks ago I drew the USD as having a dcl on day 24. If this just rolled over with a day 5 peak & this is day 8, then we have a ways to go on the down side. It also MIGHT be an extended daily cycle and the dcl is not day 24, it would still be ahead. Either way, the USD is showing weakness.
As December rolled around and GOLD & SILVER were selling off, I noted that several Miners looked rather bullish despite the selling. Gold & Silver stocks looked to be ‘On Sale’, and I posted charts of several bullish set ups in Miners.
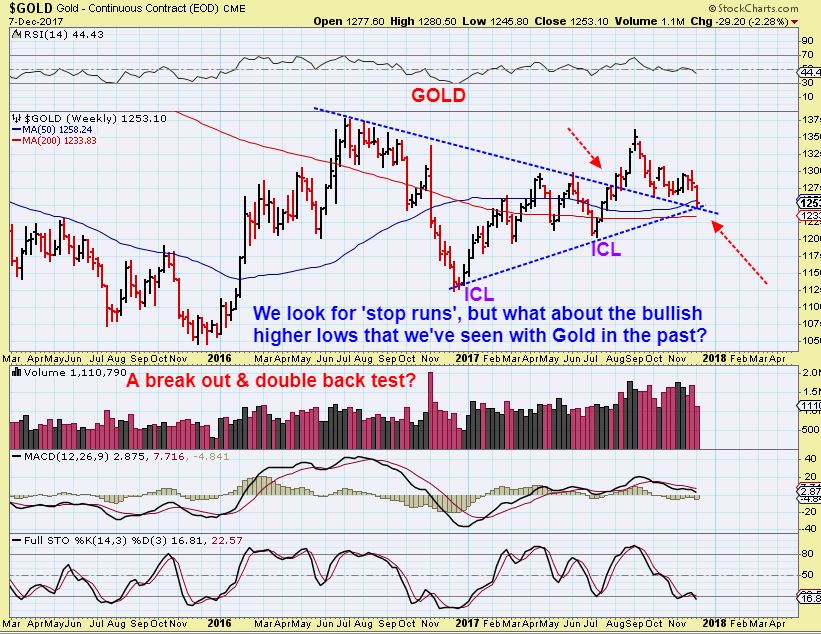
 GOLD DEC 7th – I was still being cautious in early December before the FOMC MTG, but we were hunting for that next important ICL (low) to show up soon.
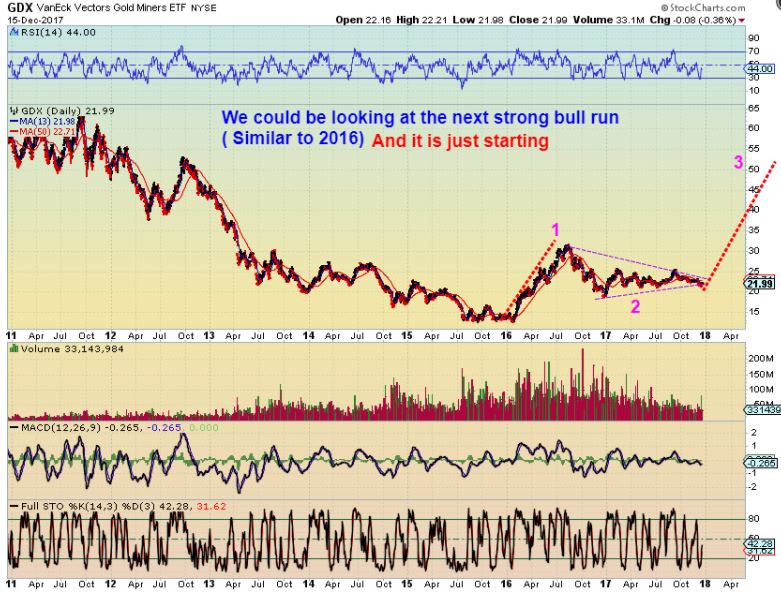
GDX DEC 15th Daily – To give my readers a look at the risk / reward, I posted a few charts like this one below. Even if you were still ‘cautious’, you could start small, use a stop, and ‘add’ to position as this proves itself. I mentioned that I bought JNUG after that FOMC meeting.
GOLD – So far the run left many behind that have been waiting to ‘buy the pull backs’. What pull backs? Timing-wise, we are getting close to a seeing a ‘pull back’ into the next daily cycle low however. A normal dip in a bullish run.
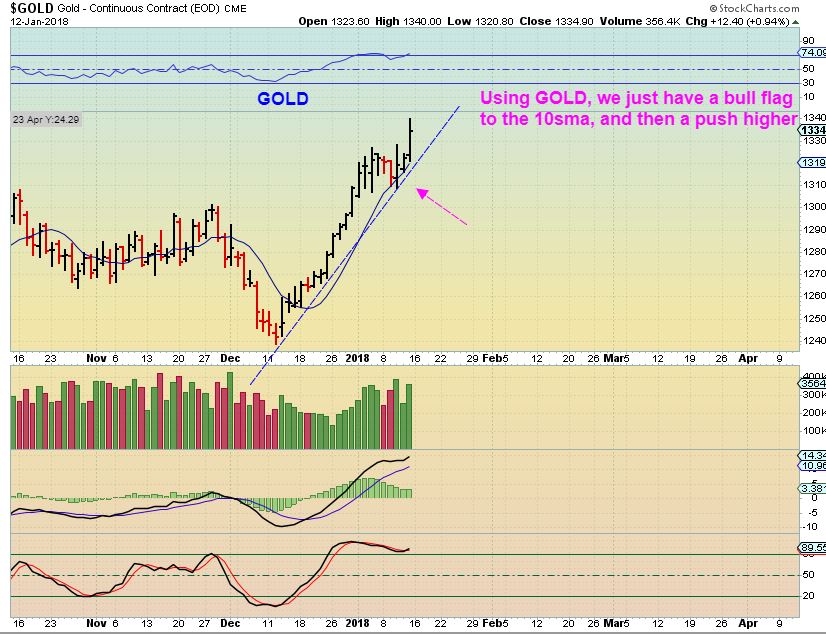
GOLD – We are staying focused on the big picture, and this intermediate cycle has not peaked yet.
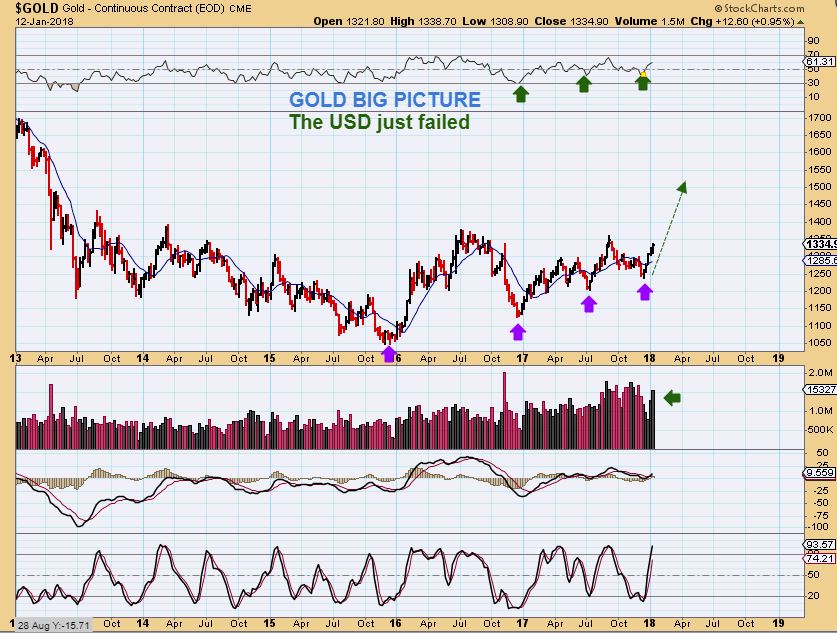
Higher Cyclical lows ( ICLs) in Purple for 2017 are bullish. This 5 yr chart actually looks like a Giant base in recovery mode.

SILVER – Silver is on the verge of a major break out, and when silver & silver stocks run, they usually run QUICKLY.
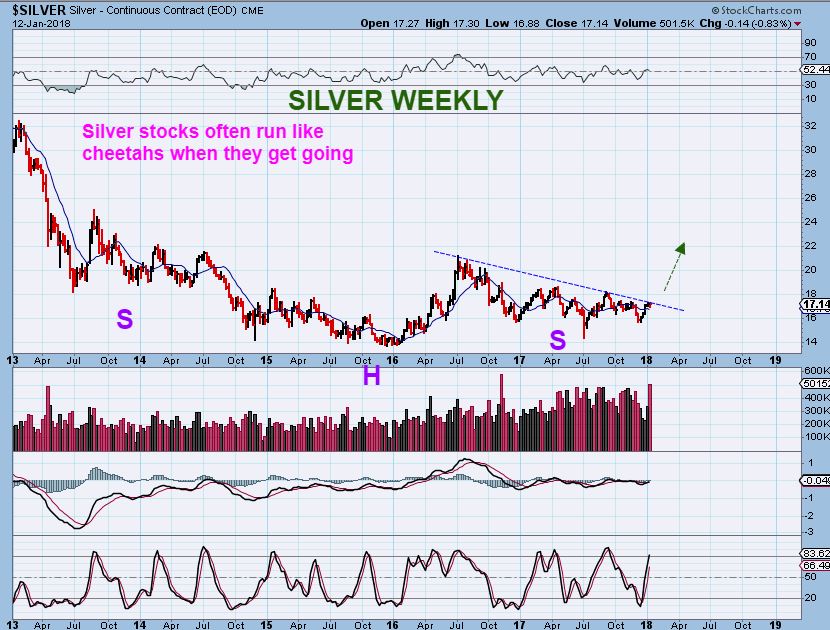
SILVER – Look at 2003 when Silver got above the 200 weekly sma, buyers loved it. We seem to be at that point again.
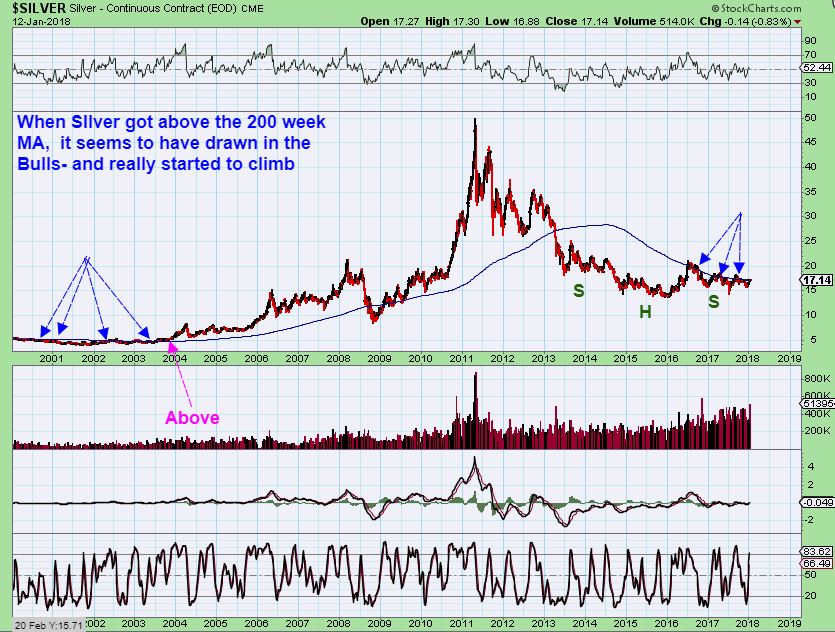
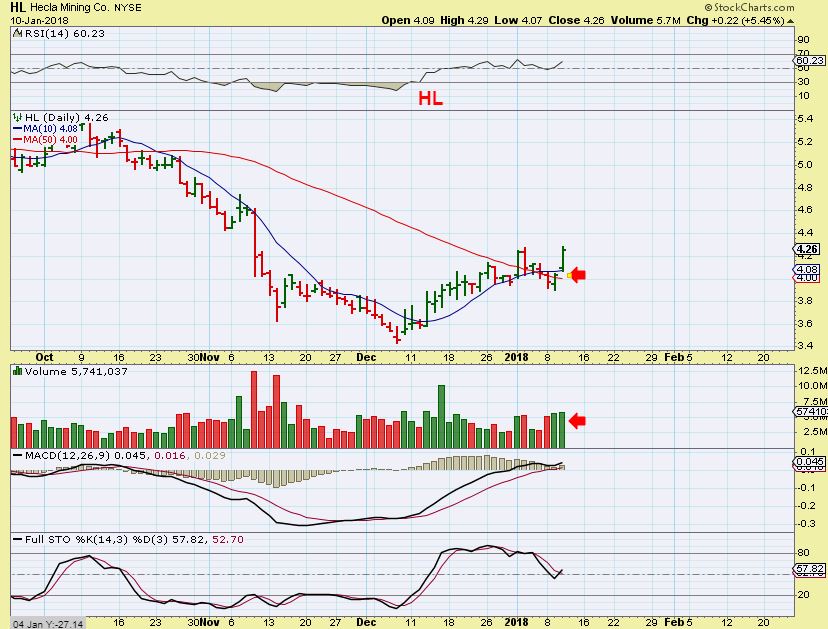
Last week using this & other charts, I discussed buying a variety of Silver stocks, because they popped on Jan 10th while Silver was down. Did you notice that when it happened?
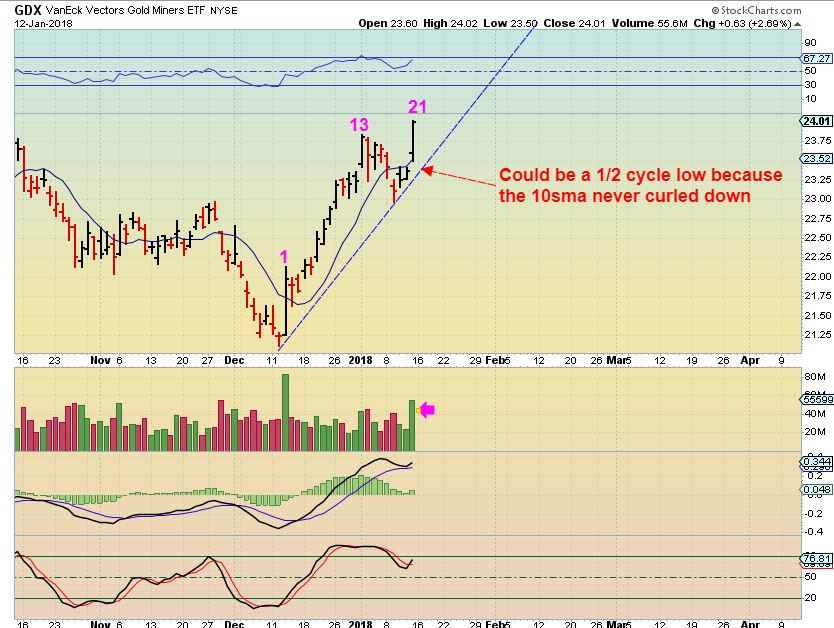
GDX – I see this as a 1/2 cycle low and we did NOT sell as this dipped. Why not?
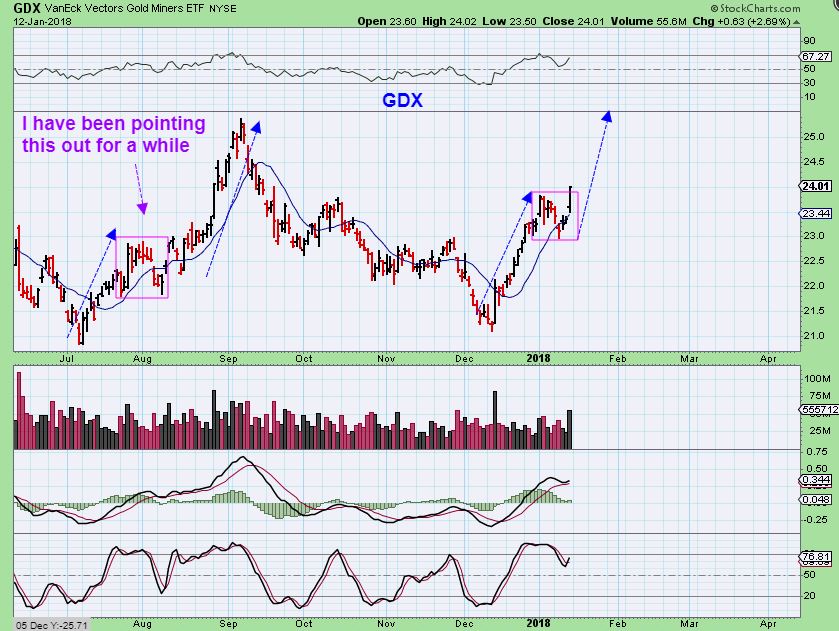
GDX CHART FROM JAN 8th – I had been pointing out ( red boxes) a possible ‘stall’ or ‘dip’ as a guide for my readers, comparing it to the one in August. We were expecting this recent choppiness.

GDX CURRENTLY – This dip still looks similar to what we had in July, and you can see that the 2nd rush higher was better than the first. We may not go straight up from here, that is just how bulls will try to kick you off.
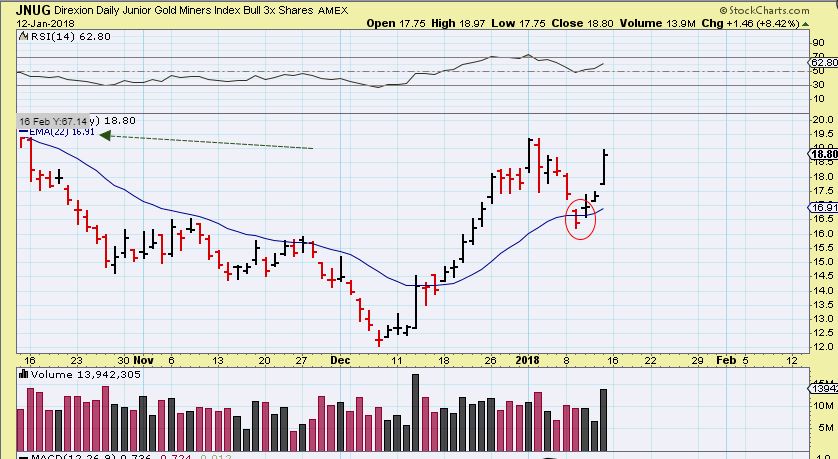
JNUG – I have owned JNUG since the 13th of December. I also added when the ICL was confirmed. I expect higher price over time regardless of these short term wiggles.
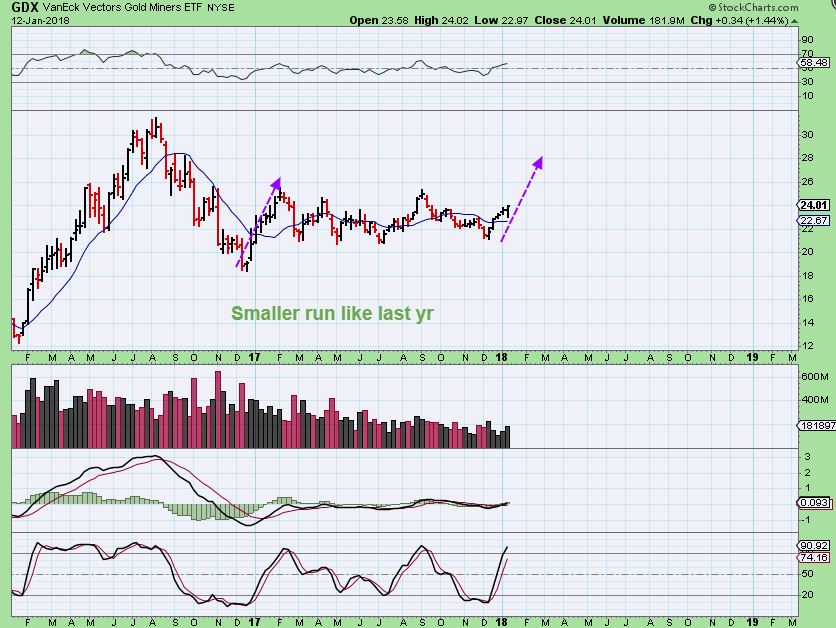
GDX – Even a smaller run similar to the Dec 2016 – Feb 2017 run would be a bit longer than what we’ve already seen in this run.
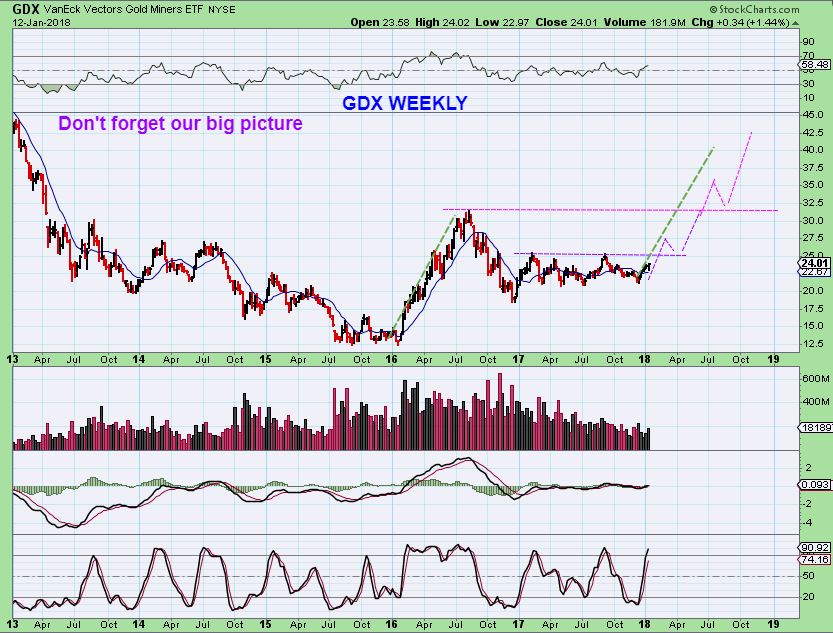
GDX WKLY – OUR BIGGER PICTURE POSSIBILITY – Is that a multiyear inverse H&S? This is NOT out of the question if we have a 6 month run like the 2016 run.
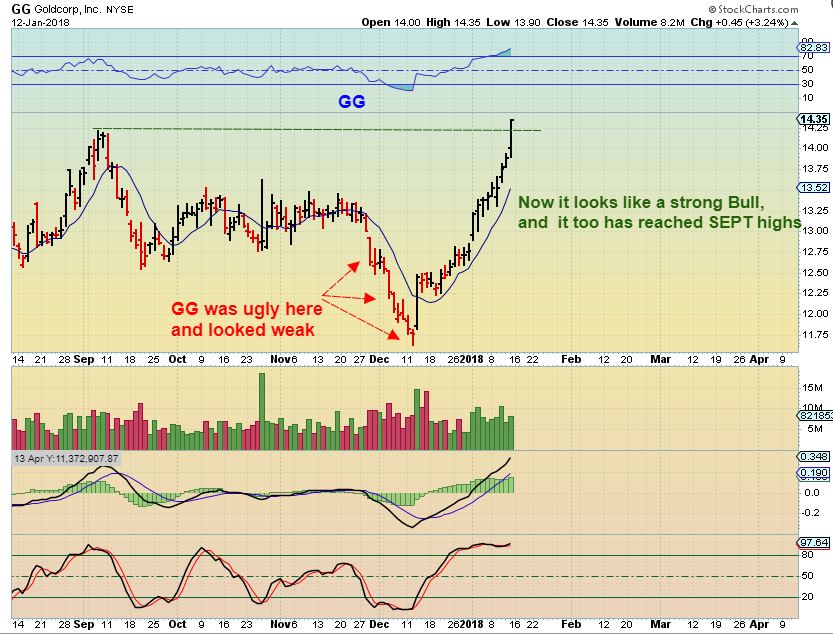
GG – GG went from weak and ugly in Decembers sell off , scaring buyers away. Then it became very strong. If you were ‘expecting’ the lows then too, you may hve caught this run.
CDE – Jan 2 was a buy for CDE under $8, as it was breaking above the 50sma.
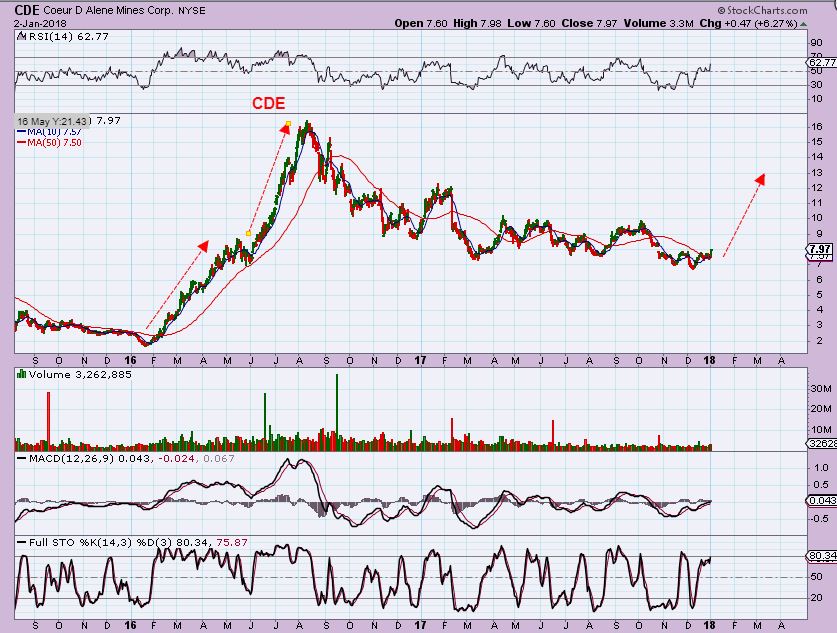
The BIG PICTURE FOR CDE – What if we get another run like the 2016 run? This summer if CDE is at $22, we will all wish we bought it now at $7 or $8.
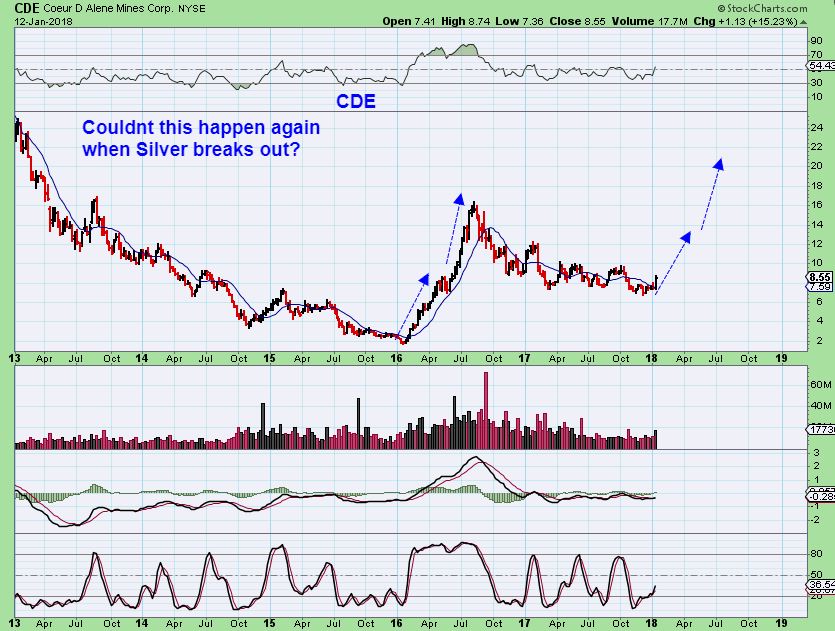
I still have people telling me “Miners are in a bear market, it is too risky! These could sell off at any time. “. I understand that people have been burned by the miners at times, but ‘timing’ is everything. Cycles can help you to know when it is safer to enter & even exit. We have made Great gains at ICl’s and we caught the entire 2016 Run higher.
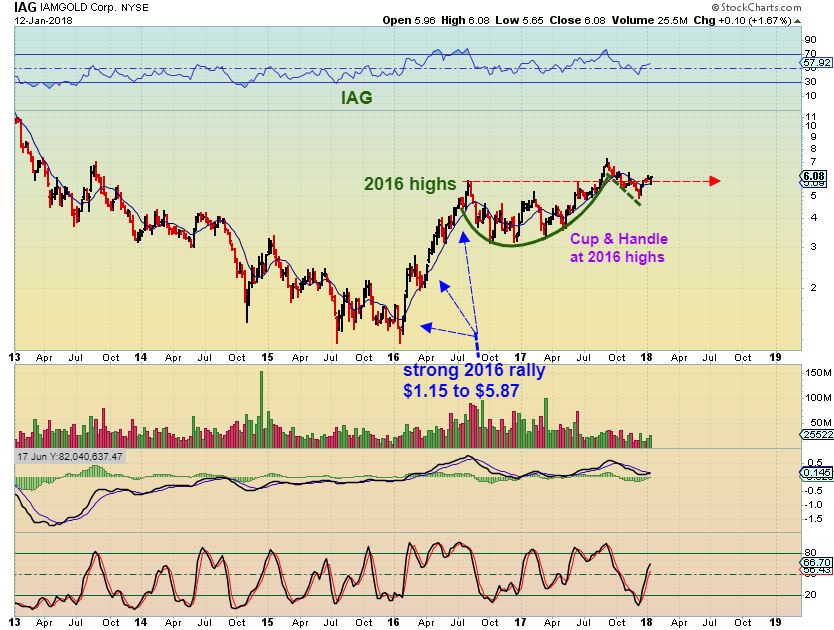
Not only that, but take a look at something that I also point out to my readers using various Miners charts. We’ll use IAG for this example:
IAG WKLY – Is this stock still in a bear market sell off ? I don’t think so at all. IAG is back at the 2016 highs, and I see a bullish Cup & Handle pattern.
Conclusion for Miners:
Some miners have had excellent runs higher, but they may be getting extended at this point. Some are due for a pullback, while others may be just getting going, so I don’t just encourage jumping into just any ole Miner right now. I usually have lower risk set ups in the weekday reports as they present themselves, often after a small pull back.
Also, using ‘cycle timing’ Gold will be coming due for a drop into a daily cycle low soon enough. Would you like a 2nd set of eyes to help you to navigate through the coming weeks or months ahead? I will be covering this sector in the daily reports, so as things continue to unfold, you will be informed. Why not sign up for a month or a quarter and make money with us here at Chartfreak? We also have a ‘comments’ section or chat section where many experienced traders share ideas.
.
This portion of my weekend report is only a fraction of the weekend report that was posted in the ‘Premium Members’ section. That one actually consists of 45 charts this weekend, including individual Miners, SPX, OIL, NATGAS, and more! It may be worth trying it out for at least a month, and see if my analysis combined with your own trading experience or views, can help you to become more profitable. 🙂
To sign up, click here
CLICK HERE
Thanks for checking us out!
~ALEX
OIL
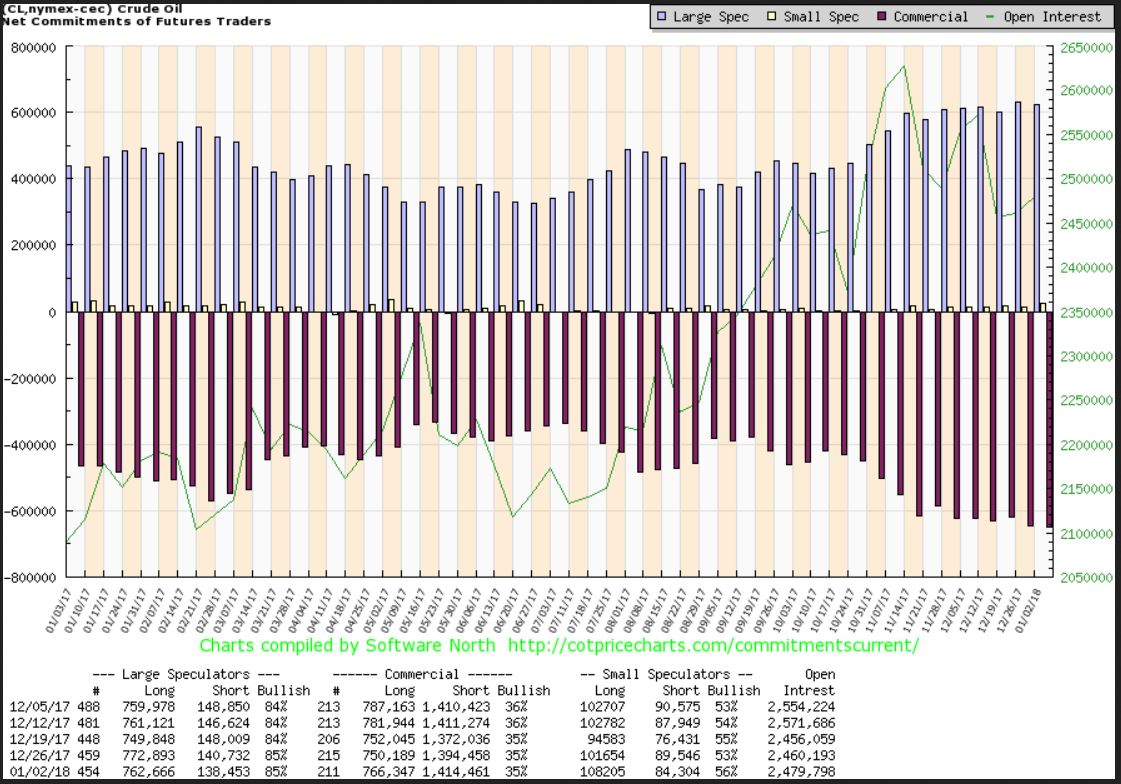
OIL's C.O.T. - The shorts by 'Smart Money' increased again. They are determined to ride a drop in Oil prices, though Oil has been bullish in recent weeks.
 Read More
 I have decided to release the Premium Dec 28th Premium Report & a bonus Bitcoin report at the end, to the public. Enjoy!
This is the regular market report, with an extended section on Bitcoin / Cryptocurrency at the end. The Bitcoin section will be released to the public later today too. For now, let''s review some of the areas of interest in Wednesdays markets.
SPX - No change in expectations from yesterday.
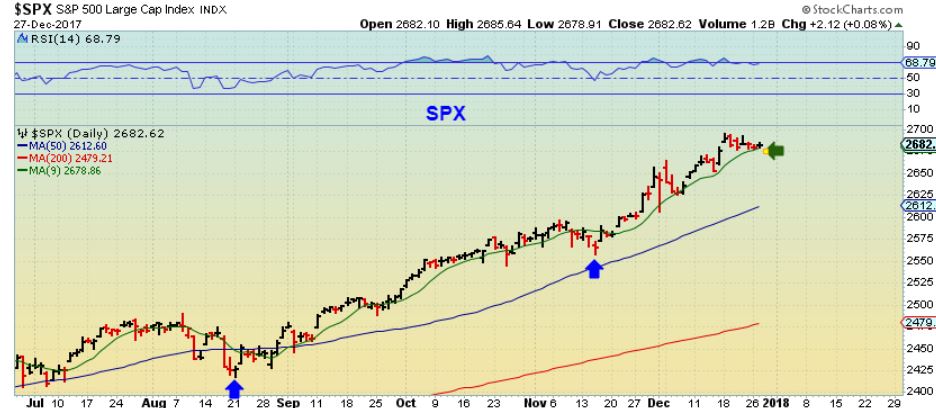
You want to keep this in mind though...
Read MoreMy last public post last week discussed Bitcoin & Blockchain trades. They have been absolutely explosive, some trades running up 300-500% or even more. On Monday (in my premium section) I then went over some of our current trades, and discussed the idea that Bitcoin could go parabolic and then crash down, so caution would be warranted.
Does a parabolic move and crash mean the end of Bitcoin? No it doesn't, so before we get into a debate about whether or not BITCOIN is in a bubble, and whether a 'Bubble' phase means that this is the end of Bitcoin or not, please read on and then see how you feel.
Read MoreNOTE: Please keep in mind that this report was written last week as a premium report, while Bitcoin was between $7000 & $8000. Bitcoin almost hit 10,000 this weekend, and a follow up premium report was posted on Monday. The following report gives you an idea of how we were viewing the blockchain charts. It also briefly discussed OIL, the XLE, Gold & Miners.
.
While waiting patiently for the Gold market to set up properly, we have been trading other areas, and one of those areas recently has been the Blockchain trades. I mentioned that I had been trading these on the side, watching how they play out, seeing if they act as expected, before including them in the reports. Well, they are quite volatile, but I was having success trading them, so I came to the conclusion that they were trade-able and that maybe I should put them in the reports with a small warning about risk last week. So we started trading Blockchain last week.
I'm not sure who decided to take these trades with me, and who watched from the sidelines, but I want to review some of these explosive moves (and gains) and point out a couple more set ups that may be ready to follow the leaders.
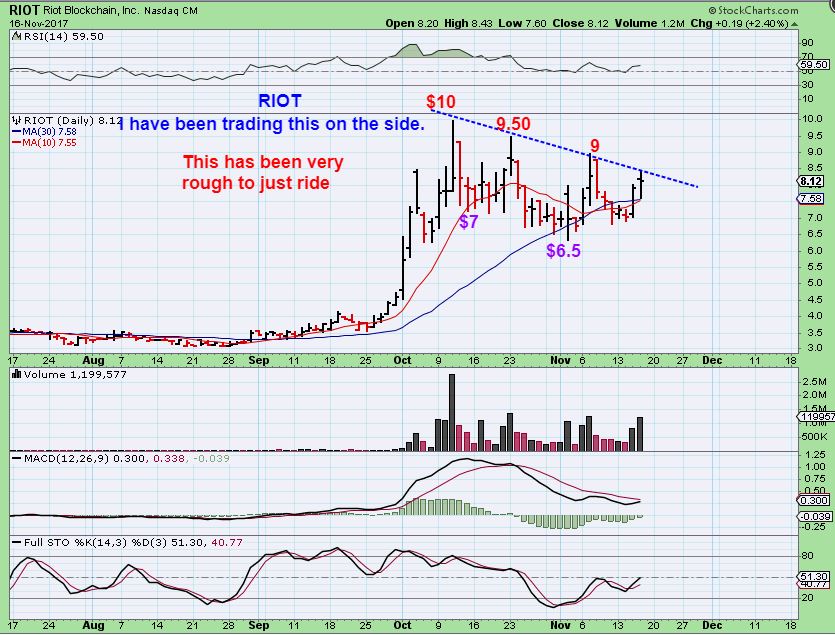
RIOT - This chart showed a consolidation that I had been trading with BIG SWINGS. After a series of lower lows, we see a higher low Nov 13 and it looked ready to break out, so I Used this chart as a buy and...
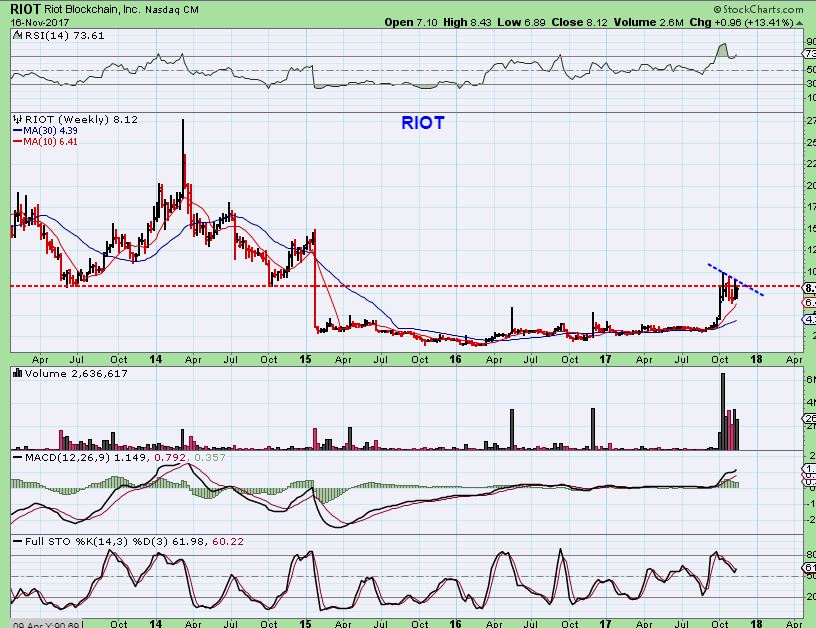
RIOT - This chart to show the bigger picture potential. I named a couple of upside targets that sounded kind of ridiculous, like $14 & $16, even in the $20's.
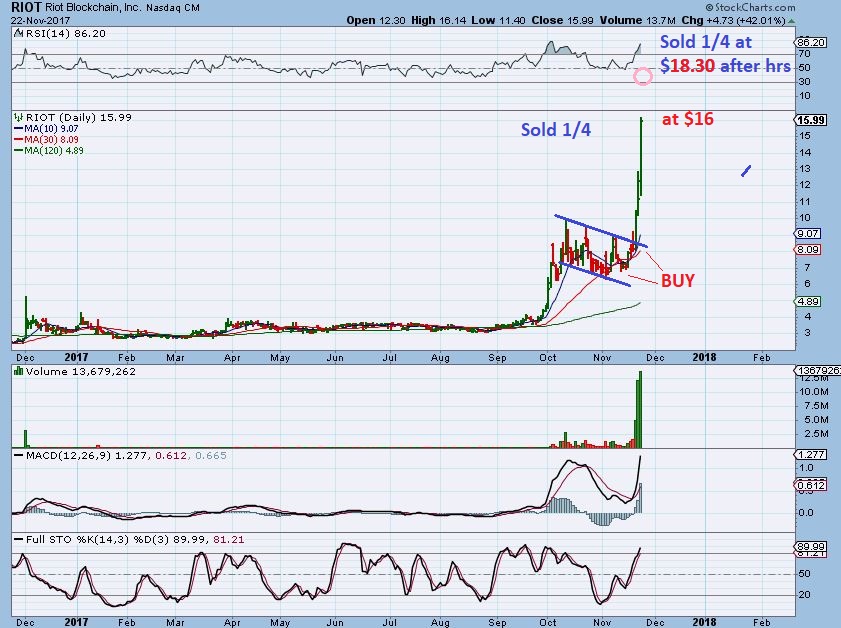
RIOT - I sold 1/4 of my position at $16 & posted that in the comments section. Then it after hrs, it continued to ramp up and was at $18.35, so I placed a sell for 1/4 at $18.30 & it sold immediately. I mentioned this in the comments too, so that others could follow if they wish.
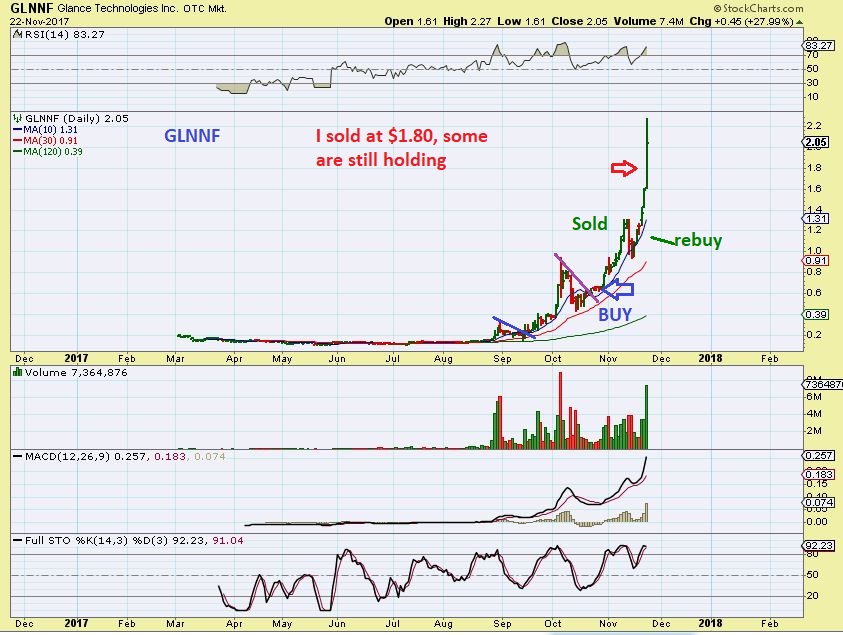
GLNNF - GLNNF, RIOT, and PRELF were the main ones that I traded as an experiment. GLNNF has been very quick mover too, but they are also getting very exuberant and parabolic when they take off ( Bit coin is breaking new highs too). I sold this one a bit early every time, but with solid double digit gains. I mentioned this one near $1.20 I believe, and I sold it at $1.80 ( Red Arrow = early again) 🙂
So let's take a look at some other trade ideas in this sector...
Read MoreI AM OPENING UP THE WEEKEND REPORT TO THE PUBLIC. IT IS A LONG REPORT, SO IT WILL TAKE SOME TIME TO READ, BUT I HIGHLY RECOMMEND IT. IT IS A BIGGER BIG PICTURE VIEW. ENJOY & THANKS FOR CHECKING IT OUT!
This weekends report is going to be a bit different. I often give the Big Picture review, and with that, we have been discussing since last January the possibility of a Blow Off Top / Parabolic move resulting from the general markets' bullishness. Well, this is going to be an even Bigger Picture discussion, with a number of different Markets discussed. It is a long detailed report designed to answer many emails that I have received about the bigger big picture , so grab some coffee or tea and let's begin...
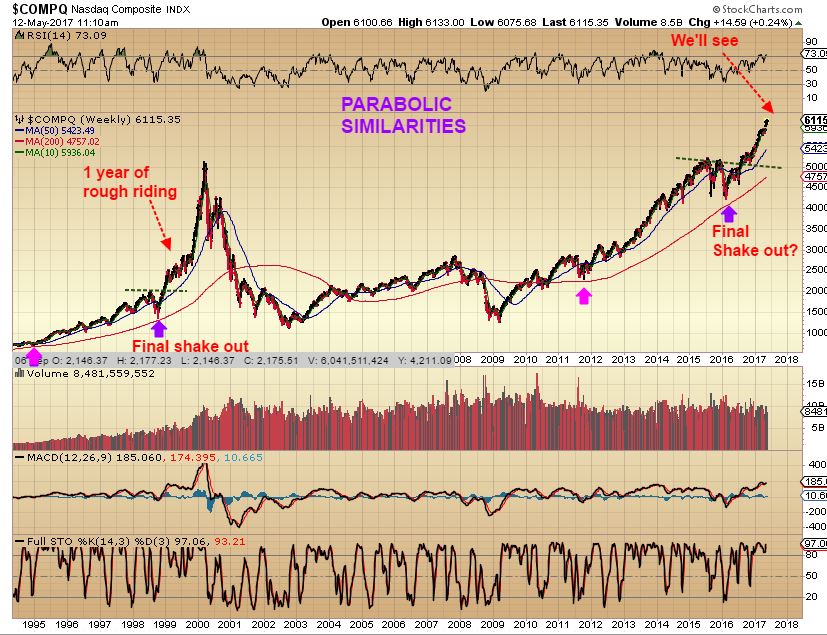
NASDAQ - This chart was from last May. I posted this idea of how the current rally that we were seeing could be becoming parabolic. Parabolic moves seem like they will never end, and you'll hear that "Nothing can kill this market", and it feels so true. Then suddenly, they die a brilliant death as you can see in the year 2000. See the chart below, where we examined similarities of a final shake out consolidation, a ramp up with somewhat choppy trading that would still having higher lows, higher highs, and then the final Ramp higher...
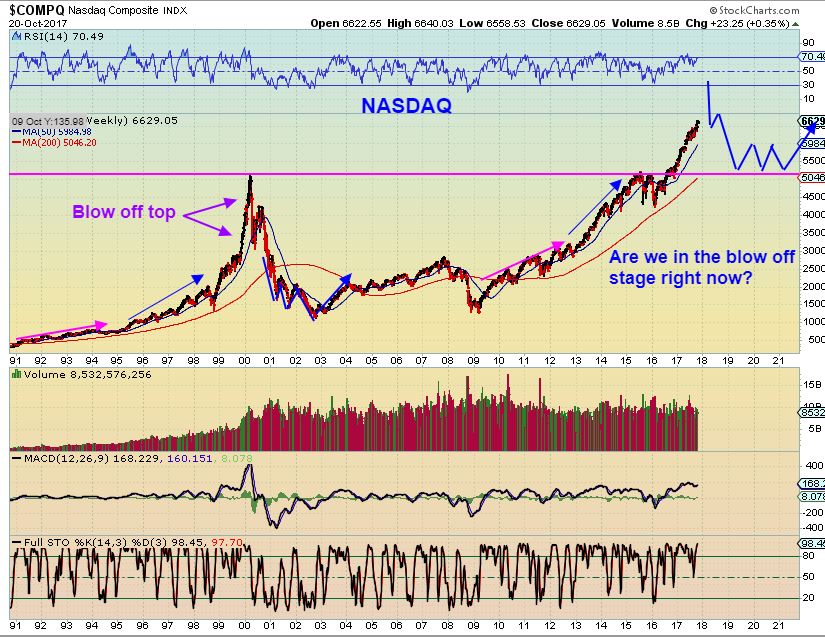
NASDAQ - Here we are now and the choppiness with higher lows and higher highs seems to be playing out now, and a blow off top would follow. OR, is this the blow off top in play as it just continues higher? This move is verticle and could lead to the blow off top. Just ride it long. I have drawn in a post blow off top scenario with a normal 'back test' of the break out. Let's dig in further...
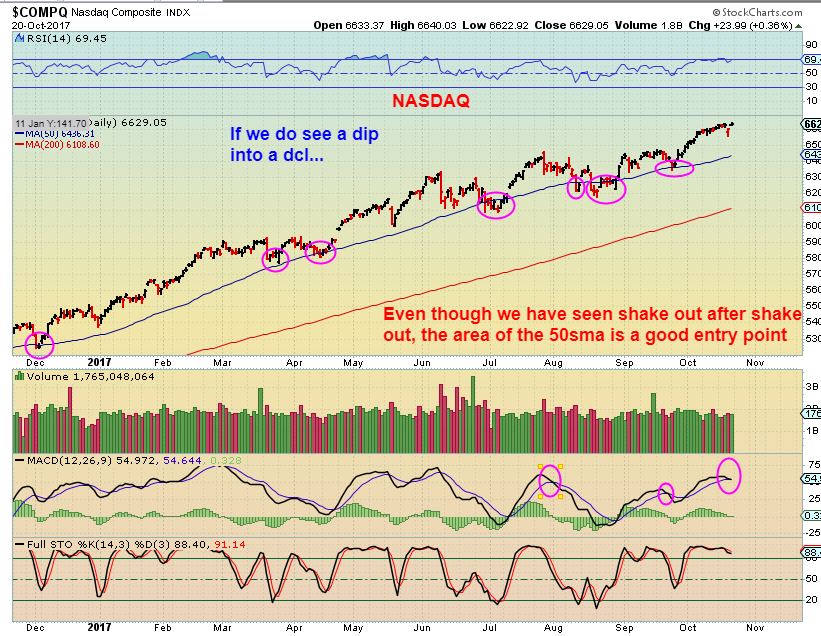
NASDAQ - Currently, the 'choppiness', when examined close up, is normal. I have advised buying with a reasonable trailing stop. Each dip to the 50sma can be bought as a low risk entry. Was that tiny dip the DCL, because we are so late into this current daily cycle? I'll show you why that could be possible later using the RUT AND TRANNIES. If it isn't a dcl, and we get a dip to the 50sma (even with a shake out there), that would obviously be a 'buy'- please read the chart. THis is a healthy strong bull run.
Now let's also look at the BIGGER PICTURE SPX, RUT, TRAN, DJIA
Read MoreI wanted to open up a slightly shortened version of this weekends report to the public. In the weekend report, I usually cover the action that we saw in all of the Sectors that we have been covering lately, and in the daily reports, these are updated and stock picks are also added, if the set ups present themselves. So even though the premium members will have a lot of additional information as things upfold, the Public should be able to get a solid idea of what we have been looking for, and how it has all been playing out. Enjoy this weekends report.
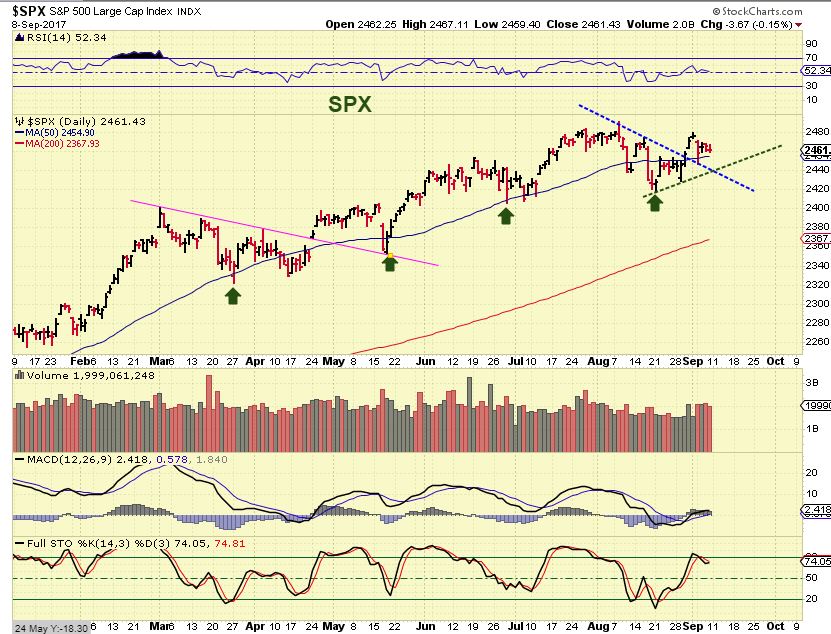
SPX- I will repeat, I never called the recent dip an ICL. It lacks the characteristics of one, but what I did say is that we have been overdue for one for a while. So we have a dcl, and similar to the last couple of dcls, the move higher has been a bit choppy, but we have higher lows and higher highs, so an uptrend continues.
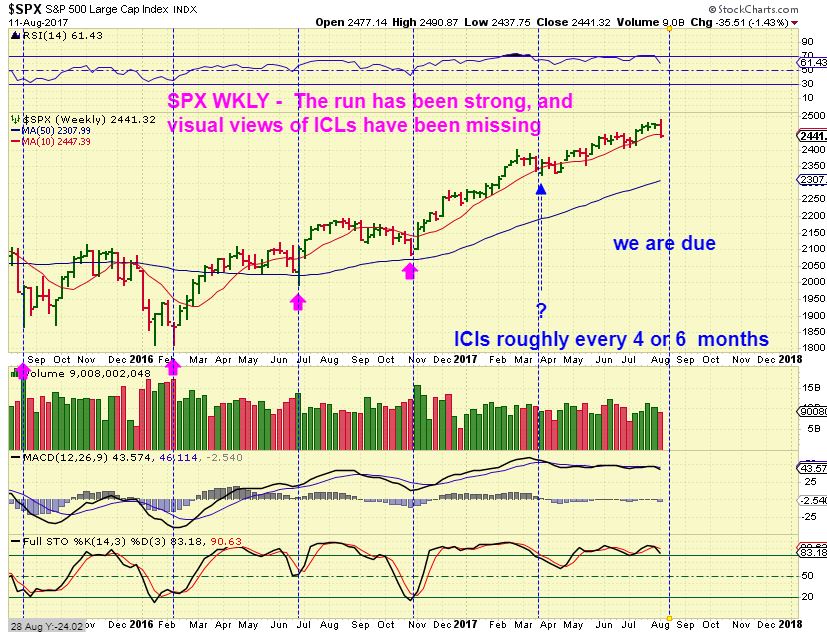
SPX - In August I reminded readers that we were due for an ICL, but visually, I still do not clearly see one.
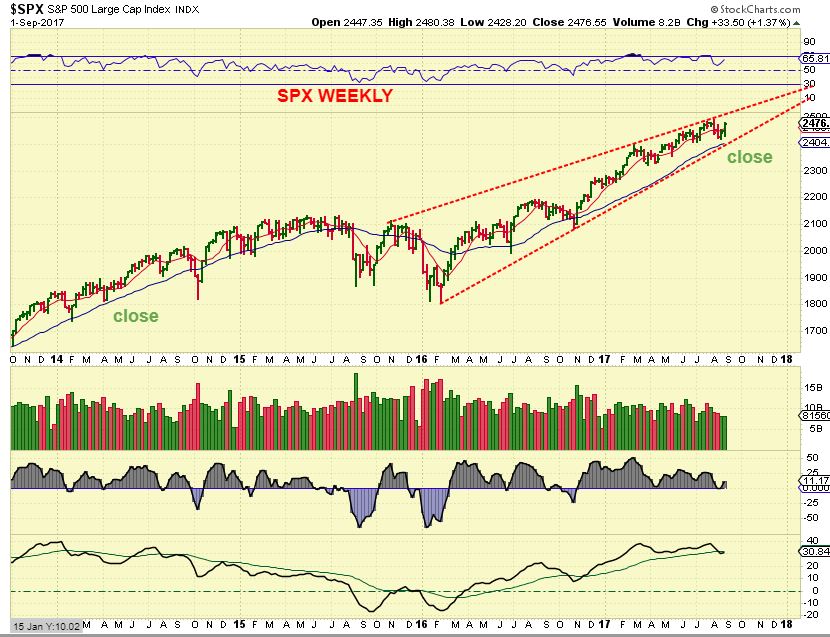
SPX - Then on Sept 1st, I posted this as a cautionary note for the future - a possible rising wedge and mentioned that OCTOBER can be tough for the markets, historically speaking. We have seen some pretty big crashes in October. Will we get the ICL then? We'll have to be alert going forward to any signs of weakness as this unfolds. So some are long from the recent dcl, I am just helping my readers to see a reason to stay alert, and I will monitor it along the way.
 Read More
Were you prepared for this action today? At chartfreak, we have been selectively buying Miners and other commodity stocks for weeks, and discussing the bullishness in this sector, despite many articles expressing concern over it.
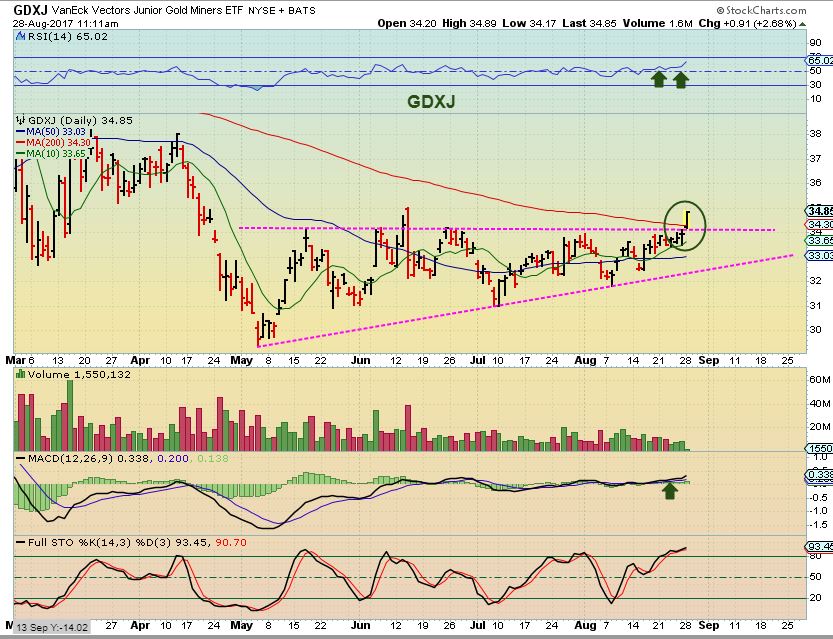
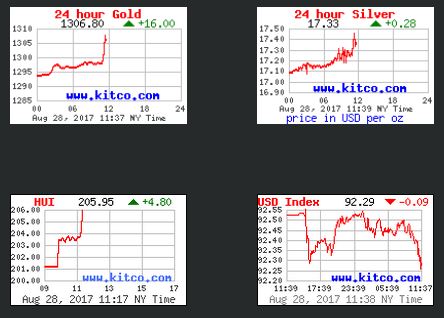
I'm opening up the weekend report, because we have been expecting this break out in Gold for weeks now. I have been posting various Miners chart set ups to show which ones were good low risk buys over the past few weeks, and my reports have been very focused on the bullish side of GOLD, SILVER , & The Miners. In addition to that, We also have been buying and trading commodity stocks like HBM, IPI, TGB, X, FCX, etc over the summer, and pretty much avoiding the General Markets as they topped out and consolidated for a bit. I was able to call THE lows in Oil in July, but the Energy sector using XLE & OIH was tricky, so I didn't enter a trade there. Set ups kept breaking down and even though the XLE did break out in late July and looked promising, it lacked strength and follow through after that break out . This was this weekends report is posted below in it's entirety, and follows up on all of those areas. IF you think that all the prior daily reports directing you to the Commodity stocks and Miners may have helped you with your trading, why not sign up for a month and try it out now? I will be closely watching this sector after todays break out. Enjoy!
NASDAQ -We still haven't dropped into our ICL, but you can see that the NASDAQ has basically gone sideways all summer. Price is where it was in May. Is this reversal ready to move price higher out of this consolidation?
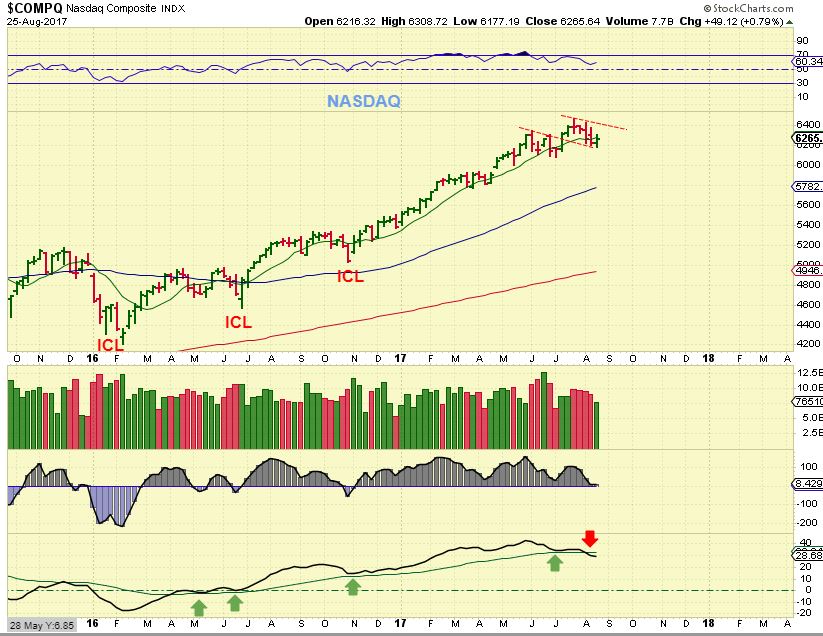
Well, we are within the timing for a DCL on the daily charts, but look at that lower indicator on the above NASDAQ chart. This sideways move has internal weakness, so the next daily cycle could roll over too, if you buy the reversal here, use a stop.
Read More
Scroll to top
 Read More


