Were you prepared for this action today? At chartfreak, we have been selectively buying Miners and other commodity stocks for weeks, and discussing the bullishness in this sector, despite many articles expressing concern over it.
I’m opening up the weekend report, because we have been expecting this break out in Gold for weeks now. I have been posting various Miners chart set ups to show which ones were good low risk buys over the past few weeks, and my reports have been very focused on the bullish side of GOLD, SILVER , & The Miners. In addition to that, We also have been buying and trading commodity stocks like HBM, IPI, TGB, X, FCX, etc over the summer, and pretty much avoiding the General Markets as they topped out and consolidated for a bit. I was able to call THE lows in Oil in July, but the Energy sector using XLE & OIH was tricky, so I didn’t enter a trade there. Set ups kept breaking down and even though the XLE did break out in late July and looked promising, it lacked strength and follow through after that break out . This was this weekends report is posted below in it’s entirety, and follows up on all of those areas. IF you think that all the prior daily reports directing you to the Commodity stocks and Miners may have helped you with your trading, why not sign up for a month and try it out now? I will be closely watching this sector after todays break out. Enjoy!
NASDAQ -We still haven’t dropped into our ICL, but you can see that the NASDAQ has basically gone sideways all summer. Price is where it was in May. Is this reversal ready to move price higher out of this consolidation?
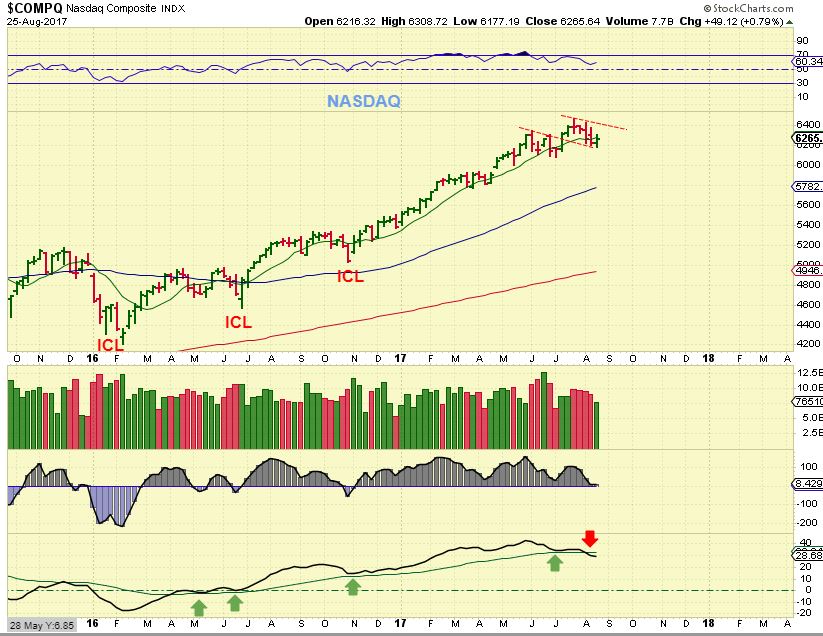
Well, we are within the timing for a DCL on the daily charts, but look at that lower indicator on the above NASDAQ chart. This sideways move has internal weakness, so the next daily cycle could roll over too, if you buy the reversal here, use a stop.
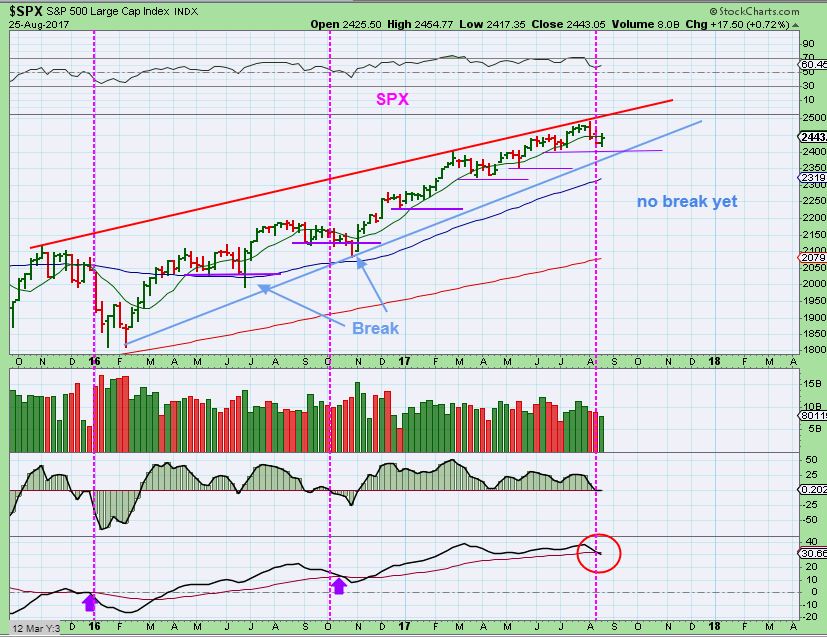
SPX – We do not have a failed daily cycle to give us a drop into an ICL, and we are overdue. As has been mentioned in the past, we are either going parabolic soon ( starting a steeper incline) or this will roll over. I am about to get a cross down on the lower strength indicator, so it needs to climb immediately with this weeks reversal, or it could drop further. Again, USE STOPS if you enter.
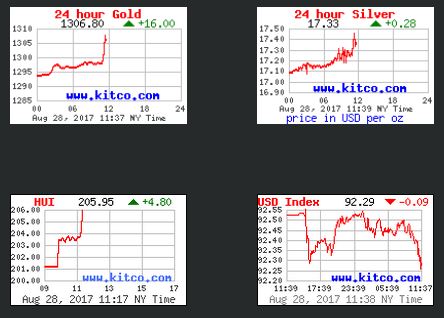
Back in July I pointed out that the dollar just seems to gather enough strength to move sideways and then drops again…
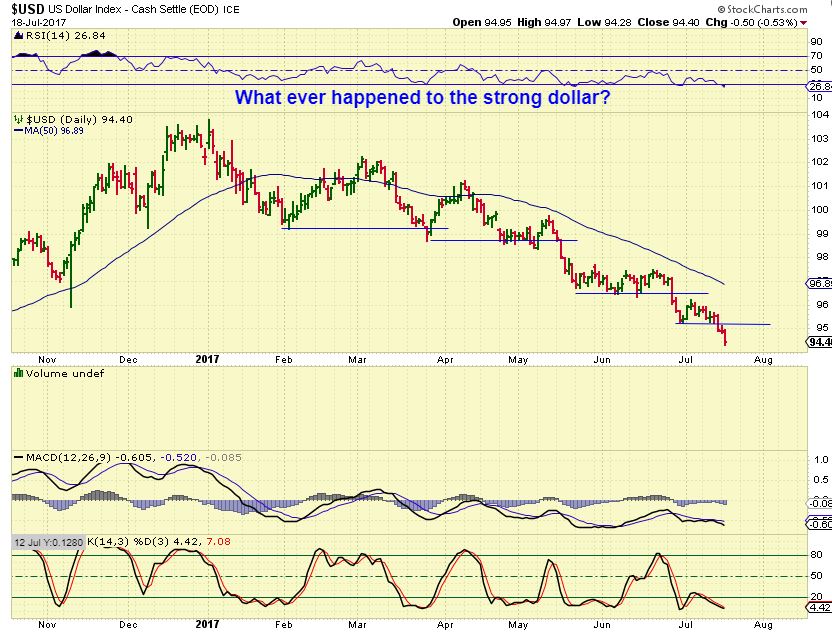
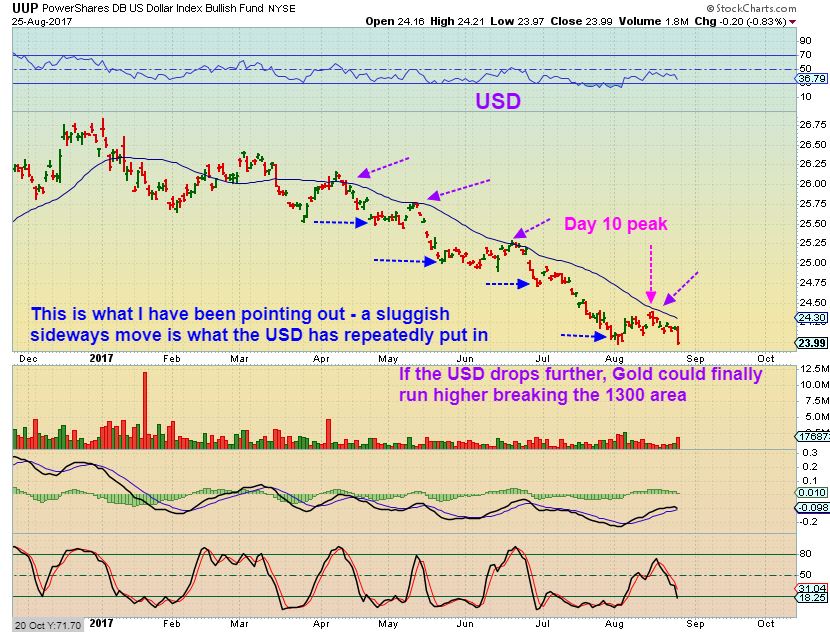
UUP – Currently that pattern hasn’t changed. WE ARE DUE FOR AN ICL, so I keep that in mind, but at this point, if this drop continues, GOLD could break the 1300 mark. Please read the chart.
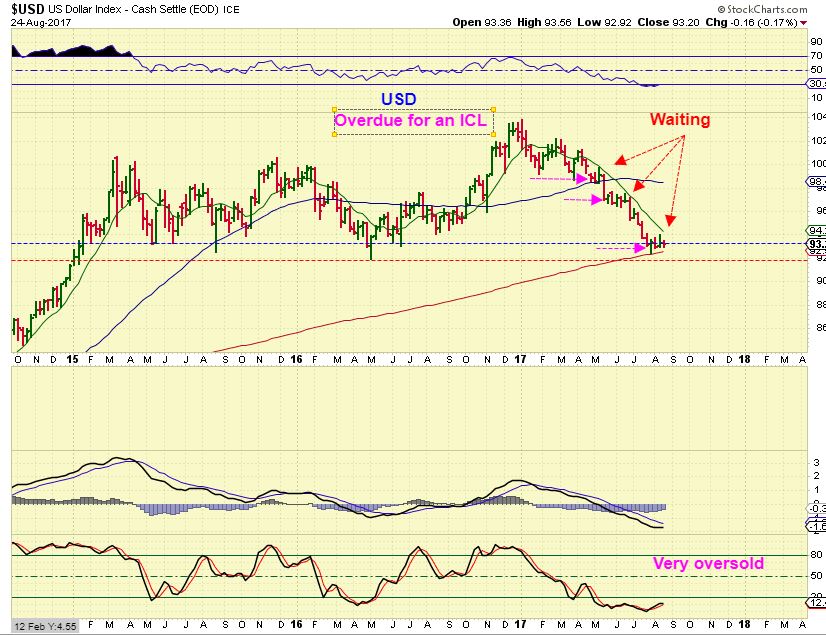
USD – The USD is overdue for an ICL, and I thought that we may have seen one, but if the USD loses this support? It could drop lower, bounce to give us a back test, and then continue to drop as quickly as it moved higher in 2014. I’m watching the USD, EURO, and YEN.
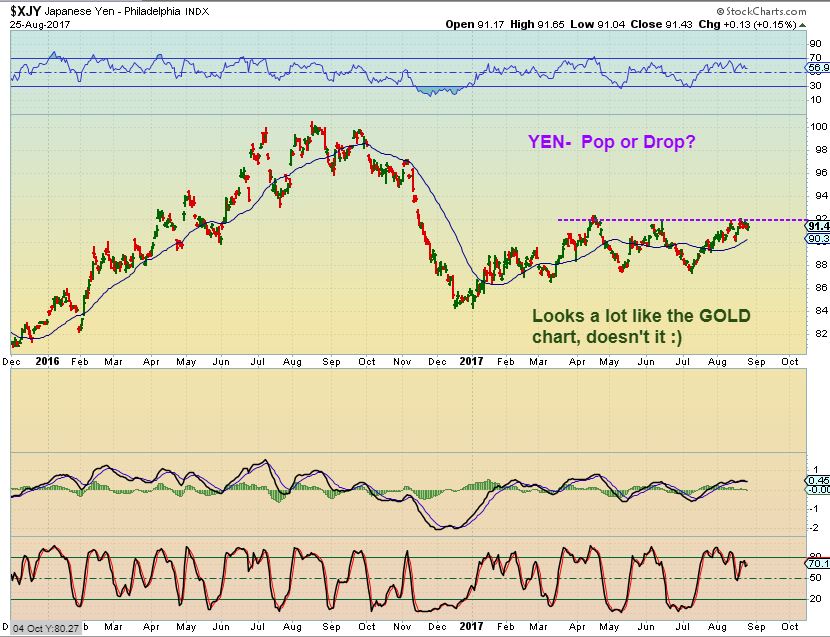
YEN -Similar to Golds moves
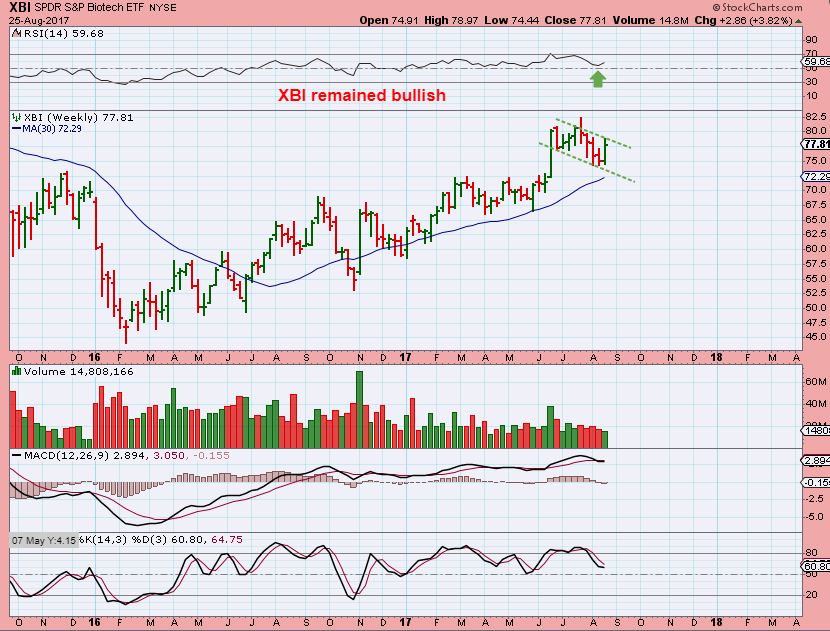
XBI– Biotech had a healthy looking pullback after breaking out, and a nice reversal last week…
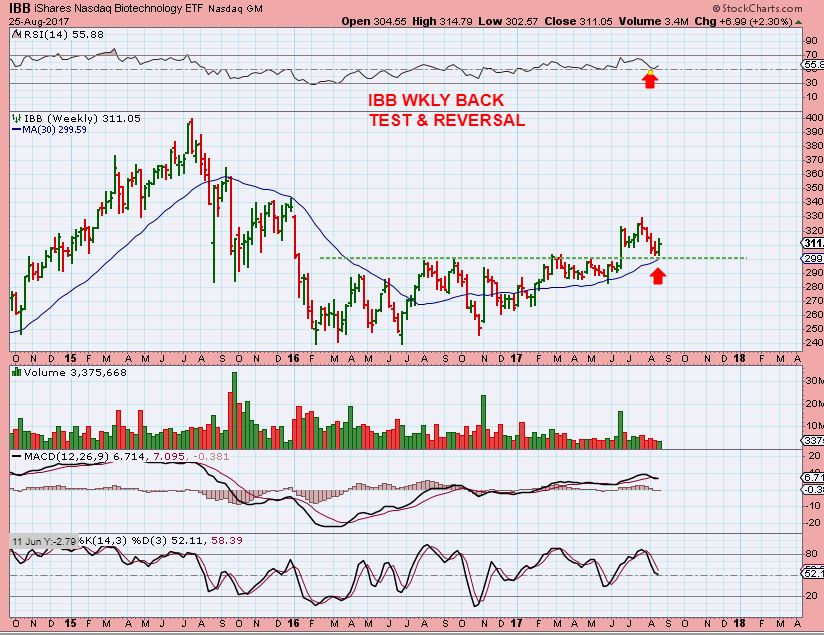
IBB – Thi chart of the IBB shows it as a normal back test to the recent break out and then a reversal. Biotech looks set up to move higher again. Almost a perfect tag of the 30 weekly MA. Textbook TA.
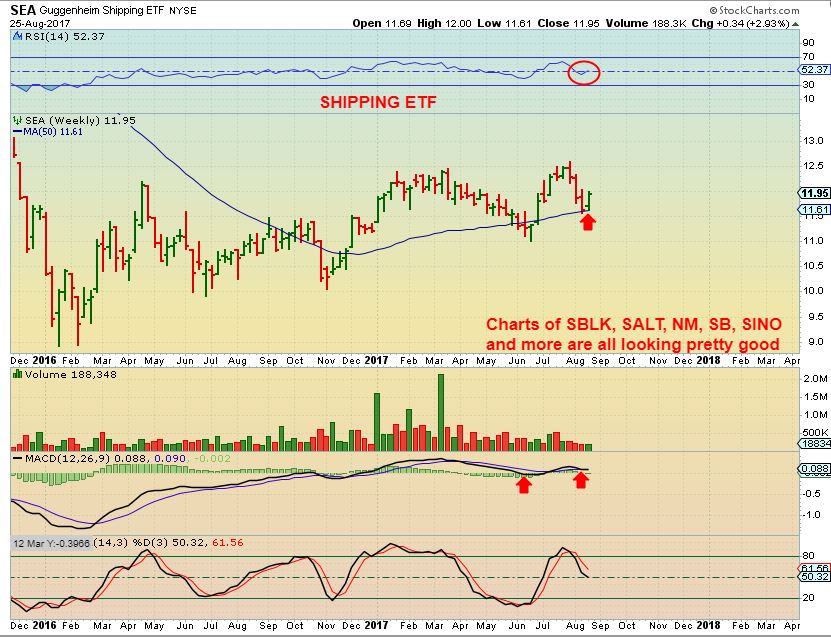
SEA – I was scrolling through my Shipping stocks on Friday and mentioned in the comments that some of these are actually now trending higher steadily, and others are breaking out. Look at charts of NM, NMM, SB, SALT, SINO, SBLK, EGLE, etc for examples. This Shipping etf SEA put in a reversal at the 50 weekly MA and also looks good.
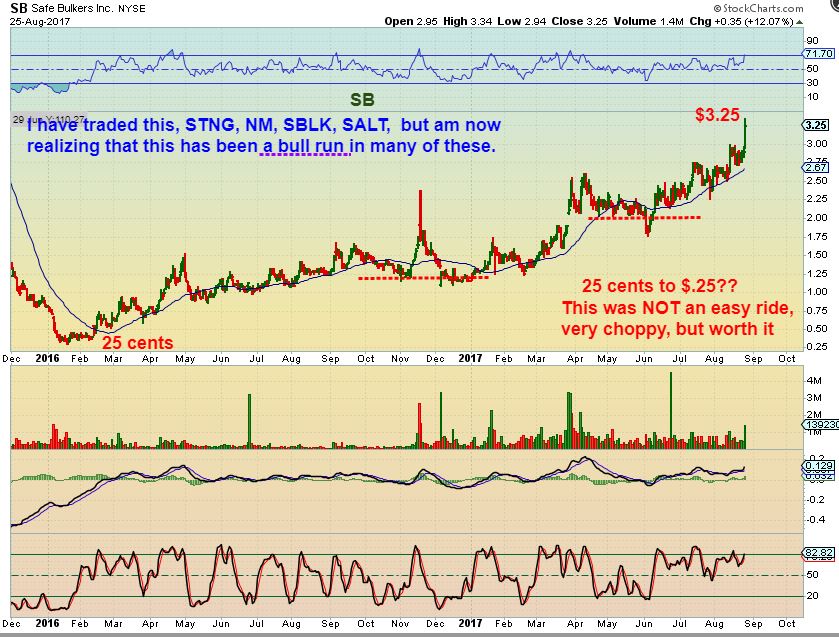
SB– As an example, SB went from 25 cents to 3.25!! HUGE MOVE, but that was not an easy ride. Much choppier than NAK, and I see a few here that often express their Hate if the ride in NAK. I’m going to discuss that at the end of the report. Please look at this run, NOT AN EASY RIDE, but it is up over 1000% in 1.5 years!!!
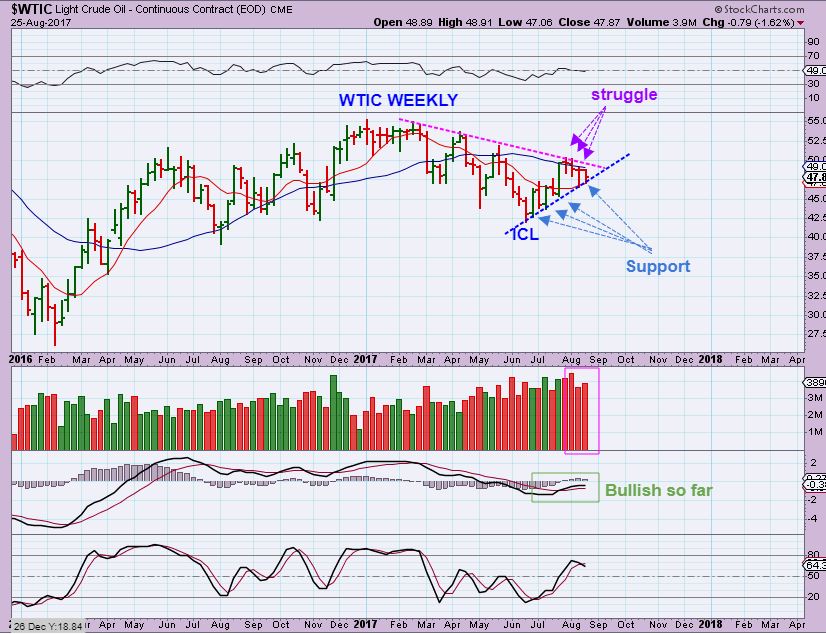
WTIC- Oil, in my opinion, put in a DCL, ICL, and a YCL in June, but has run into resistance. I am hearing that the hurricane in Texas has shut down many rigs, but I don’t know if this will affect the price ( Supply & Demand) of Oil or not, but it needs a good push to break out here.
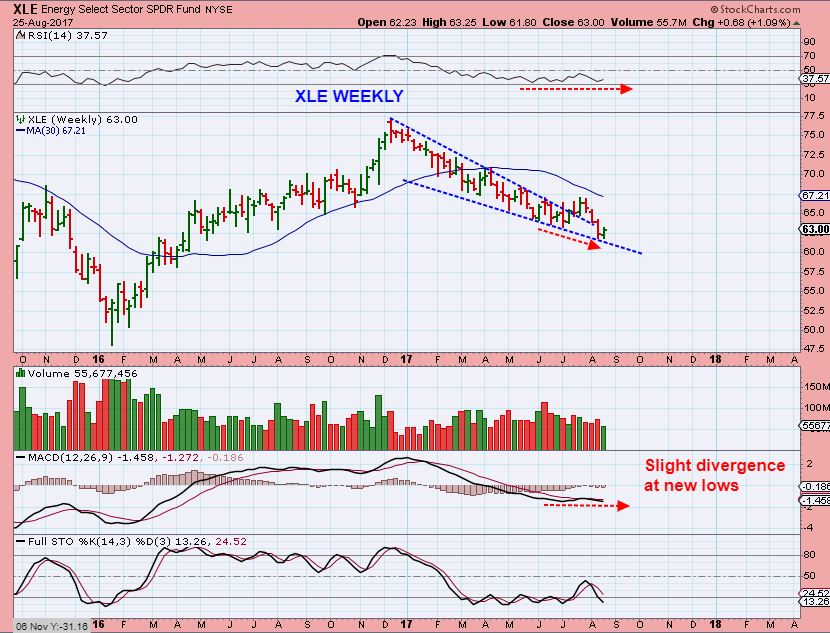
XLE – The OIL/Energy stocks put in another reversal. I have been clear about how I feel in this sector. Thoughts like “buyer beware”, and “enter at your own risk” come to mind, since even that last convincing break out rolled over and failed. I am not holding anything in this sector currently.
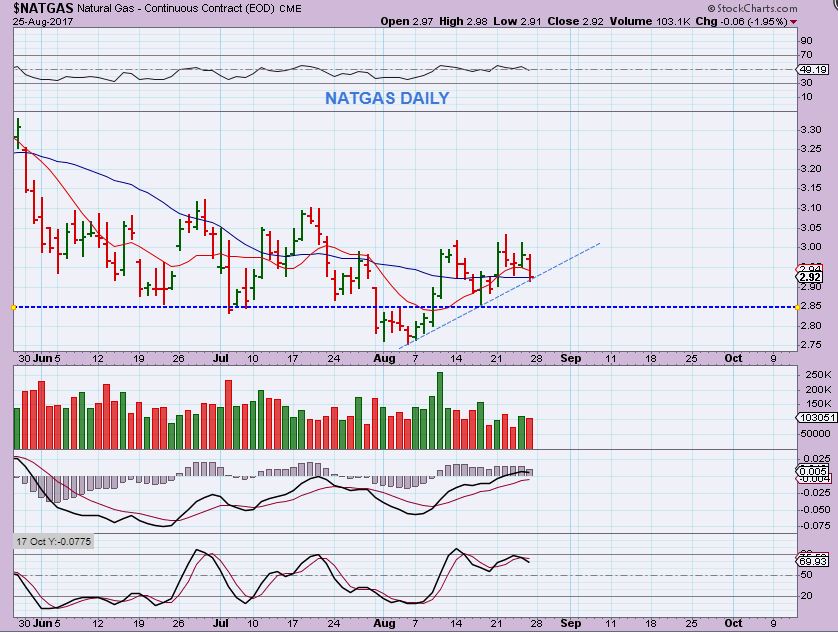
NATGAS WEEKLY – The same applies here. I haven’t personally taken a trade in Natgas, because it has been choppy and sideways for weeks and months, but I have been asked to cover it for those that trade it. It has been very choppy on a daily chart
GOLD, SILVER, & MINERS
Gold was actually in a triangle leading up to the Jackson Hole Meeting, and it reached the apex and had to go somewhere. This was my 1 hr & 2 hr charts Friday morning.
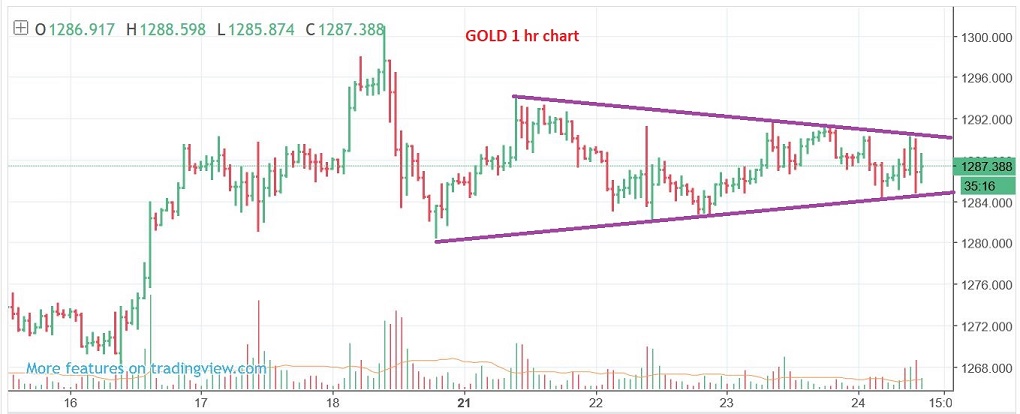
2 Hr Gold Chart as it started to break out. This looked really good, and then…
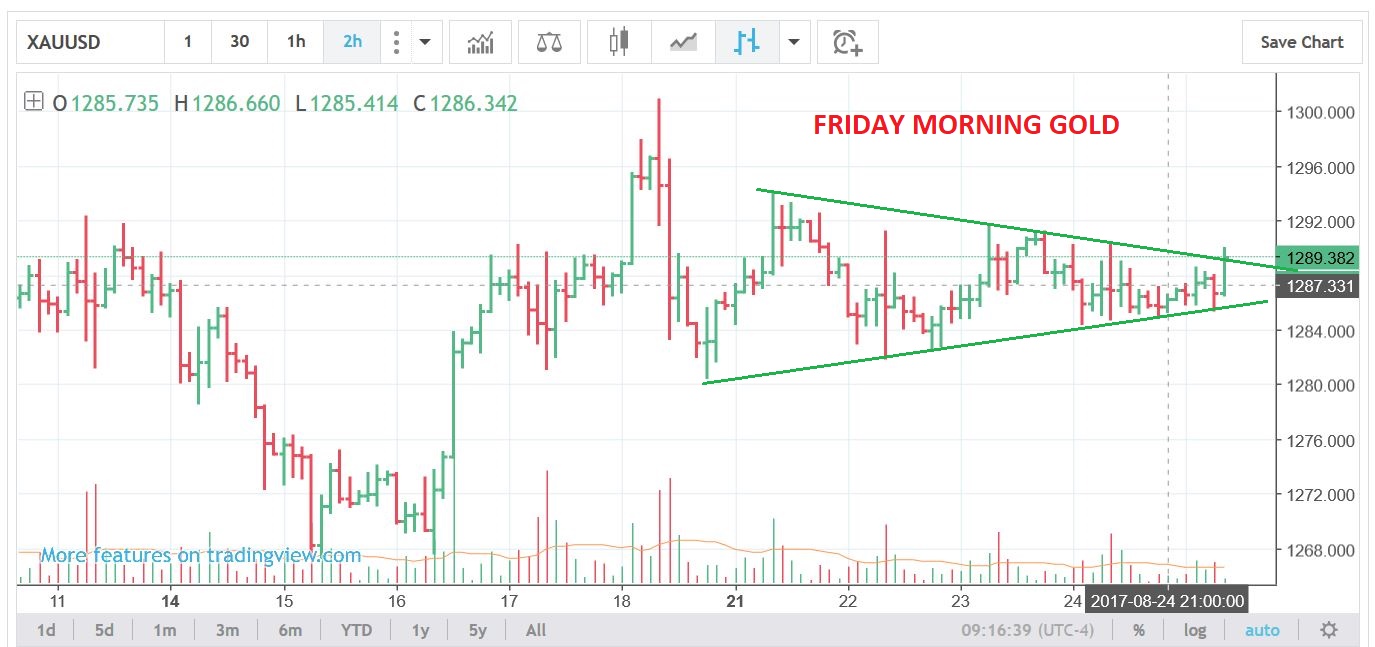
GOLD – Was this the “Pulse” of the Jackson Hole meeting? Gold went crazy on Friday, shooting straight up rapidly breaking out of that triangle, and then dropping just as quickly, no doubt shaking out any that waited to buy that break out. As the day went on, it finally ended up stabilizing.
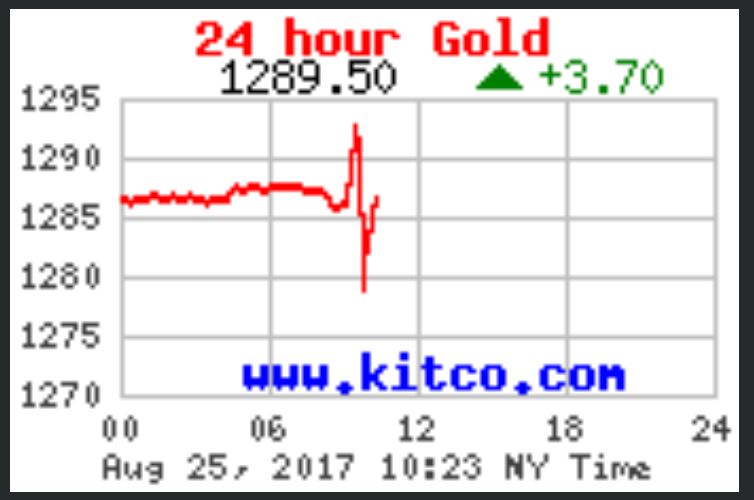
WAS THIS A FALSE BREAK OUT? I DON’T THINK SO…
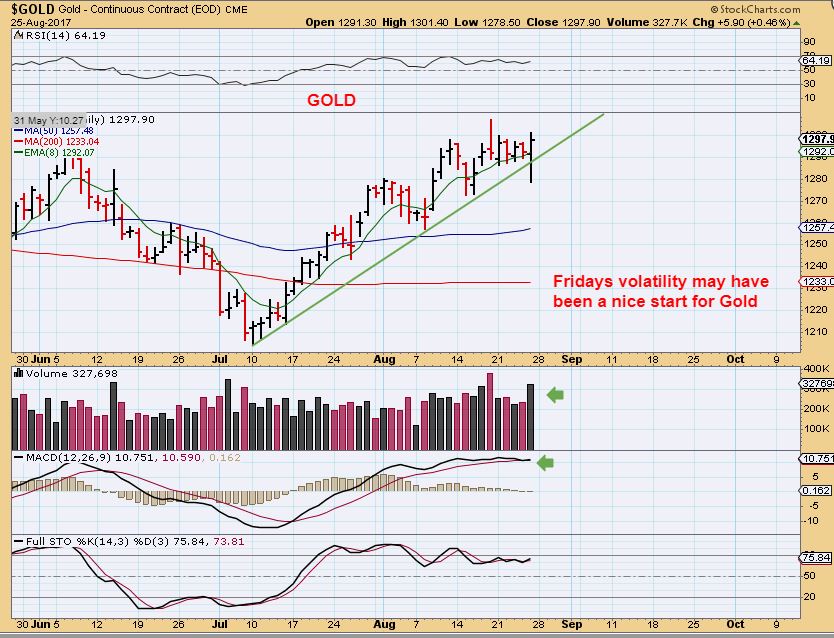
GOLD – The price action doesn’t look like much on this chart, it just looks like it sold off and closed higher, with buying into the close. That may, however, have been a shake out and Gold could continue higher next week. People shorting this set up will be forced to cover.
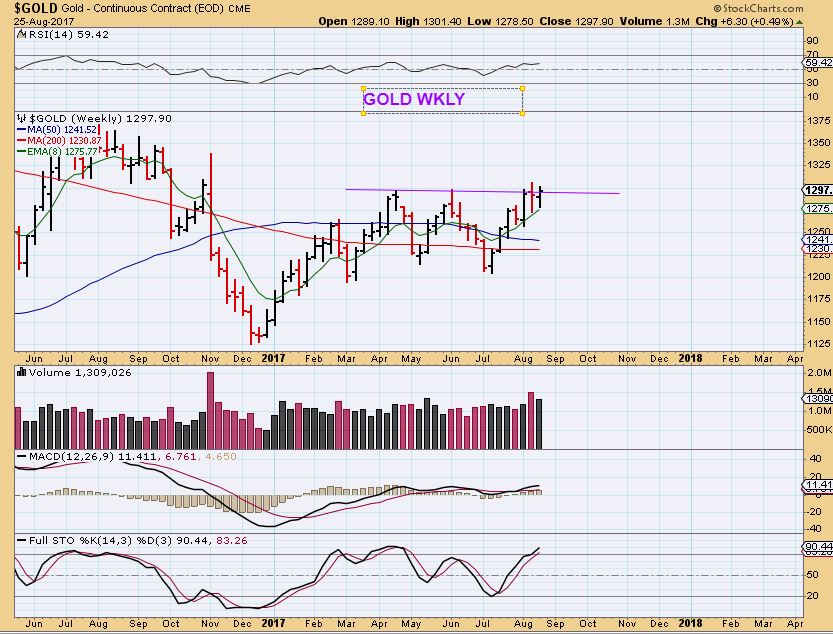
GOLD WEEKLY – This looks a lot like the YEN chart, and it does look like it wants higher price.
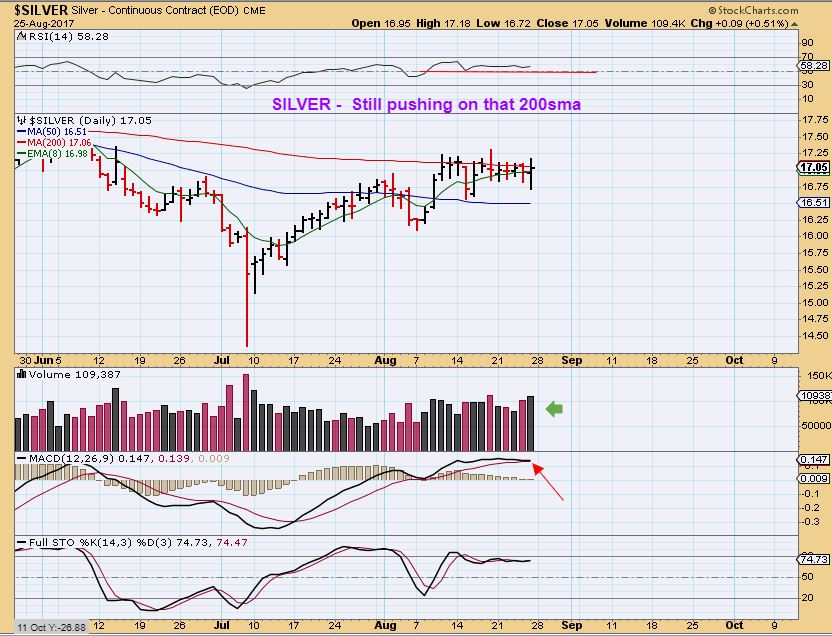
SILVER- I’ve been pointing out how Silver is pushing on the 200sma, and now Silver looks like it wants to push through that 200sma as a break out.
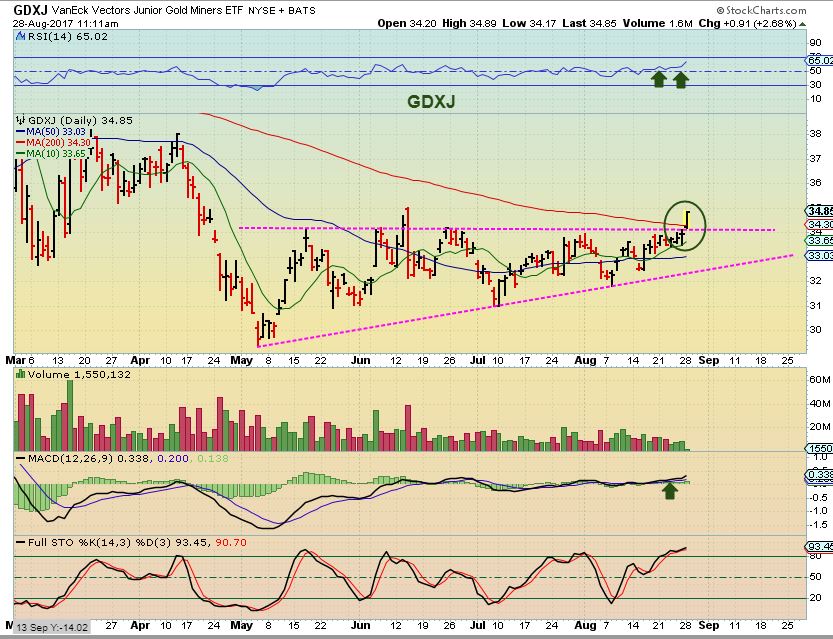
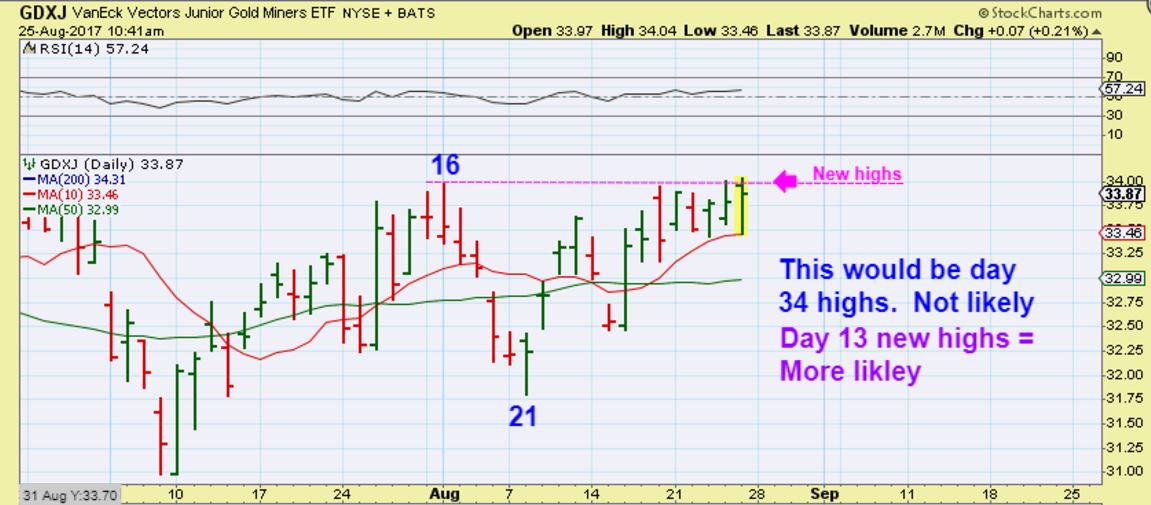
GDXJ – On Friday morning I noticed that we hit new highs, so I captured this chart just to say… ” Is it more likely that this was day 34 of the first daily cycle making new highs? Or more likely that a DCL came in on day 21 and this was day 13, new highs? I called a dcl on day 21 as it happened.
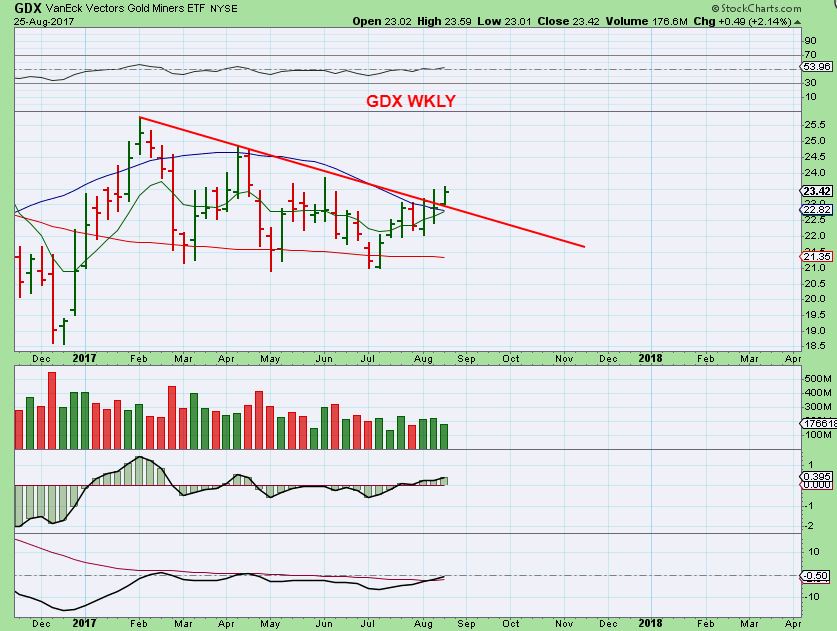
GDX WEEKLY – Either way you want to look at it, it looks like a slow motion break out in Miners and this is bullish. ** My longer term weekly strength indicator at the bottom is crossing higher for the first time since it crossed down last August 2016.
That is our weekly wrap up, and not much has changed in each sector. I am still liking (and own) Commodities like IPI, TGB, NAK, SID, GMO, HBM, CENX, etc, and some Miners ( and I didn’t cut my leverage in Miners yet, based on the triangle, not cycle counts). The General markets have put a swing low in place, but we are due for an ICL and one needs to use stops if they buy the swing. I have been bullish on a run higher in Oil since the ICL in June, but Natgas and Energy stocks have been a bit too choppy for my liking ( yet).
Now I am also seeing the Shippers & Biotech sectors perking up again. For those that wish to trade in that area, I may cover it a bit more in the coming days. I do understand that some traders may just want to stay focused on Miners or commodities, since they look to be playing out as expected. Others here do like to trade ‘trade bullish looking set ups’, so I will probably cover some of those interesting set ups in the coming days.
.
EDIT: MONDAY 12:15 p.m. Eastern – Will the break out just run away, or will it fail and just fall back down? Should you buy today if you are not yet invested? Should you wait for a pullback? I will be covering these thoughts and more in my daily reports. Please join us for a month or a quarter, and you can see for yourself whether my analysis, in addition to your trading style, can help you with your future trading.
.
Chart Freak Premium
Chart Freak members receive up to 5 premium reports per week covering a wide array of markets. Come and join the ChartFreak community as we trade the new Gold Bull Market and various trending sectors.
TO SIGN UP _ CLICK HERE
Thank You,
~ALEX
SB – Just another look at that stock that is up over 1000%, and many probably would say that they wish that they just bought & held on. “Get it and forget it”, right? However, as a reality check for us, me included … Look at the steep drops where I placed red lines. Shake out type moves. Honestly, would we have held on? Riding a bull is NOT as easy as everyone thinks. This was a very tough ride, but obviously very rewarding. I use bullish charts like this and AMZN, AAPL, NFLX, etc as a learning lesson…
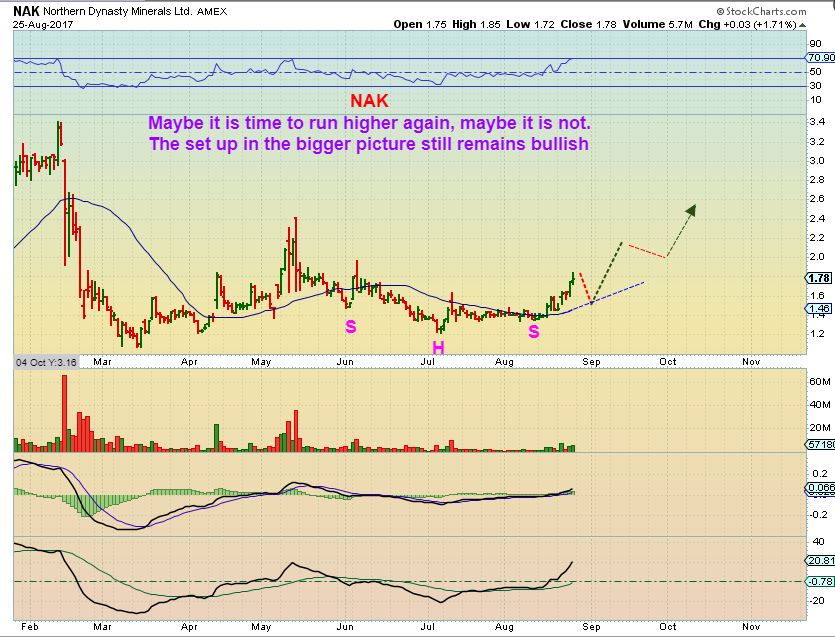
NAK– Remember this bull ride? Most here remember when I was loading up (and others were too) on this at 35 cents+ and adding at $0.40 plus and 0ver 50 cents etc. The run was GREAT, but even that first run shook people out along the way when price was still under one Dollar. I remember many many emails from people warning me that NAK was going bankrupt or had no potential. They wrote the same thing in my ‘comments’ section, and the Bull continued to climb that wall of worry. Well, eventually NAK ran too steeply into the $3.50 area and I ( many of us here too) ended up gradually selling a solid portion near $3.40, $3.20, and finally a drop under $3. Now NAK is breaking out from a steady consolidation, and I (and others here again) have been accumulating around the 200sma and again now by the 50sma. It is still putting in higher lows in the bigger picture and could now continue higher over time.
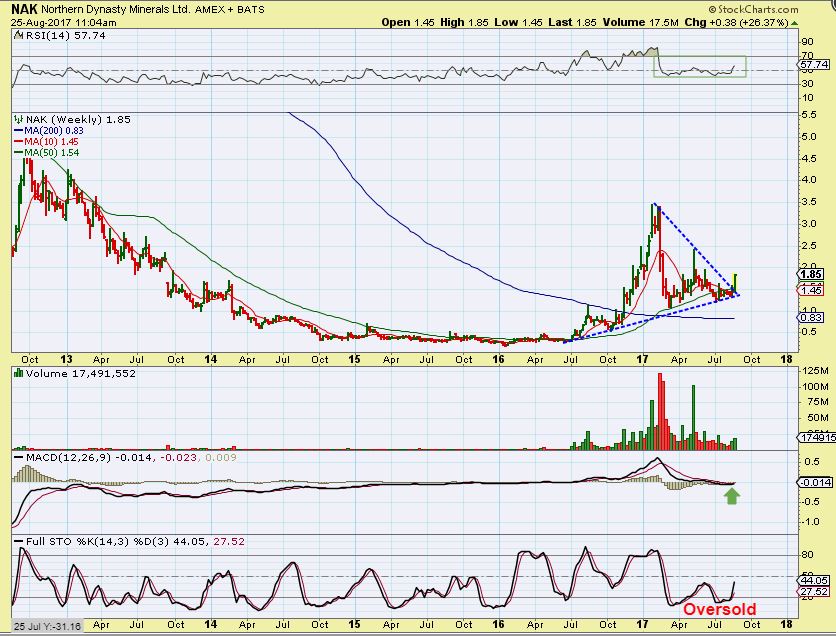
NAK WEEKLY – So this is a break out last week, and I think that that Magenta line is acting as longer term support now. Did you Buy, Sell, or Hold? If this gradually returns to former highs of $3.50, forming a cup, it is a 100% move from here and still acting like a bull. It could be a gradual climb.
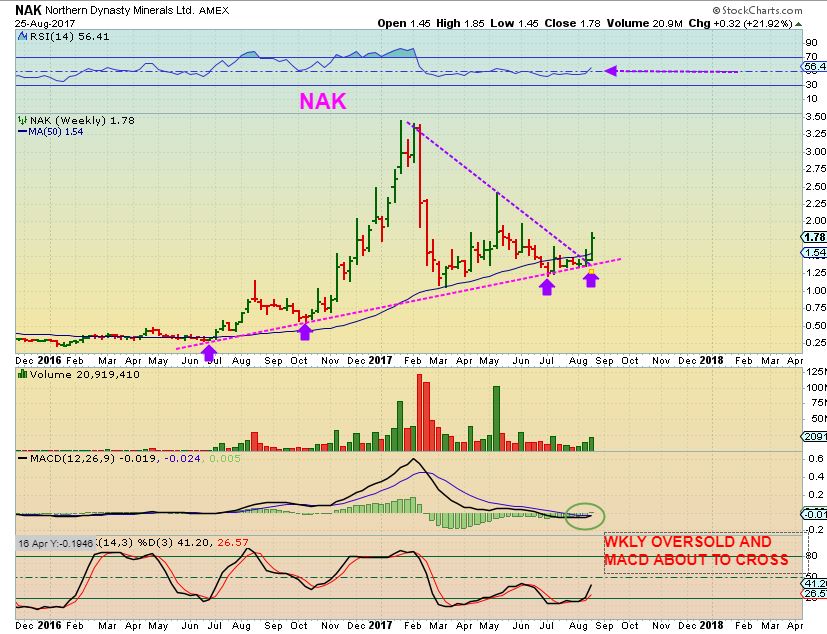
I personally think that NAK could be bought out by a big Mining company, especially now with the EPA working with them to permit them to dig in. Imagine a big Mining company like NEM, GG, ABX, etc looking for a smaller company with solid reserves in the ground?
NAK – I try not to worry too much about the smaller wiggles when the potential over time is so great. At the 2008 lows, NAK ran from under $2 to $22 and there was no Mining taking place then either.
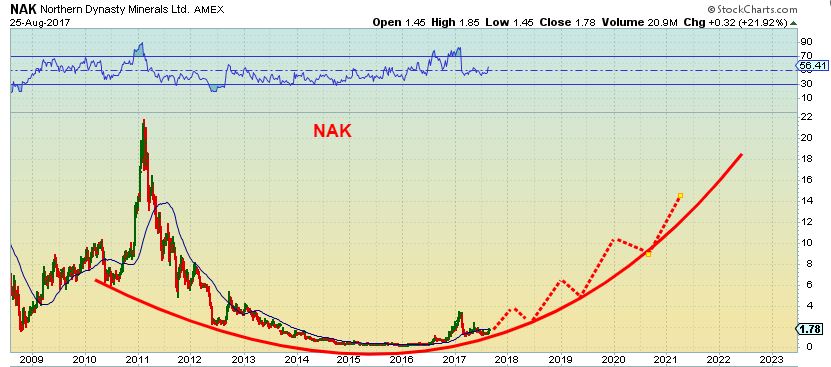
NAK – Maybe we are seeing some baby steps for the bigger picture again?
The Weekend Walk Through – Aug 27 
 August – ‘It’s About Time’ – 29th
Scroll to top

WRN back with a bang.. thk goodness…almost sold this one on Friday
im drawn to that one …. plan to snag some at some point
trades so thin. that could be good and bad
yeh 35K not too convincing
ALO too, only 47K
While all the attention is on the PM’s, I’ve added a bit more steel miner exposure with CLF and GGB yesterday and a top up today.
I love seeing them run hard, but the intra day waterfalls back down are so depressing.
just wondered… so for no comments today.