
Oct 23rd – THE BIGGER BIG PICTURE
I AM OPENING UP THE WEEKEND REPORT TO THE PUBLIC. IT IS A LONG REPORT, SO IT WILL TAKE SOME TIME TO READ, BUT I HIGHLY RECOMMEND IT. IT IS A BIGGER BIG PICTURE VIEW. ENJOY & THANKS FOR CHECKING IT OUT!
This weekends report is going to be a bit different. I often give the Big Picture review, and with that, we have been discussing since last January the possibility of a Blow Off Top / Parabolic move resulting from the general markets’ bullishness. Well, this is going to be an even Bigger Picture discussion, with a number of different Markets discussed. It is a long detailed report designed to answer many emails that I have received about the bigger big picture , so grab some coffee or tea and let’s begin…
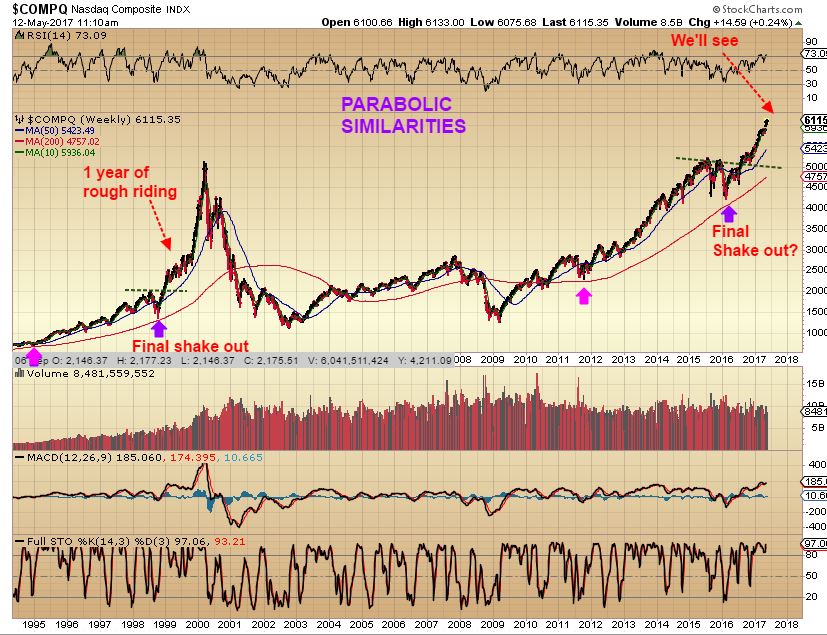
NASDAQ – This chart was from last May. I posted this idea of how the current rally that we were seeing could be becoming parabolic. Parabolic moves seem like they will never end, and you’ll hear that “Nothing can kill this market”, and it feels so true. Then suddenly, they die a brilliant death as you can see in the year 2000. See the chart below, where we examined similarities of a final shake out consolidation, a ramp up with somewhat choppy trading that would still having higher lows, higher highs, and then the final Ramp higher…
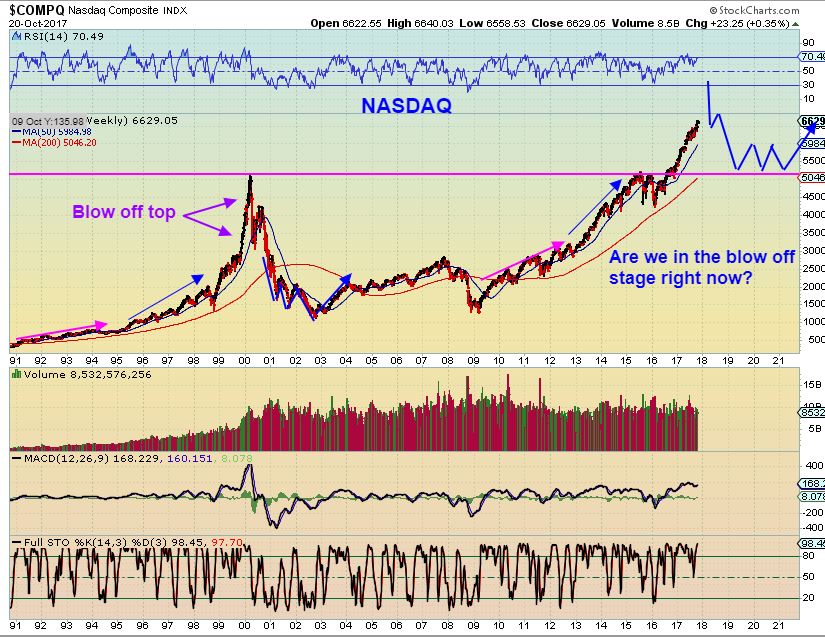
NASDAQ – Here we are now and the choppiness with higher lows and higher highs seems to be playing out now, and a blow off top would follow. OR, is this the blow off top in play as it just continues higher? This move is verticle and could lead to the blow off top. Just ride it long. I have drawn in a post blow off top scenario with a normal ‘back test’ of the break out. Let’s dig in further…
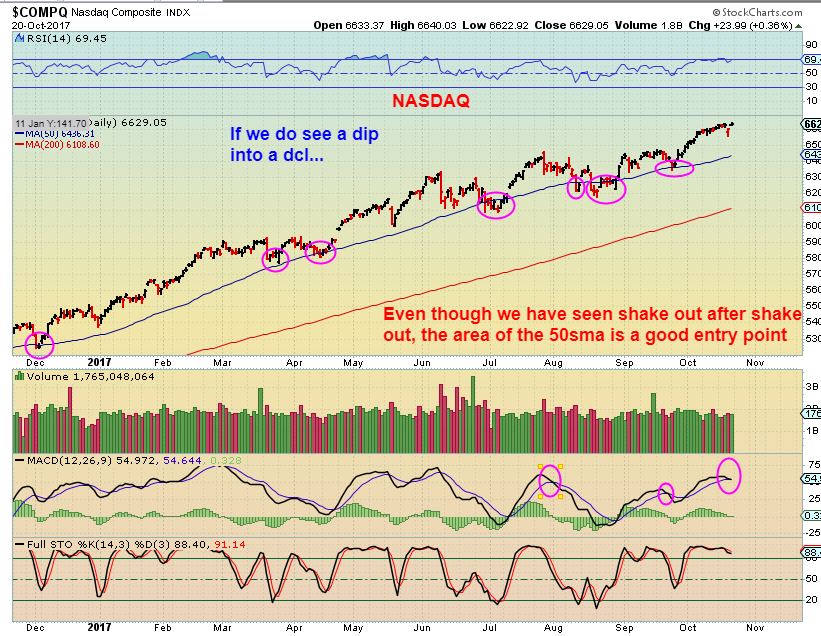
NASDAQ – Currently, the ‘choppiness’, when examined close up, is normal. I have advised buying with a reasonable trailing stop. Each dip to the 50sma can be bought as a low risk entry. Was that tiny dip the DCL, because we are so late into this current daily cycle? I’ll show you why that could be possible later using the RUT AND TRANNIES. If it isn’t a dcl, and we get a dip to the 50sma (even with a shake out there), that would obviously be a ‘buy’- please read the chart. THis is a healthy strong bull run.
Now let’s also look at the BIGGER PICTURE SPX, RUT, TRAN, DJIA
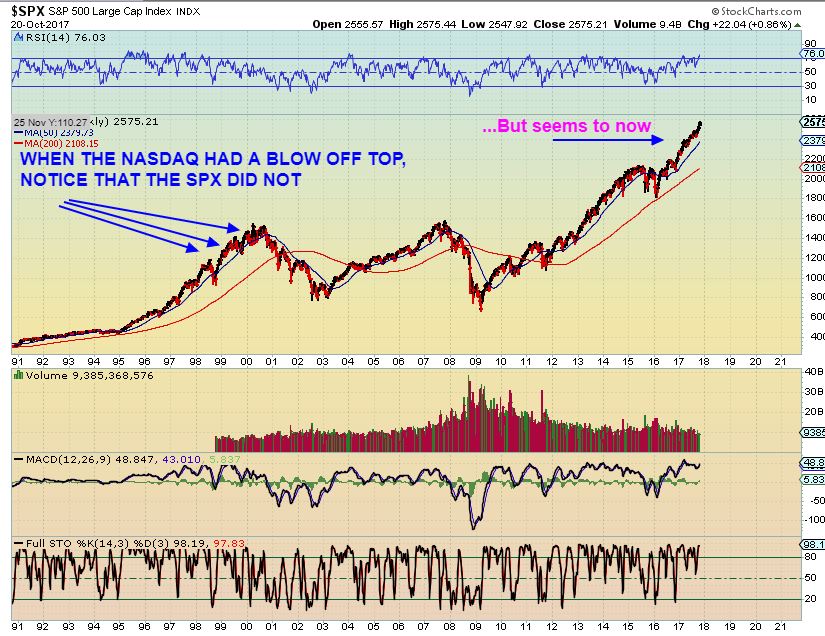
SPX – Please read the chart and notice that the SPX already actually looks to be rising in parabolic fashion, with 5 pretty clear waves higher not quite yet complete. Reminder: This may not be at it’s end, but be assured that a Parabolic run does not go on forever. They eventually die a brilliant death ( Thats the BIGGER BIG PICTURE) .
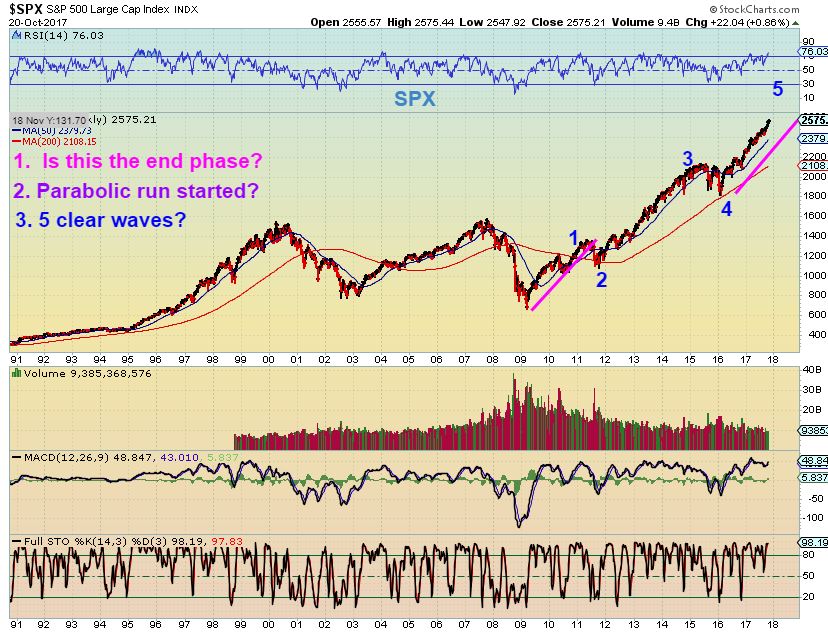
SPX – This was an important fact that I noticed. When the NASDAQ had a parabolic blow off top, The SPX did NOT. It is now. This is important, and I will explain why later, but for now, THIS TIME The SPX does look to be running in more of a parabolic fashion too. This may be leading to a blow off top.
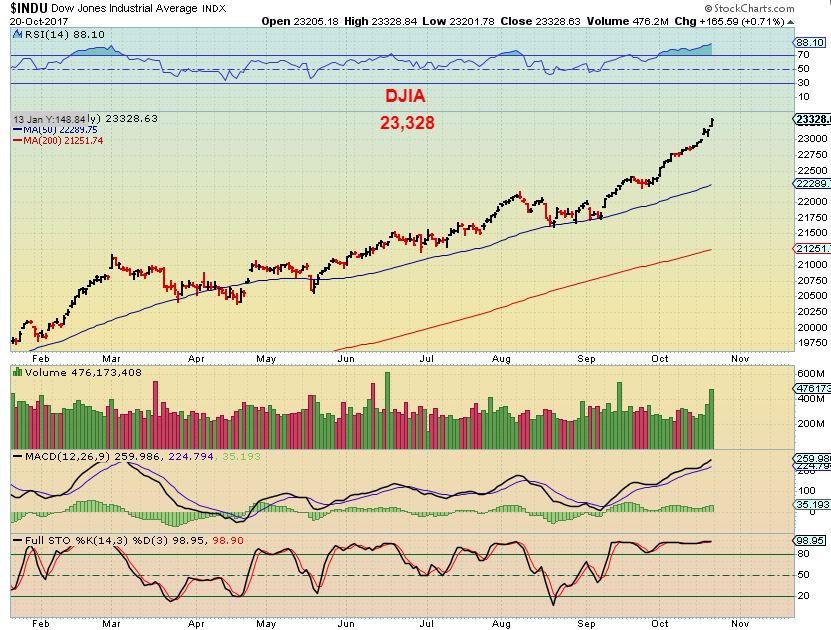
DJIA– This is the DJIA now, and it is running strong, looking parabolic too. IBM reported strong results and Gapped the Dow higher last week. After this long sideways choppy(ish) year, even the DOW seems to be joining in on a possible parabolic type of vertical move starting in May, but especially now since September.
DJIA – AGAIN I THINK this could be important to notice. Look at the DJIA in 2000, when the NASDAQ had that year 200o parabolic blow off top. The Dow simply ran higher & went sideways in 2000. It did NOT have a blow off top type run, but it does appear to be having one now, right? Compare 1999 to 2017.
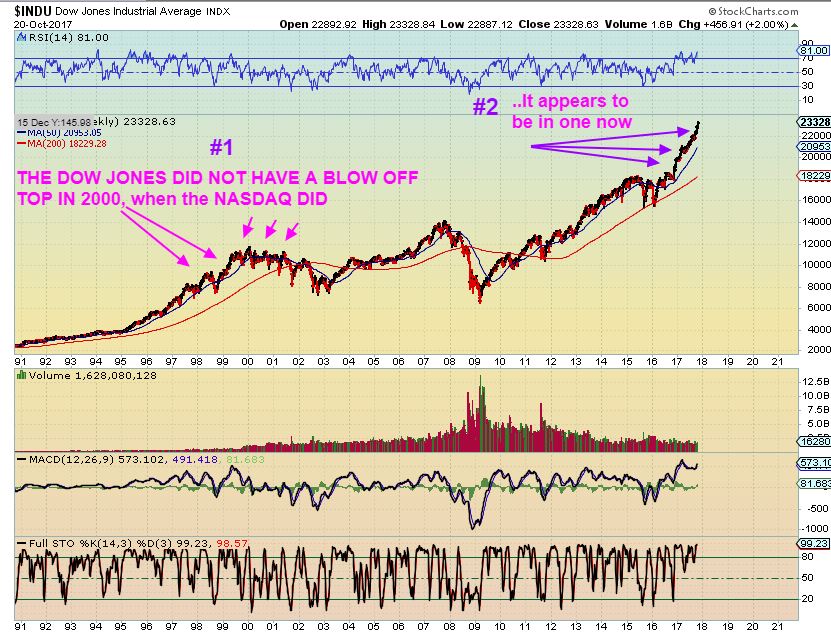
WHY IS THAT IMPORTANT? It shows me that when the Tech Bubble gave the NASDAQ a blow off top in 2000, not all sectors had to have that type of blow off top when the end of the run came. So now, at this time, I would not expect every single sector to have that blow off top type of a move. I do see it in the SPX, DJIA, and NASDAQ at this time, but the Trannies do not appear to be moving that way, and the RUT / IWM may or may not. Let’s review.
.
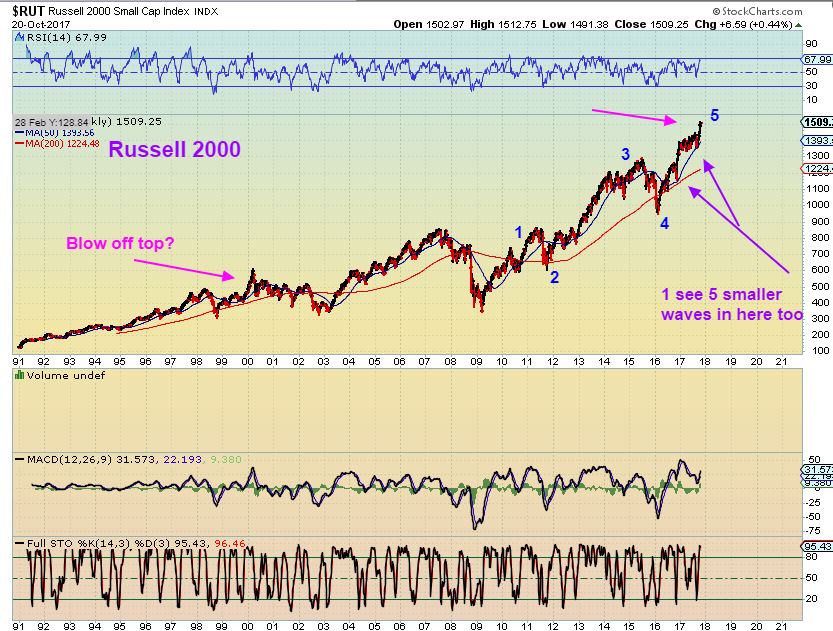
RUT – RUSSELL SMALL CAPS – There was a small ramp up at the end of the 2000 run, but not a huge blow off top in 2000 like the Nasdaq (Important?). Here we see a possible 5 wave run in the last 9 years and a pretty straight up rally at this time, but similar to what the Rut did in 2000.
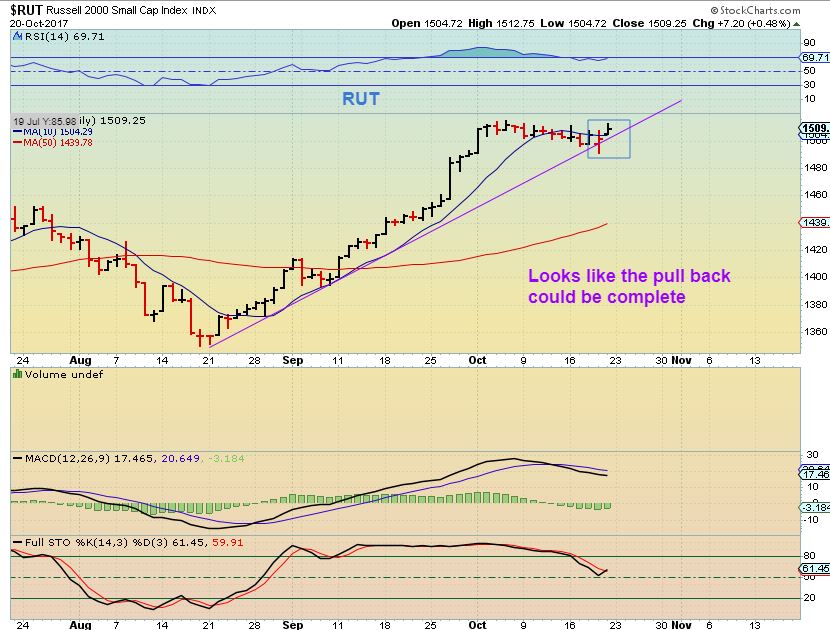
CURRENT VIEW RUT DAILY – This is how straight up it has been. The recent consolidation could be the dcl, with a trend line break and a close below the 10sma & recovery. This is 1 reason why I think we may have the DCL in place across the board, because the dip shows up in some markets, though a dip in the NAZ, DJIA, and SPX are not evident. This is a BUY in my opinion.
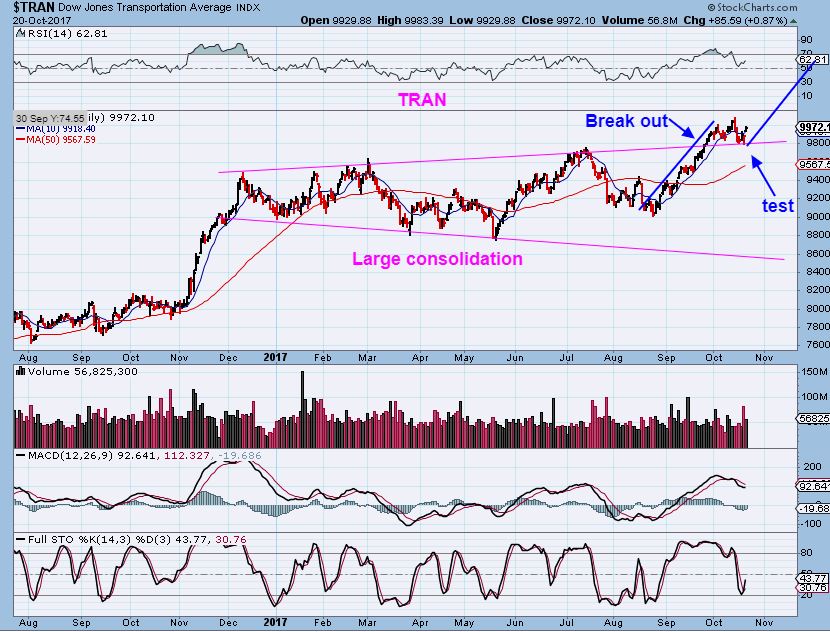
TRAN DAILY- The transports seem to be starting to ramp up since August also, now with a back test for a possible DCL. This doesn’t look parabolic, but it doesn’t have too. In 2000, not all sectors went vertical, but they all had good gains. A DCL looks to be in place here too. A dcl may be showing up in the RUT & TRAN, though the dips in NAZ, DJIA, and SPX are shallow & one or two days down because they are running parabolic now.
ALL OF THIS POINTS TO THE MARKETS LIKELY CONTINUING HIGHER, POSSIBLY EVEN INTO THE YEAR END, AND POSSIBLY IN A PARABOLIC TYPE BUYING FRENZY, WITH NORMAL OCCASIONAL PULL BACKS
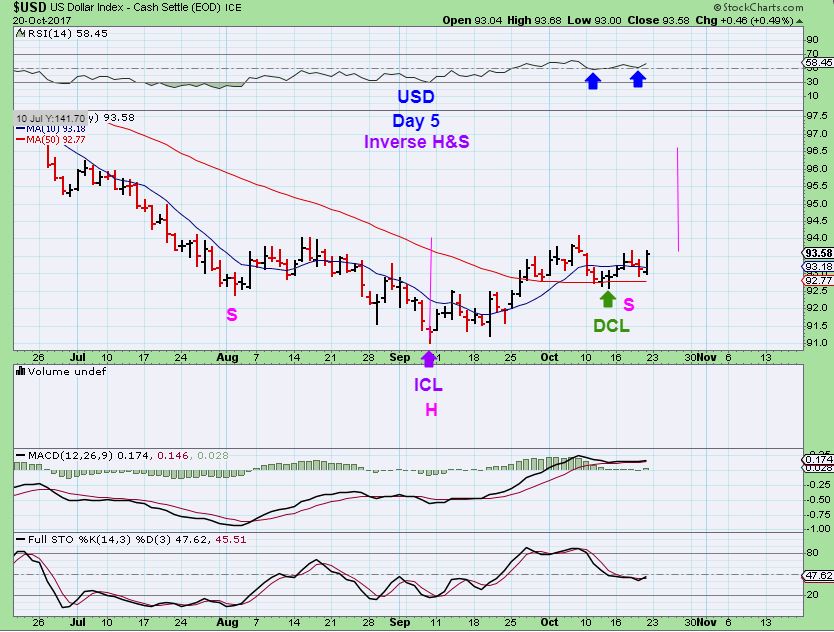
USD – The USD is playing out exactly as expected. It put in a YCL , ICL, and formed an inverse H&S. I have said that I expect that the USD can run to the 97 area. This will hold Gold down, we will discuss that bigger pic too.
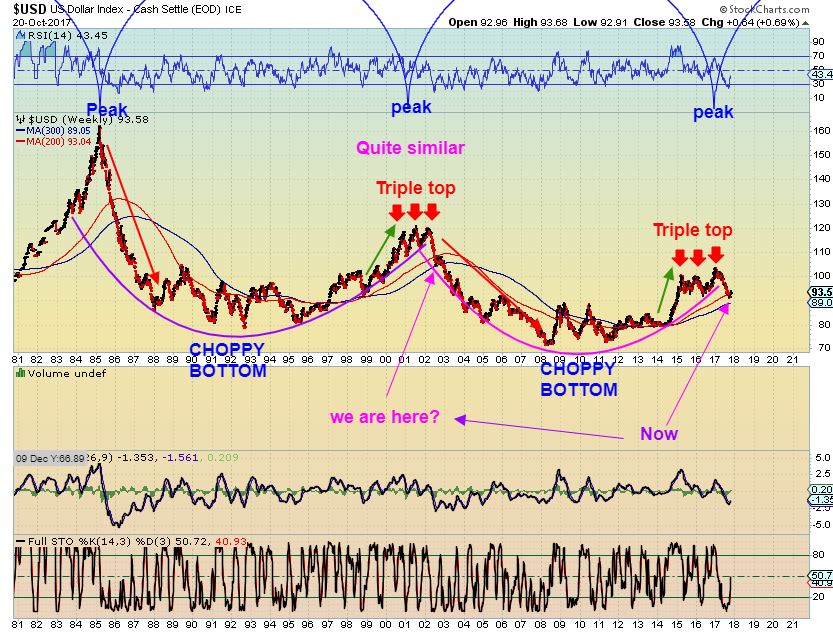
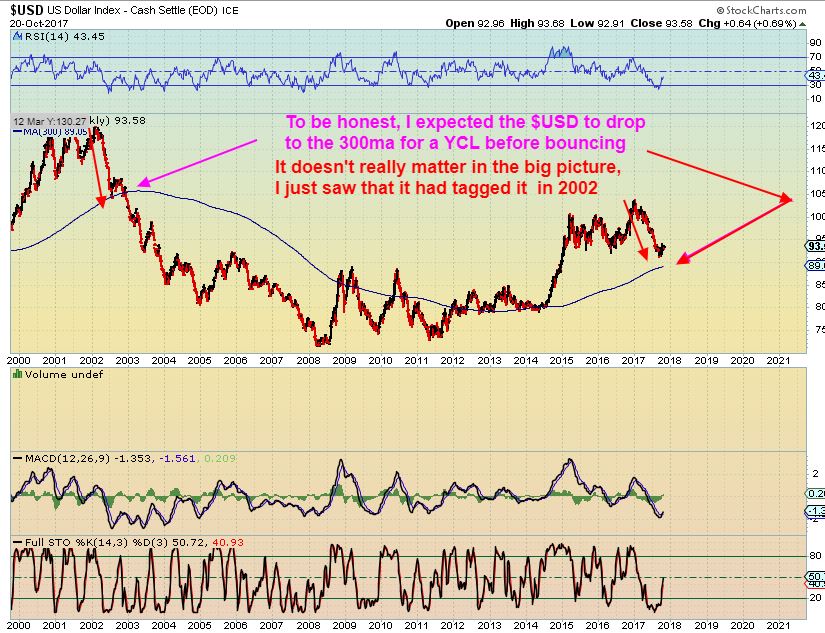
USD – Do you see similarities for the BIGGER BIG PICTURE? A Triple top near 2000-2002, then it dropped sharply to the 200/300sma, bounced & continue down. See the chart “we are here?” area for the ‘bounce’.
USD CLOSE UP OF THE ‘BOUNCE’ – I actually expected the USD to bounce off of the 300sma like it did in 2002 as seen in the chart Above, but it bounced off of the 250 sma area.
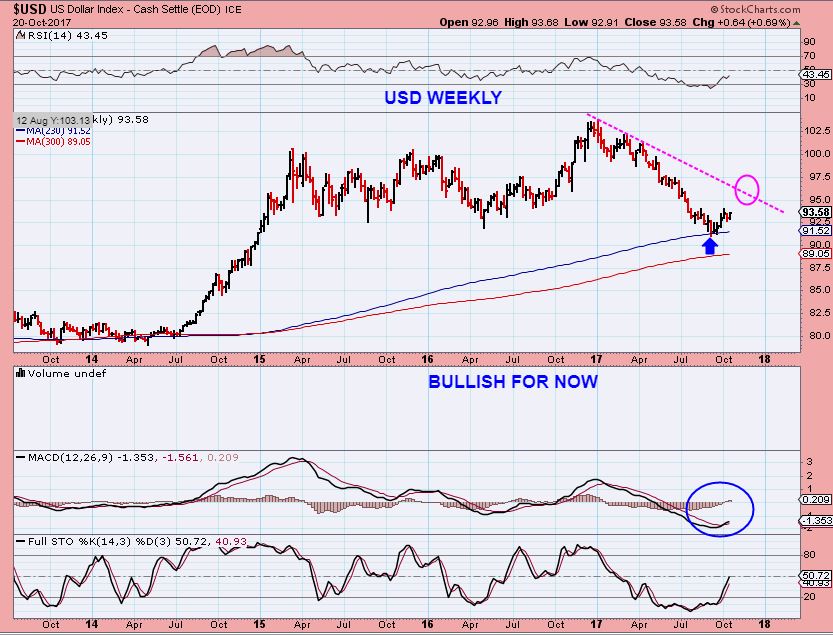
USD tagged the 300sma in 2002 and bounced.
USD BIGGER PICTURE- Please read the chart
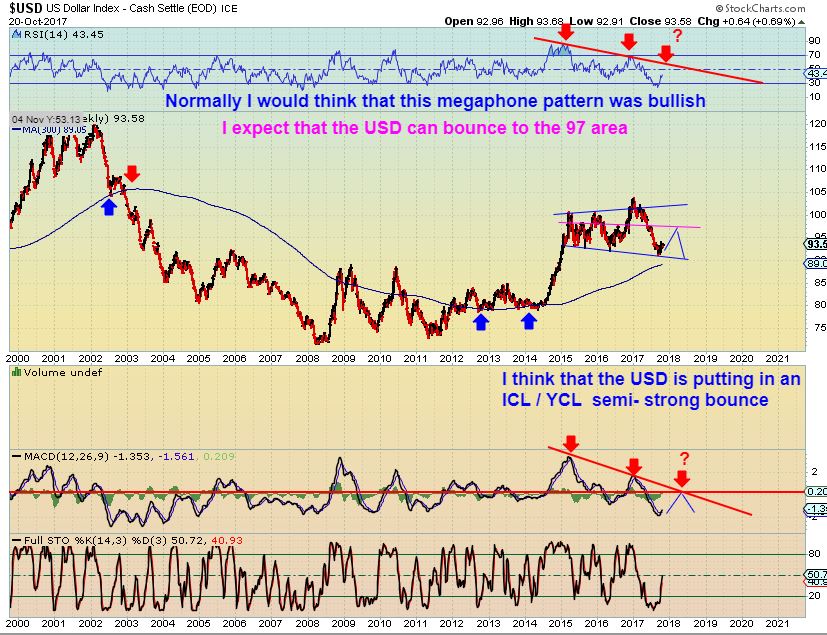
SO THE USD HAS SOME UPSIDE LEFT IN IT, AFTER PUTTING IN A YEARLY CYCLE LOW. THIS SHOULD PRESSURE GOLD MOVING FORWARD, BUT PRESENT AN EXCELLENT BUYING OPPORTUNITY LATER TOO.
.
PLEASE NOTE THIS: I am discussing that the markets could be heading toward a blow off top type move, similar to the Tech Bubble of 1999-2000. It would be beneficial to see what happened in that BIGGER BIG PICTURE time period in other areas too. We will do that now.
When the TECH BUBBLE Popped and earnest selling began in 2000 onward, the markets began to fall back to earth and consolidate those great gains, where did that Money end up going? Commodities. Let’s look at Oil / Commodities / Gold.
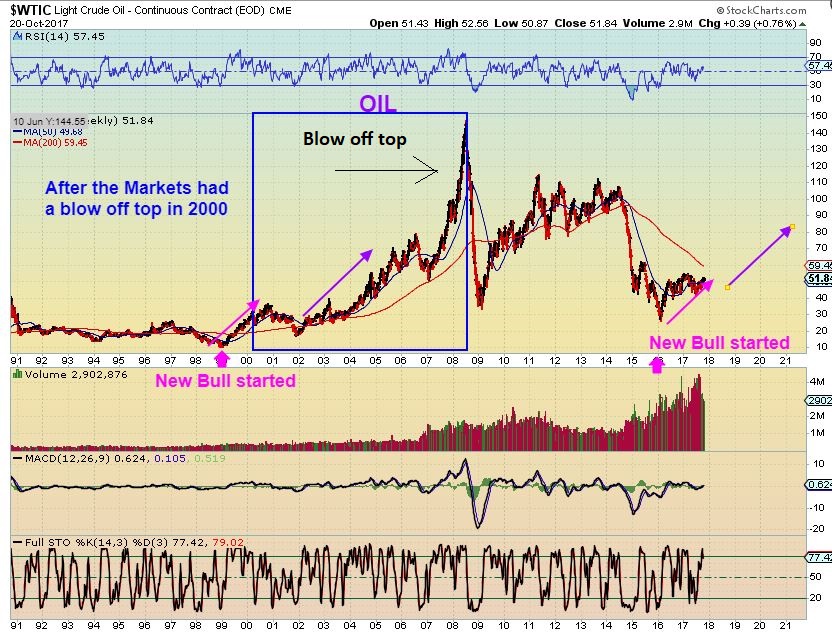
WTIC – Notice how OIL bottomed early in 1999, as the General Markets went parabolic. Oil went sideways and ran a lot higher after that blow off top in the NASDAQ. So, Oil bottomed and began a new bull market. Currently, Oil has bottomed already again and we caught that low right at my target of OIL $26. The next leg up may start soon as the general markets top.
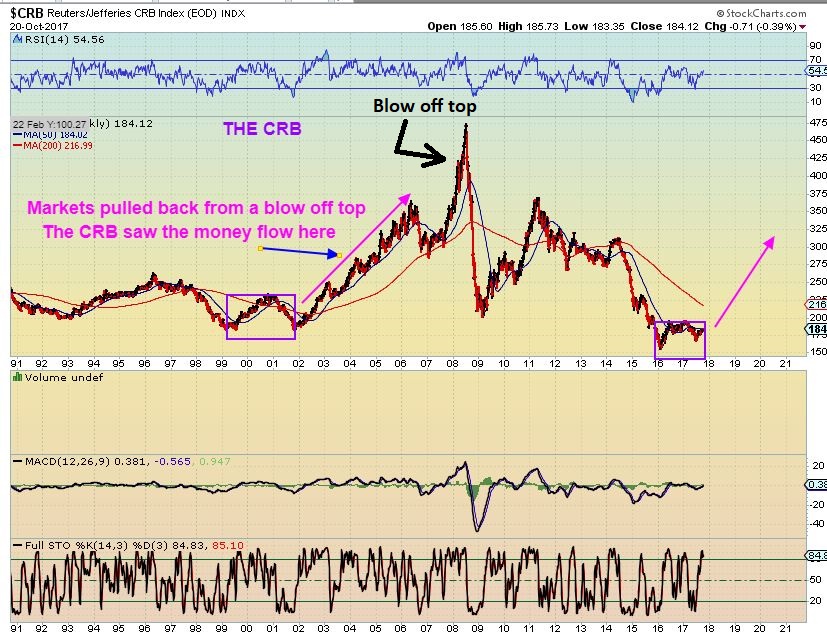
CRB – The CRB also tried to bottom a yr before the markets topped in 1999. After the year 2000, when the TECH BUBBLE BURST, the CRB bottomed and began to climb higher. It is also doing that now .
PRECIOUS METALS – The Market we all know and love to trade!
Note: I am not a ‘GOLD BULL’ as they are known, but I have done very well in this sector. I have shorted Miners on many occasions, but I do love to trade this market on the long side for the incredible gains that it offers, so let’s take a look at the Bigger Big Picture here too.
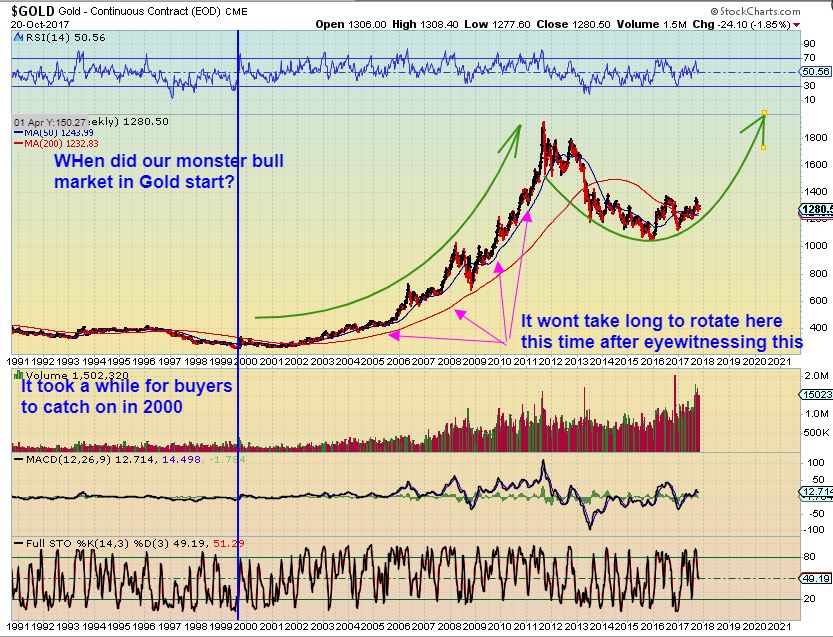
GOLD – We all probably know what happened after that 2000 Market top. The BULL MARKET in GOLD, SILVER, and MINERS took hold. The bottom was ‘in’ in 1999 and then after the markets topped, money really flowed into Gold, Silver, and Miners over the following years. Read this chart and then let’s look at some more charts…
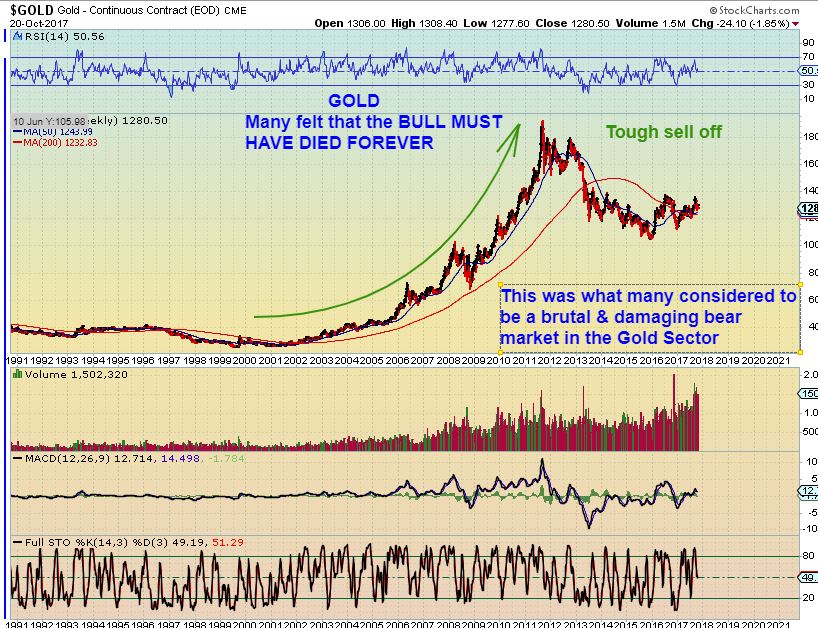
GOLD- Look at the chart below – The recent sell off from the 2012 top has certainly changed sentiment. I have received a number of emails where many feel that THE GOLD BULL IS DEAD. Why dont we take an unemotional, unbiased look at this SELL OFF.
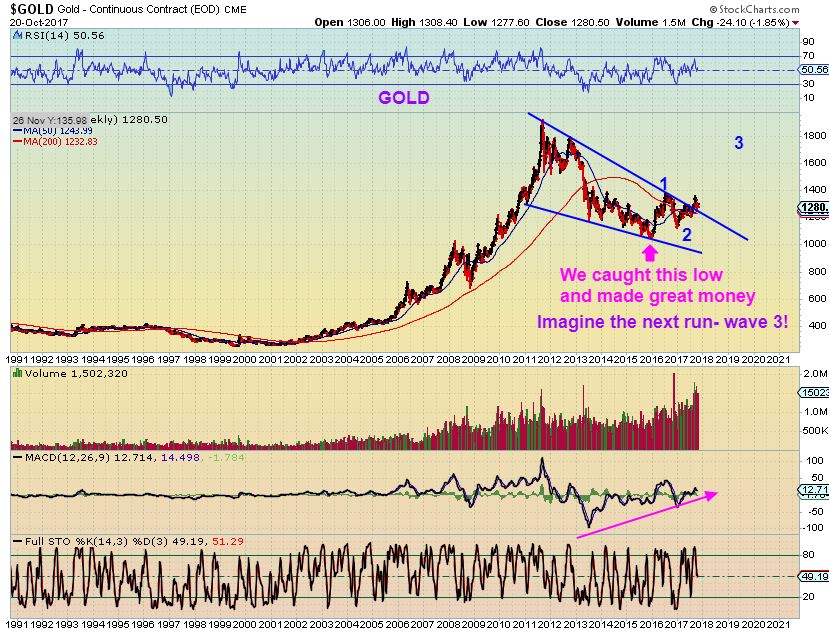
GOLD- Unbiased view – This was ONLY a 50% pullback in the overall bull market. If the Markets experience a blow off top soon, money should enter this small market again, and it doesn’t take much to push this higher. The gains that we made here when we caught the DEC 2016 lows were great, but they do not compare to what could be left on the table here. That was the start out of the recent lows.
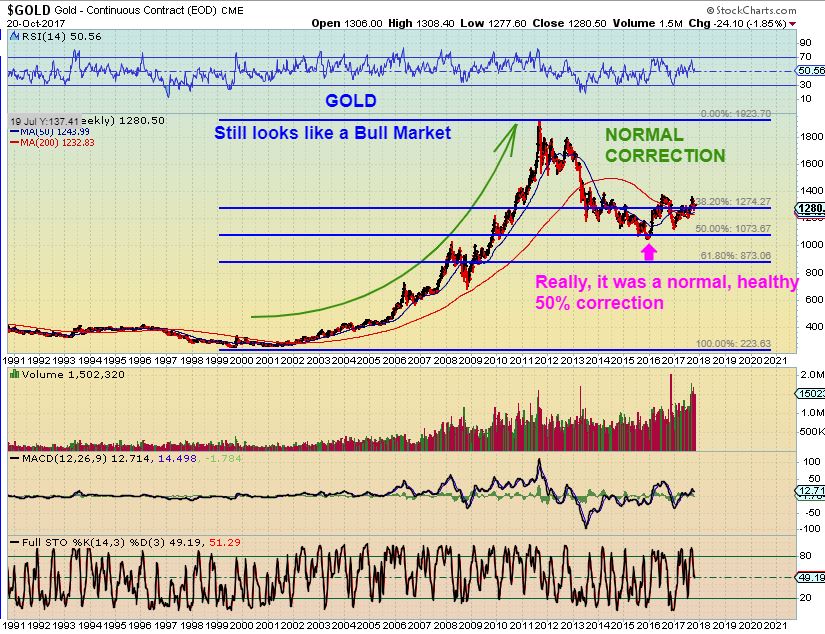
GOLD– This is why I expect greater gains down the road. The rally out of the 2016 lows was just the start of what should be much bigger things to come. My ‘3’ of ‘5’ shown here is probably quite underestimated in the BIGGER BIG PICTURE, but I would expect a pause at former highs.
Over the past months (and even year), I have received a number of emails where traders are asking me, “What do you think of the Bull Market in Gold? Has it died?” They have attach various articles from writers that say it died in 2012. I have also repeatedly been asked about the current bull market in the General Markets with regard to Gold, saying, “You seem Bullish on the General markets, yet you also seem Bullish on Gold, Silver, and Miners? Do you really think that Gold & the General Markets can run higher together?” and other questions come up pertaining to my article on the YEN & GOLD, the USD & GOLD, etc. This article should help to answer those questions.
.
This is the Bigger Big Picture that I am seeing right now. Yes, I have remained Bullish on the GOLD BULL Big Picture since calling the lows in Dec 2016 here, and you may recall that I called for OIL to drop to $26, and that was its lows. The Lows have been in place for Gold & Oil ever since. At the same time, however, I started discussing last spring that the General markets could escalate into a Parabolic blow off top, and people began to wonder how to reconcile the two ideas. I was also calling for the USD to top, when most were saying that it was going to $1.20 & then $1.40. So here in this report, I wanted to show how these various Markets can play together in the Bigger Picture. It is an overlap in timing, in my opinion. Often the top of one market overlaps the bottoming process of the other. Gold, Oil & Commodities have moved out of their lows, while the General markets are still flying, but may be approaching a topping period. We have been able to make some very good trades in all sectors, by timing the lows of Gold, Silver, Miners, Oil, Steel, Copper, etc. Riding the general markets with trailing stops. Trading stocks in many sectors, including Biotech.
In theory, Smart money builds positions at bottoms, as they slowly begin to sell out of the tops. They “Buy low & Sell high” so to speak. It is a bit of a process, but the charts can help you to see it better than I can explain it. Going forward, I do see more excellent opportunities for us to take advantage of as these markets continue to progress. I believe that there are huge gains to be made in the set ups taking place. And as always, as things play out, I’ll remain unbiased and open minded, to be able to capture the changes as they develop.
.
Enjoy the rest of your weekend, and as always, I thank you for being a Chartfreak too.
~ALEX
.
EDIT TO THE PUBLIC: During the week, I post charts in my daily reports showing the markets progress, forecast, and quite often ‘stock picks’ if I see low risk set ups with great potential. I was posting many with the Miners this summer, as Gold bottomed with the July lows. Those worked out well for short trades, but I’ve currently been expecting a dip in Gold & Miners. We’ve looked at some tech stocks occasionally, Steel stocks and Copper stocks, and many more. Let me show you some of the more successful set ups.
TGB – I’ve had a few that I have simply bought and held onto, and this was one of them. The large base was quite bullish and I liked the copper sector. TGB was a buy here around 40 cents as it crawled along the 50sma.
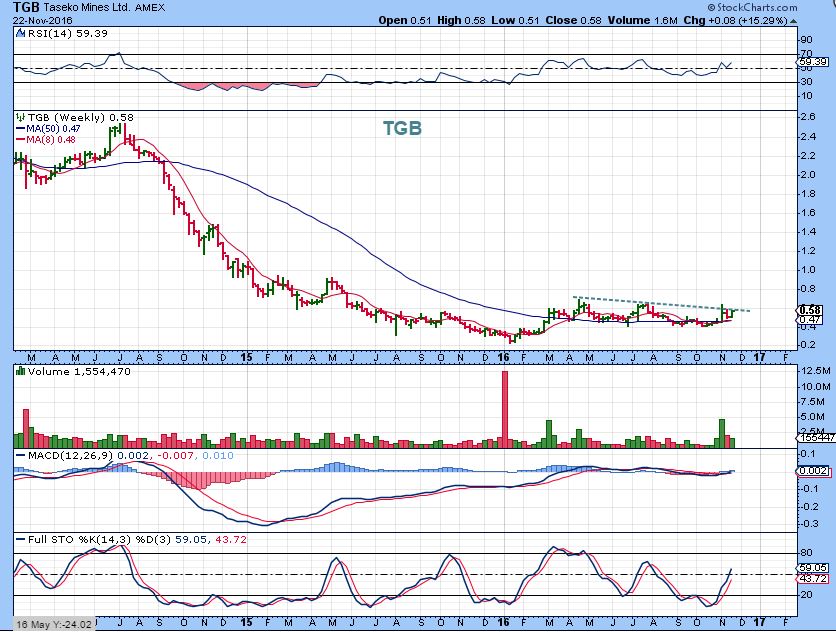
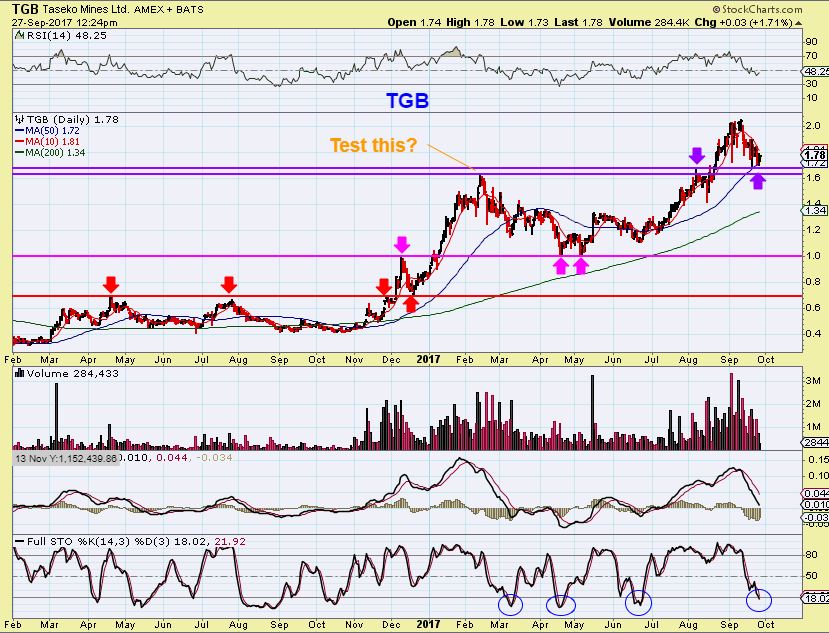
TGB WEEKLY – It was a buy again around 60 cents that week ( Or place to add) as it breaks out, for those that did not take the original trade. An eventual run to former highs is what I expected ( 40 cents to $2.40 is worth waiting for).
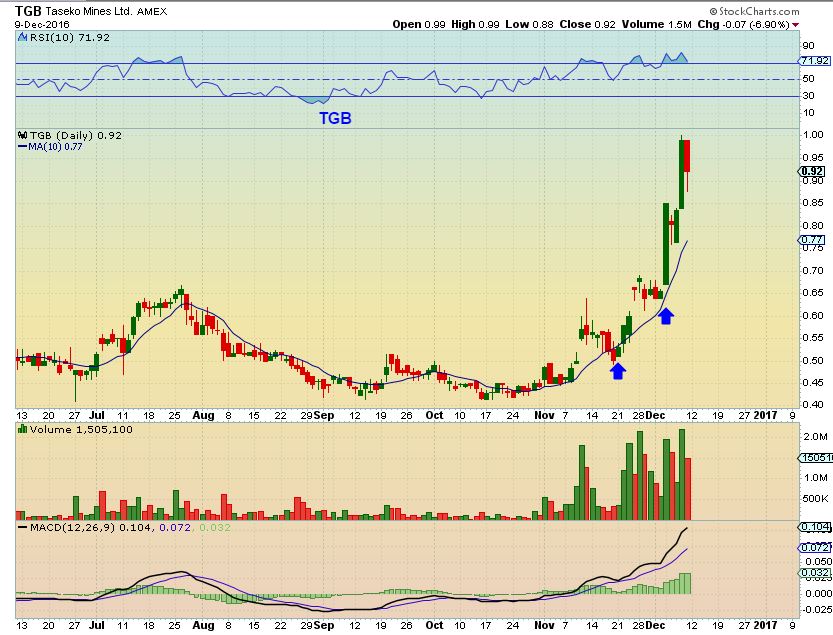
This is what that week looked like for those of us holding TGB
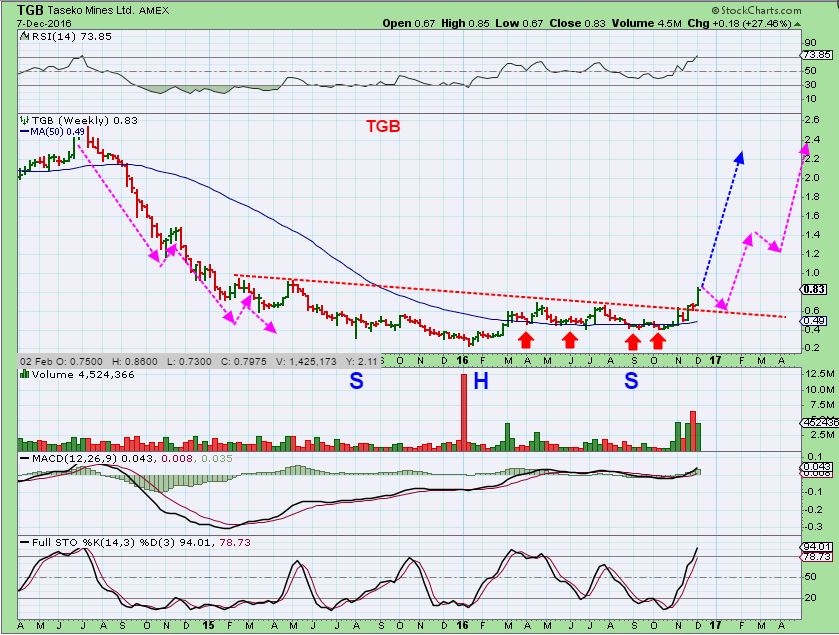
TGB ran to $1.50 and started a very long consolidation. I sold it during this time, but was re-entering here at the $1.20 area, above the 50sma and an inverse H&S
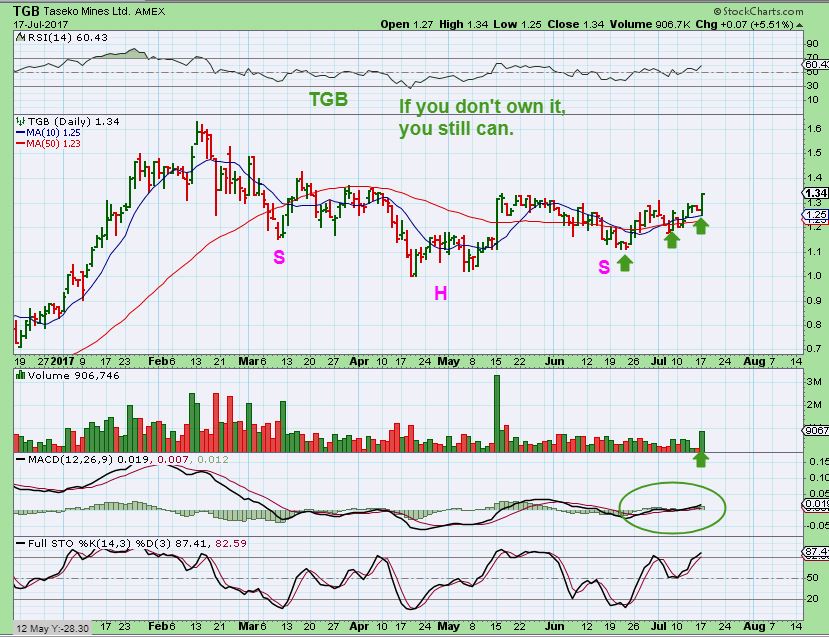
This back test was another place to buy or add. TGB actually ran up and hit $2.45 after this chart was posted. Huge gains were been made BUY & HOLD in TGB. I am now out of TGB again, but will continue to watch it and may re-enter the trade again .
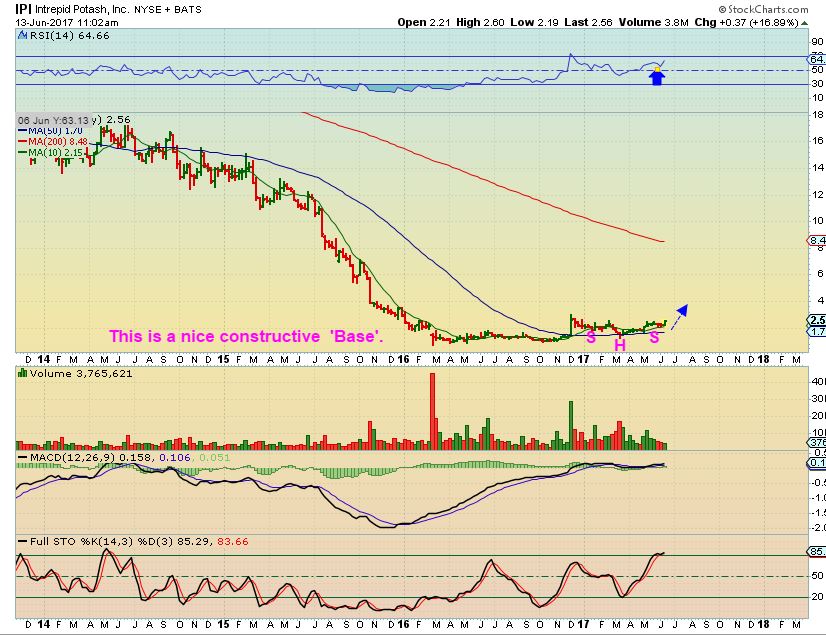
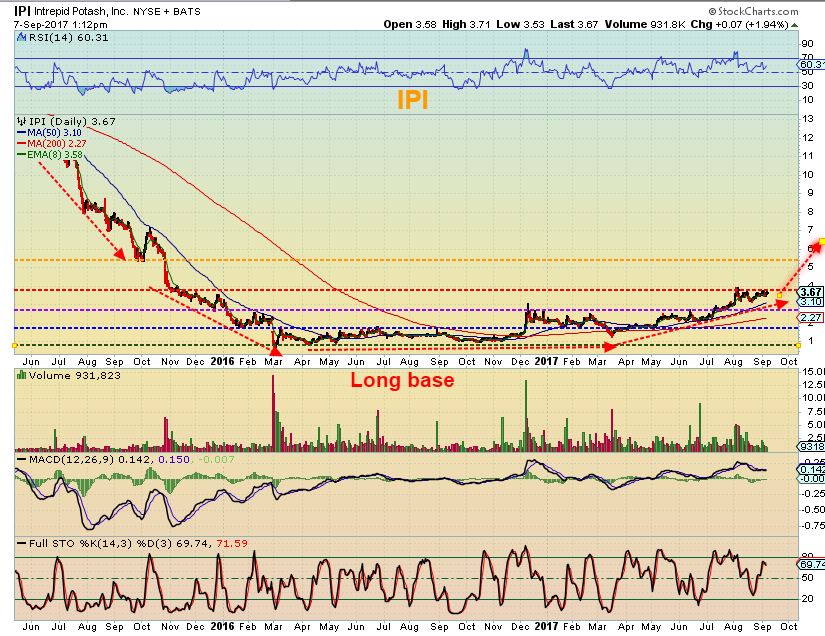
IPI was another longer term BUY & HOLD. This was a nice base, bullishly set up, and was a buy on the 50sma at $1.60- $1.70 as the Head of an inverse H&S tagged the 50. Here I was pointing out that it was now looking ready to go again.
IPI at $2.74, and still a lot of upside potential.
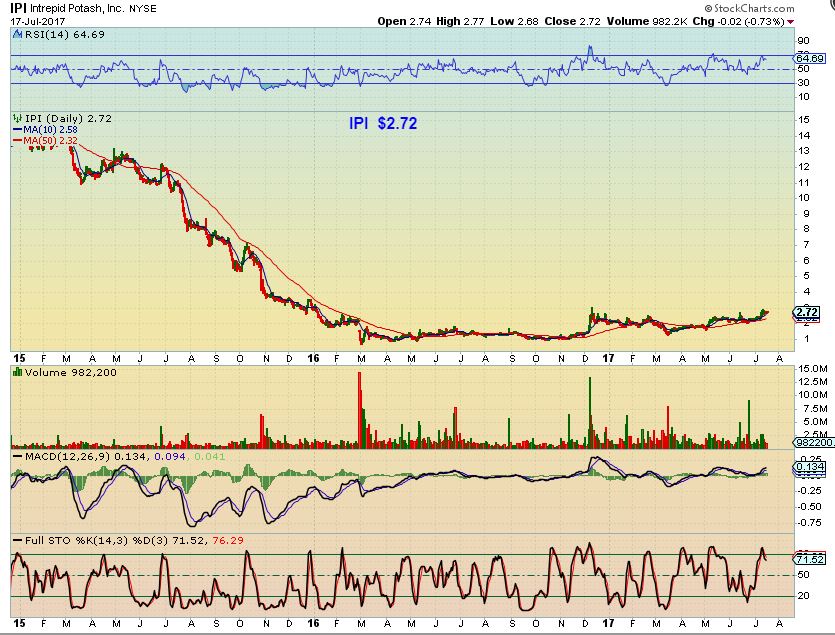
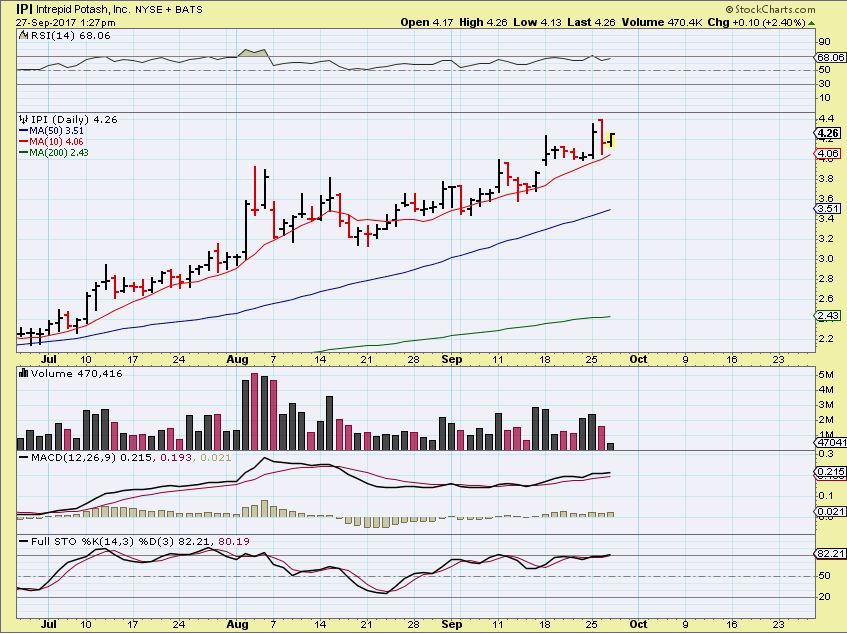
IPI – Now even $1 higher, this was a gain of over 100% , but I didn’t think that it was finished yet,
And IPI started to climb in a steady manner. Here it hit $4.26
This summer I started looking at a few TECH STOCKS that were beaten down but looked like they may recover. They included GRPN, TWTR, AMD, PXLW, FITB, and a few others that may not have been beaten down , but provided goo trade et ups. Lets look in this area.
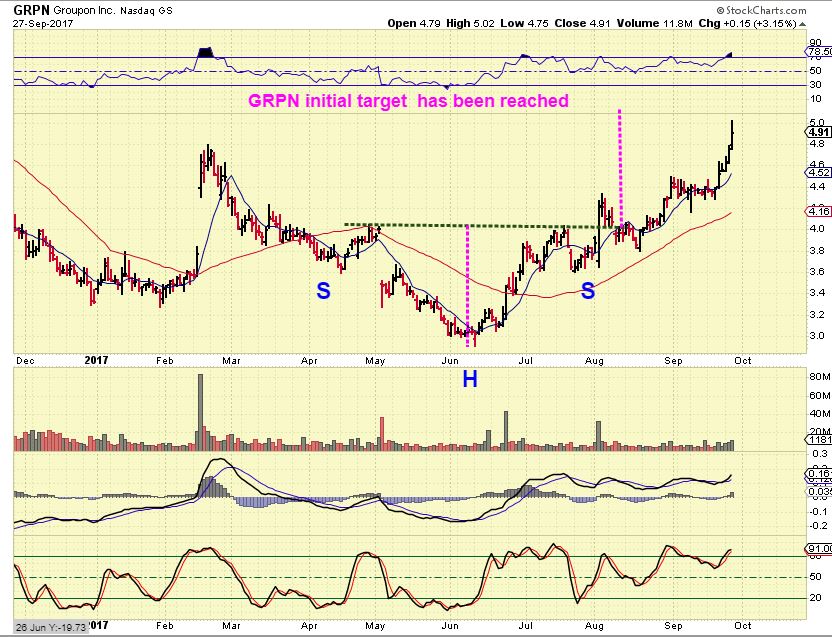
GRPN – Breaks the downtrend with volume, pulls back with light selling . Bullish at $3.00ish
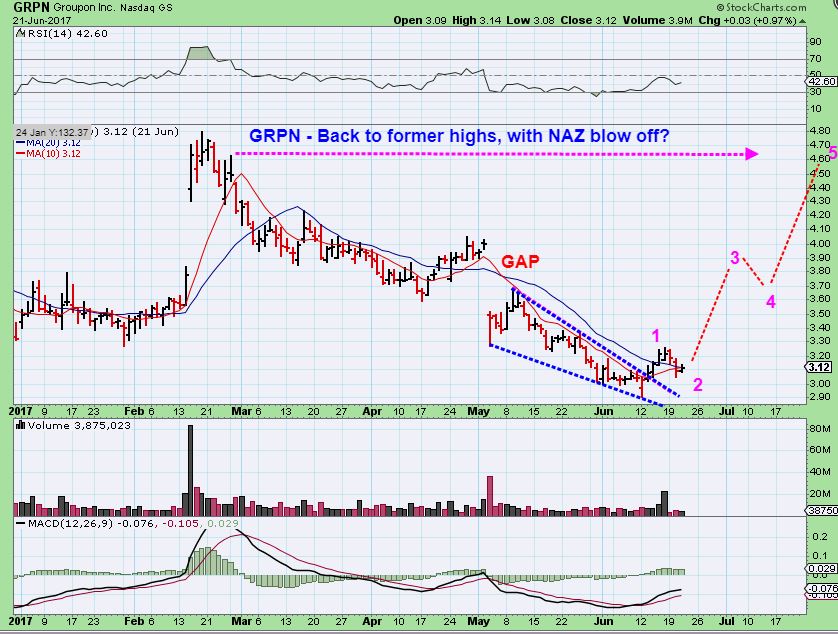
GRPN – Now $1 higher, it was setting up with another bullish pattern, you could buy or add if you were holding. I traded this one in & out, and was not personally in it at this time however.
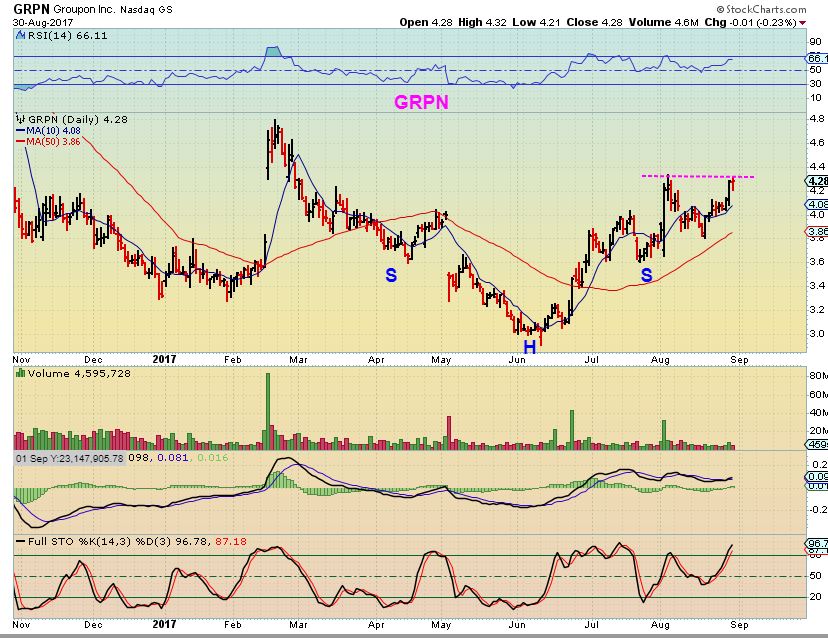
Sept 27th – GRPN was actually Breaking former highs. This almost doubled from the lows, but I only scalped a small gain coming out of the lows. It was another good BUY & HOLD for those that held on.
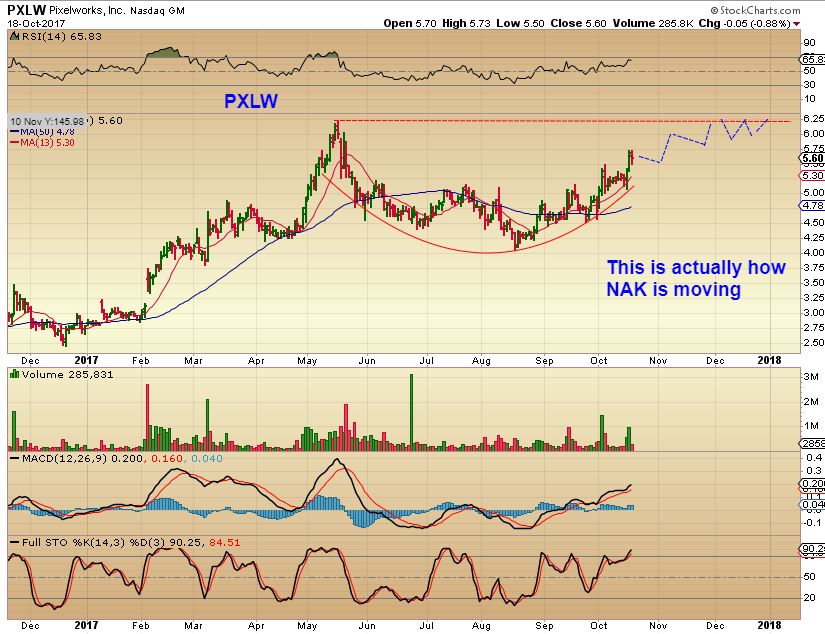
PXLW – More beaten down TECH that was recovering. A buy at $4.50 on the break out above the down trend, and also above the 50sma. I thought that this could run back to recent $6.20 highs over time, and even more.
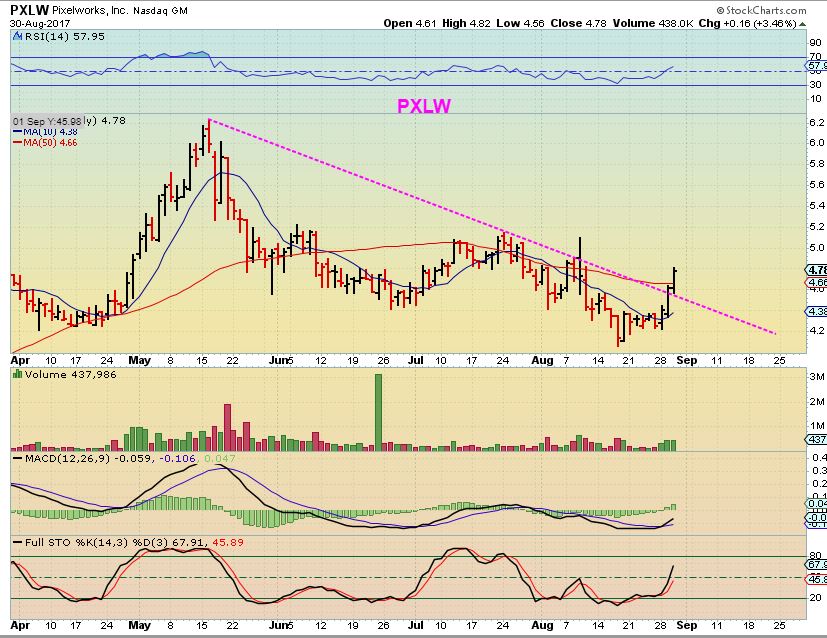
PXLW – It is still on its way in my humble opinion. I did expect a bit more of a straight up run, but this is an acceptable way to make 40% gains or more, if you have the patience. I didn’t, I just traded my share, but I like this set up).
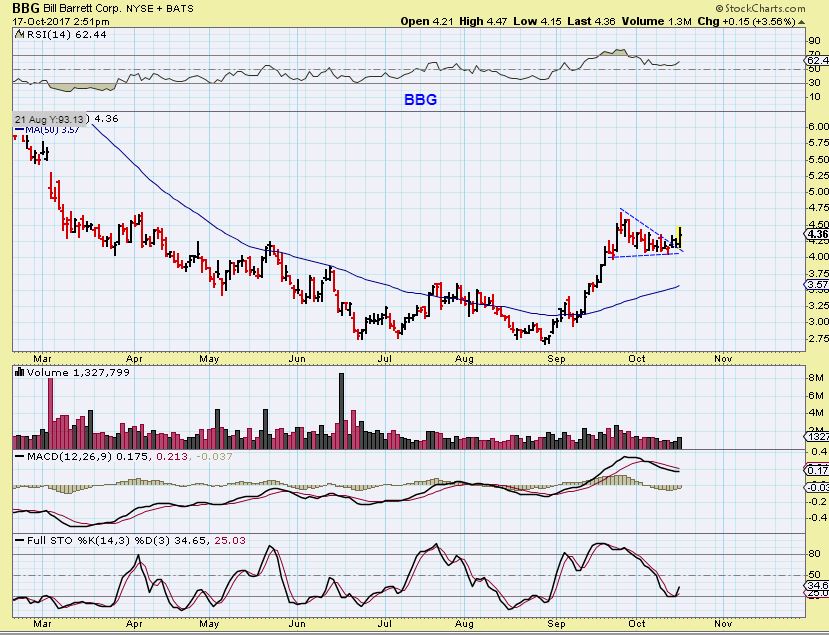
BBG – This one We caught and rode for a while. Earnings came out, no bad news ahead, and it looked to be breaking higher. A buy at the 50sma.
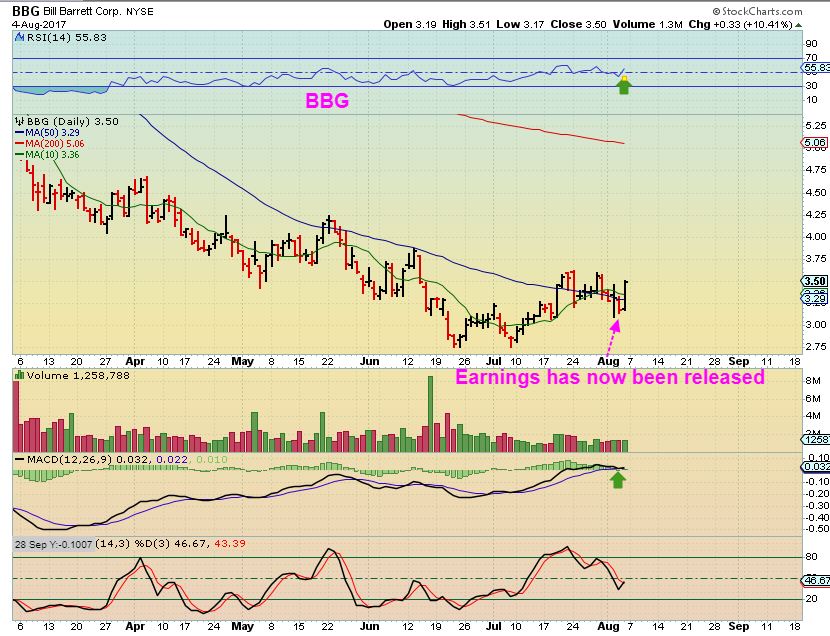
BBG has put in a strong climb higher out of the lows, and even now seems to be in a bullish consolidation, preparing for another move higher. This is a low risk buy with a stop below the flag.
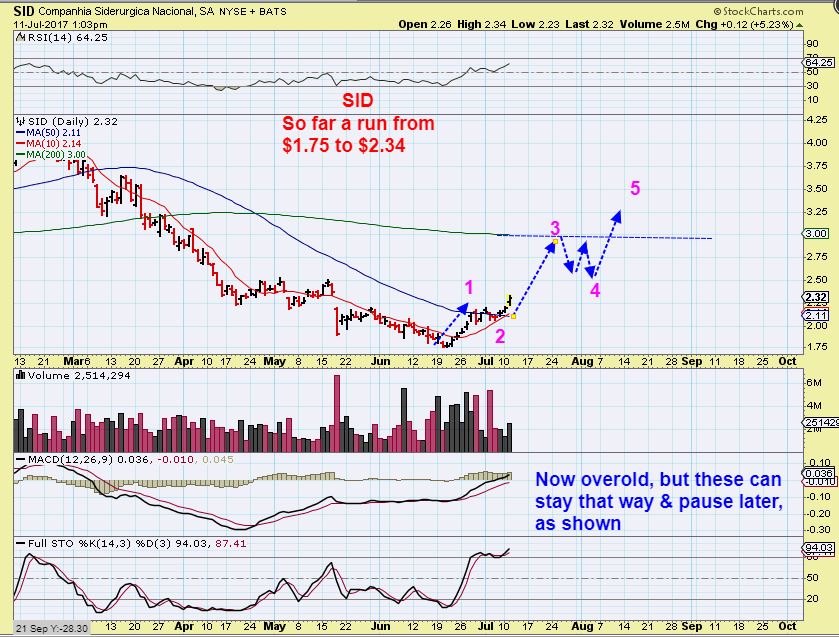
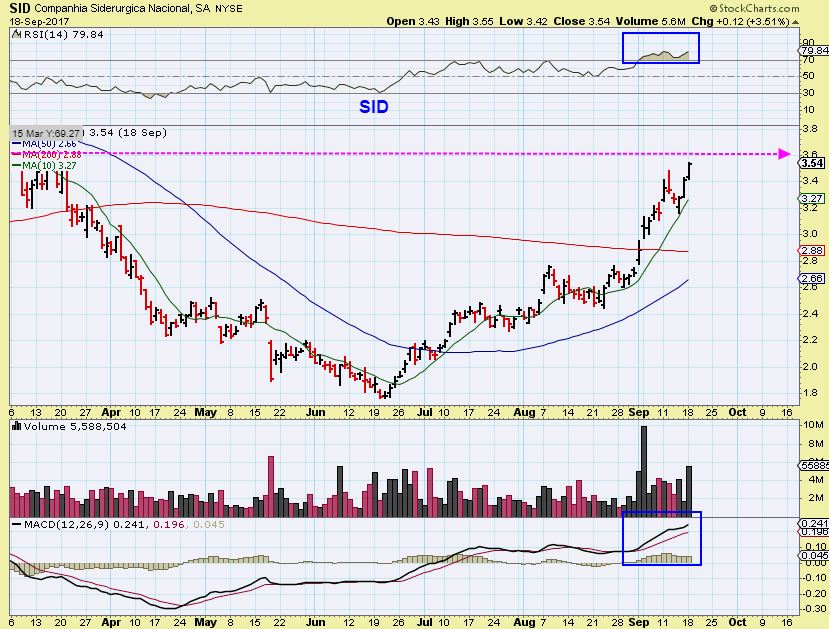
SID – I liked STEEL and STEEL STOCKS and SID had a nice volume signature at the lows. Could it really do a 5 wave move to the recent former highs though?
It sure did. Another very nice run.
Another crazy bullish area ( I do label it as higher risk, and warn my readers that these trades are not for everyone), is finding the BIOTECH BASES that are ready to POP. I try not get people too excited about these, because even though I have doubled my money on a few, they are higher risk and need to have reasonable position sizes. This is NOT a “throw it all on XXXX, and double your money” guarantee. Let’s take a look at a few that we caught…
INFI – I posted this chart on Oct 4th, but also posted it as a buy when it broke above the 50sma on Sept 29th 3 days earlier.
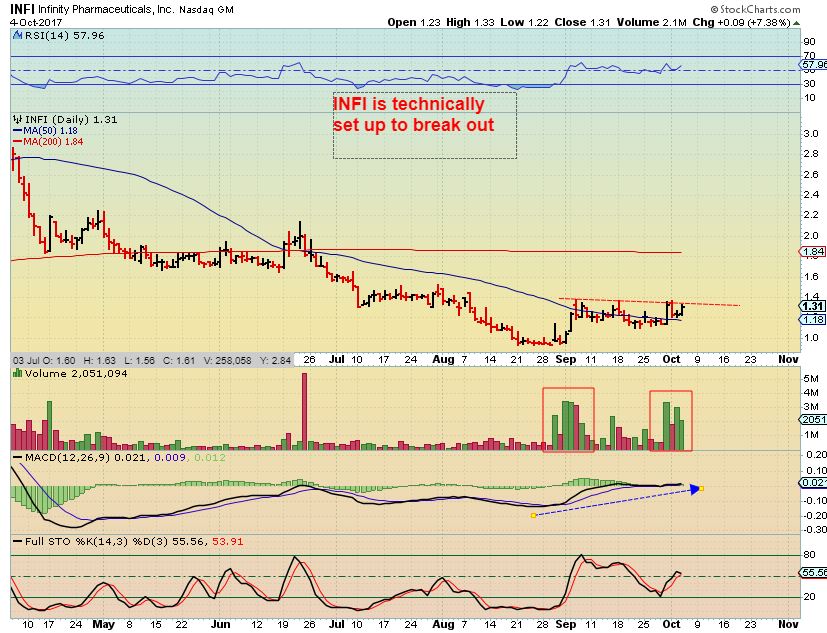
And Boom, after climbing higher for a week, it was up 123% on Oct 13. You can click these charts to enlarge, I dont know why this one is so small.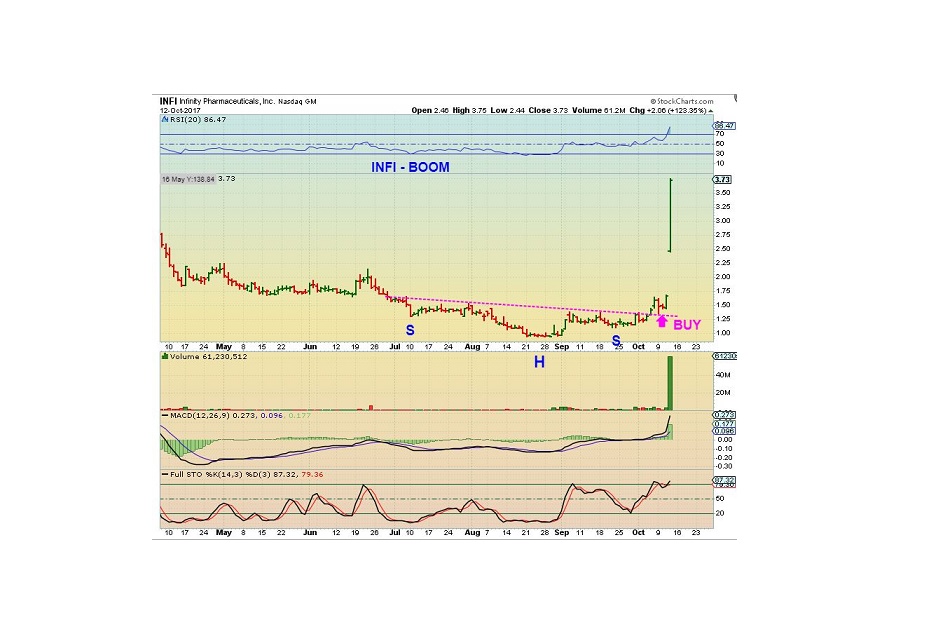
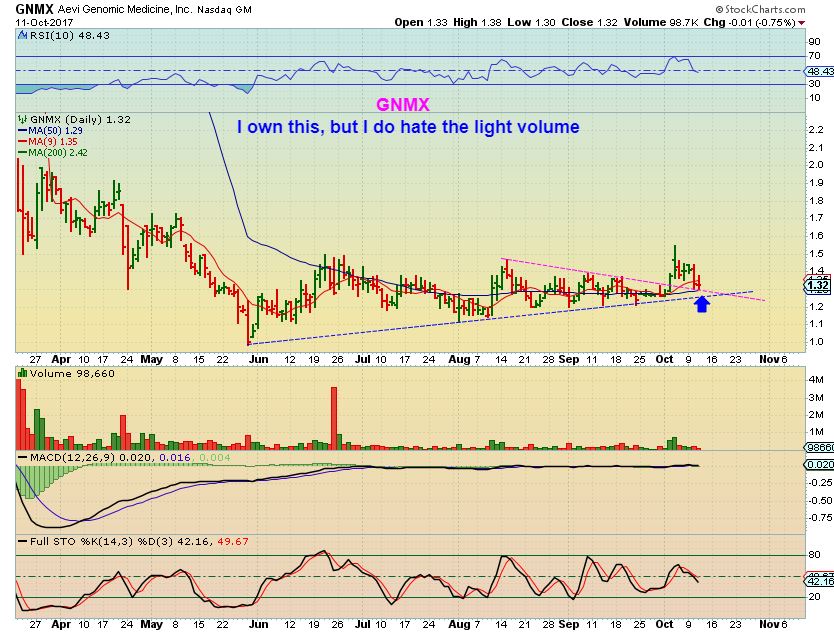
GNMX – I wasn’t very happy with the volume, but the base & set up were saying that this wants to pop higher too .
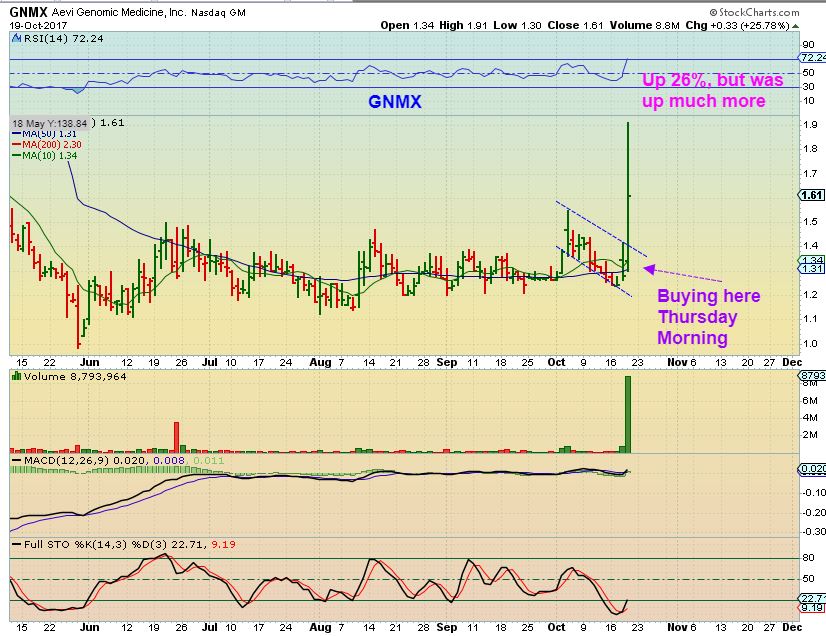
GNMX – ANd it did explode , up 25% on October 19th
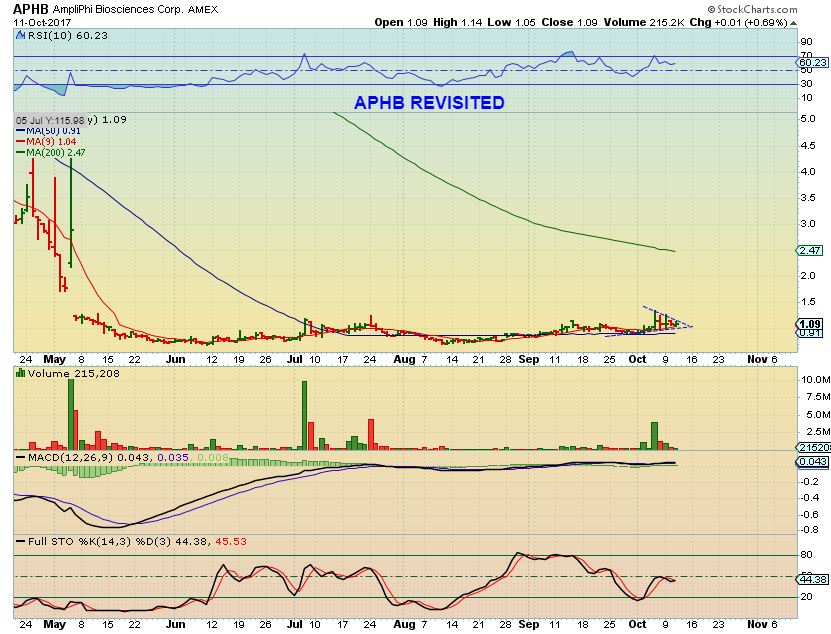
APHB – This base had many of the characteristics that I look for in the proper set up. Oct 4th it didnt quite look ready, but I was watching it.
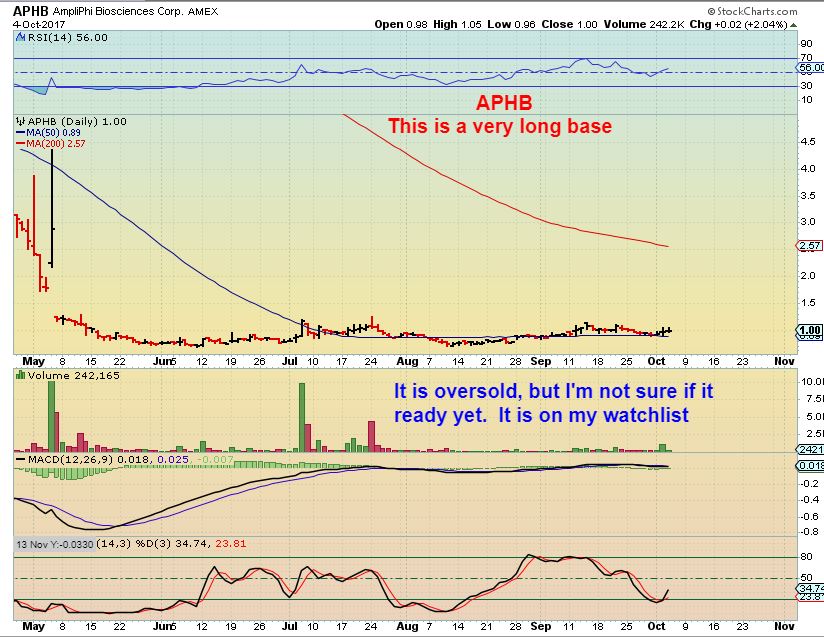
APHB OCT 11 – It actually did POP, but wasn’t quite ready to run. About a week later, I pointed out this pattern, and this looked ready to go now. It was a BUY at $1.05 to $1.10
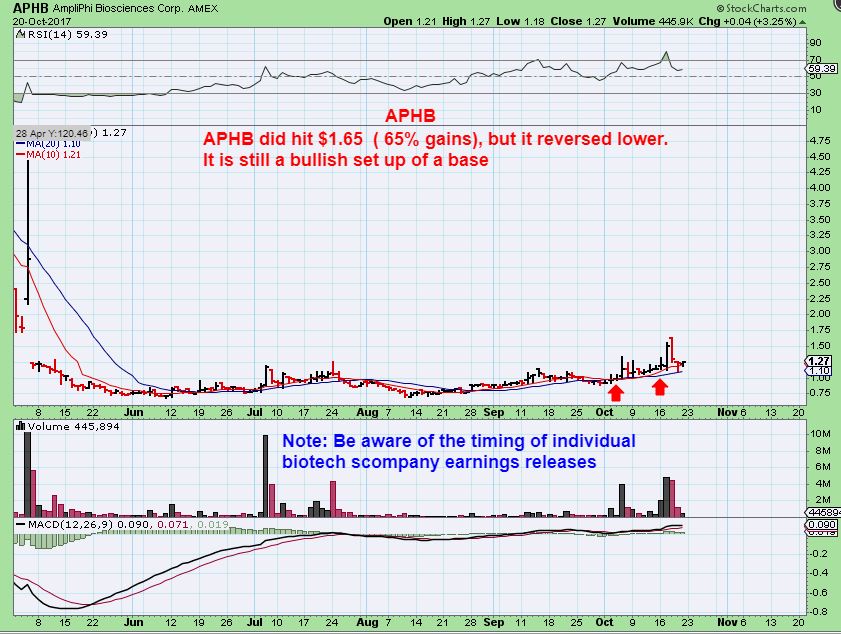
This doesn’t look like much, but that was $1.05 to $1.65- and I think it has further to run too. It is still a long base.
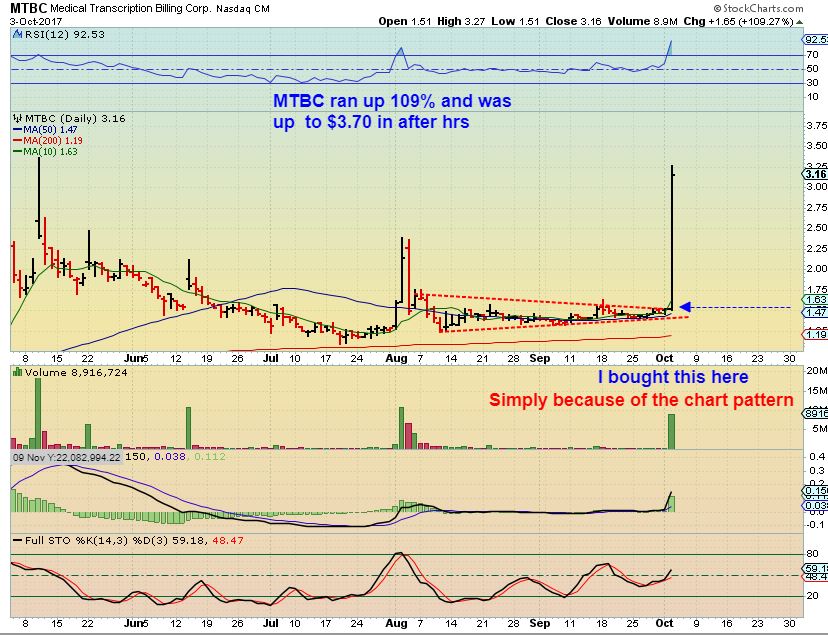
MTBC – Caught this one and sold most of it the following day when it ran even higher. It is currently possibly bull flagging or consolidating.
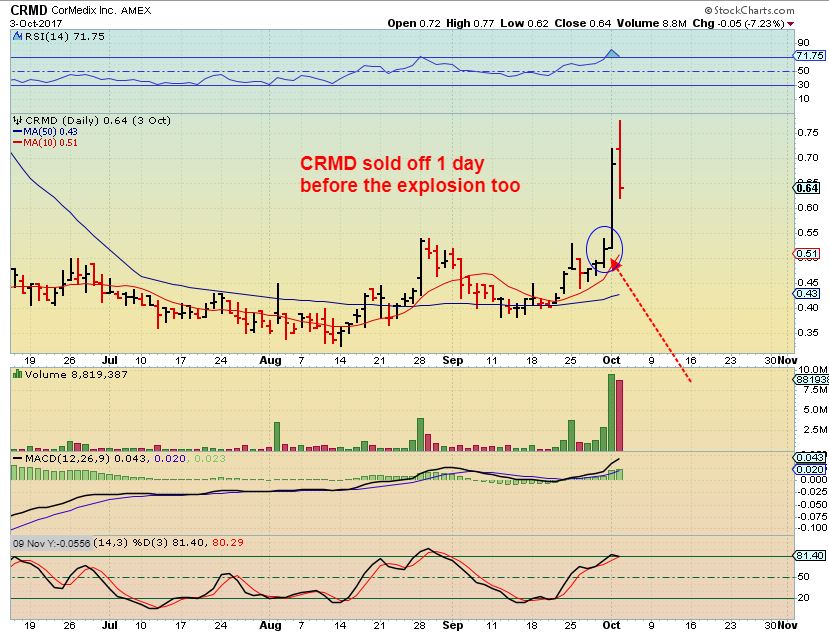
CRMD – As you can see, many of these got absolutely crushed last spring, and now have formed very constructive bases. This one, I pointed out the possible GAP FILL that could occur, since there would be no resistance in that area. It was a buy at $0.40-$0.50 cents crawling around that 50sma on Sept 29th.
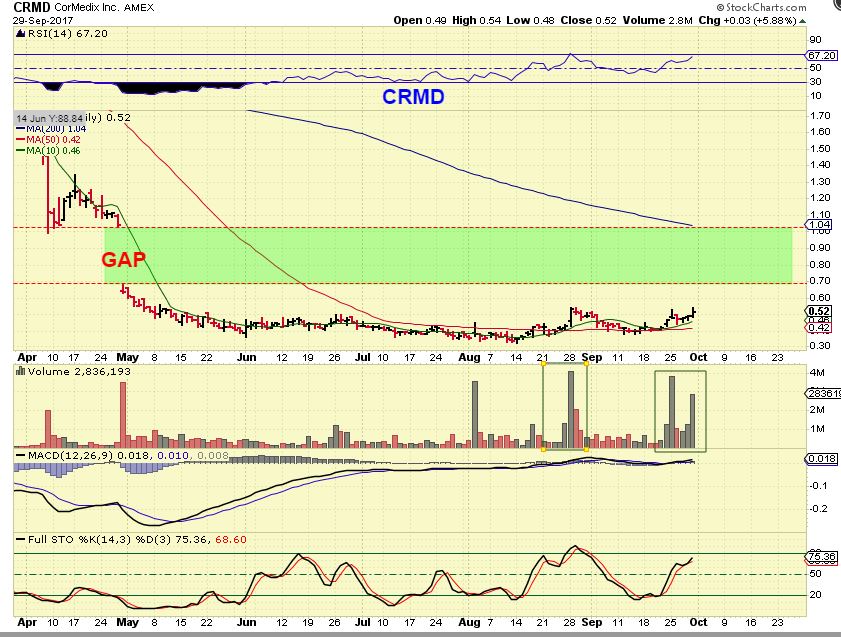
CRMD – CRMD popped, dropped and ran back to $0.77 again and is currently consolidating these gains in the $0.60 area. Most of the time, it is best to sell the pop & just lock in gains and keep shopping. 🙂
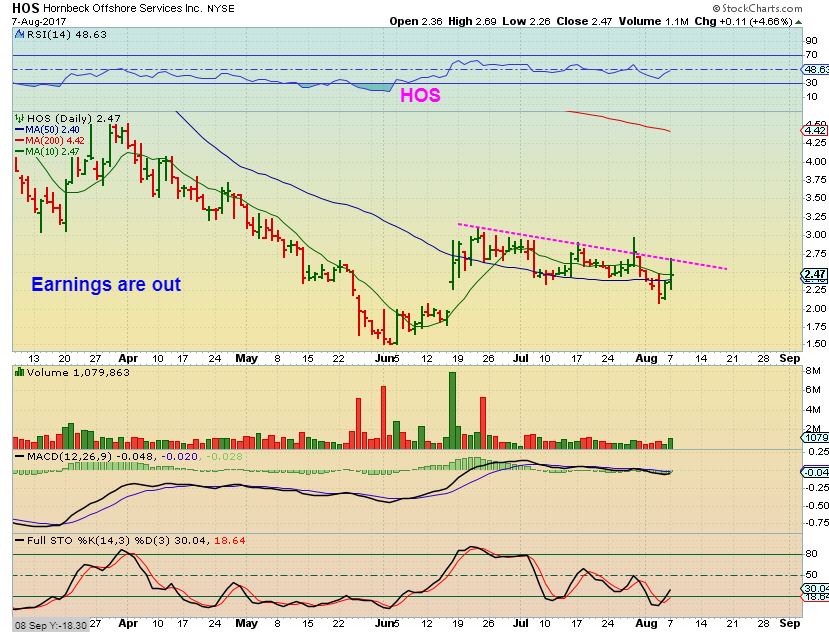
HOS – When the XLE finally looked like it was bottoming in AUG ( Double bottom), I bought this one, because it bottomed Early in June, and did NOT sell off with OIL , XLE, & the OIH in July, and the consolidation leads to upside potential. In at the 50sma $2.50 ish
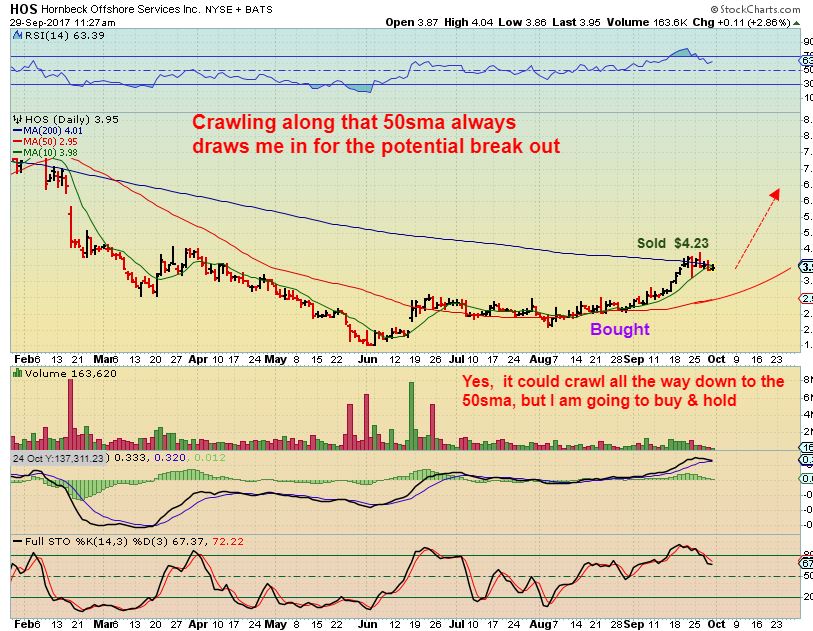
HOS – This took off and ran to the 200sma ( Where I said that I would probably sell mine). I actually re-bought it later under the 200sma and sold it for additional smaller gains. Now it is currently dropping back to the rising 50sma & is only my watch list.
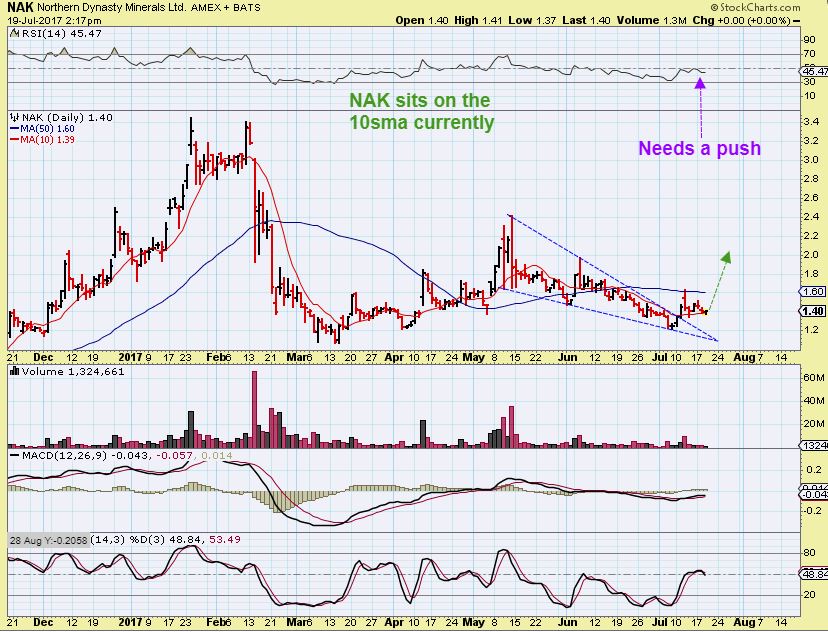
NAK – A longer term Bull
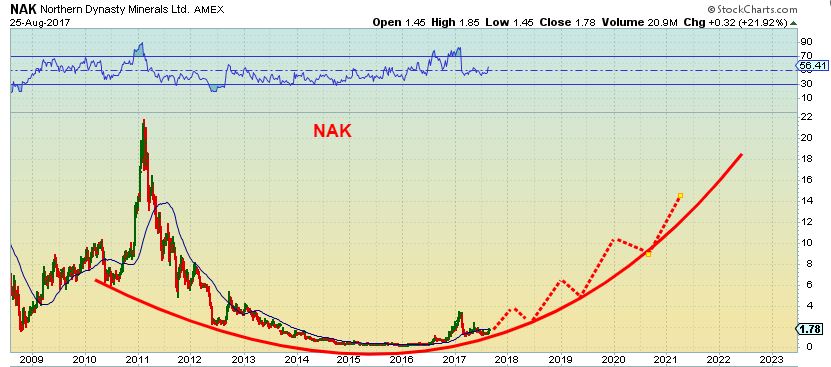
NAK – A buy at $1.40 this summer
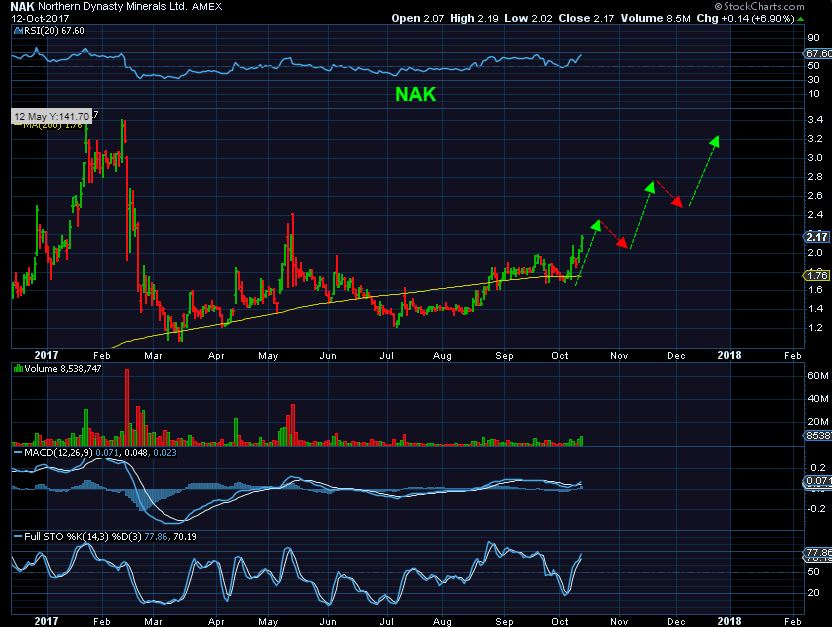
NAK – Just a buy & hold recently, and we added on the way, it is now almost 70% gains and I expect higher prices from here too. This one has taken patience, since the rode higher was a bit bumpy.
Of course, let’s be honest, not every stock pick works out. I have been stopped out for small losses in some nice set ups too, everybody does! However, if you can add some large gains to your small losses you should find that your trading improves, your experiences and learning improve over time, and your account should grow. The most exciting trades lie ahead in the gold market in my opinion, and here at Chartfreak, we killed it in the 2016 run. Recent trading in this area out of the July Lows worked out well too, but I’ve been expecting a dip down into another final deeper meaningful low toward the end of the year. When that low is in place, that will be an excellent time of trading in the Precious Metals Sector again.
For the public readers – If you think that this kind of analysis can assist you with your trading by adding it to your style of trading, along with daily reports that may include some stock picks as a low risk entry point, why not join and try us out for a month or a quarter? Thanks for checking out Chartfreak. 🙂
Chart Freak Premium
Chart Freak members receive up to 5 premium reports per week covering a wide array of markets. Come and join the ChartFreak community as we trade the new Gold Bull Market and various trending sectors.


GDX going to open right around it´s 200 day MA. We´re here, ladies and gentlemen!
GEVO is now lookin good if it stays above 0.69
It’s a long time ago my dear friends, but I’m (thanks to the Lord) still alive and very active.
ALEX….. THANKS A LOT for your EXCELLENT REPORT. Alex, how you explained and see the big picture I can’t put it in words…. but I’m very happy what you do for us !!!
G-Morning GUERT!
Yes, it has been a long time since we heard from you. Nice to hear from you again, and thx
UGAZ & BOIL – NICE
Strong volume in ATNM as it gapped open today. It is now closing the gap, I have mentioned that I already own this,…
I just bought CUR after it gapped open and then closed that gap – I bought the GAP FILL because I like the base & the way this looks. – Obviously no guarantees, but it looks like a bullish set up and could be close to ready
So far, lack luster, but the other one that I have been pushing HTGM is taking off.
Hey Alex…what do you think of the chart of NMKEF?
I actually mentioned it a while ago while you were away
It is lithium, and I mentioned 3 that were in uptrends and looked bullish. I bought one. The one I bought I got stopped out of and it dropped ( figures) , the other continued higher, and NMKEF was one of them.
NMKEF & LACDF were the two that remain bullish & in uptrends.
The one I Bought was LIXXF and I dont know why it dropped
So I like it, but there is a proper place to buy these to avoid draw down. This is at $1.33 & may bull flag or continue higher, but it should have been bought at the $1.15 area. I cant offer you a low risk area to buy unless it bull flags or drops to back test the break out
Thanks for the info!
Bay trader, my itaget of $16.50 on JNUG a couple of weeks ago almost hit this morning but it may not even hold and $15.50 is easily in play if the dollar sees $97 as Alex predicts. I’ve been holding dust for a run to $29-30 but it hasn’t been moving like I’d hoped or thought it would either.
Thanks for the BIG picture. Good for those of us who like to hold some things longer.
Tried TNA again and had to stop out. Every time I try that I get stopped. Maybe it’s not for me.
I hope now that CLDX has gone down and about tagged the 50 day in a re-trace…that maybe it’ll get moving now….long term chart looks good to me, just been holding through this pullback…..getting impatient….but now is probably the time I should have been buying it…..?
Had to let this one go with a loss…couldn’t take any more draw down…..now it will likely go up…..but it seemed to be failing to me…..long term chart still looks good….maybe it was just a shake out
NKE stopped me out a week or so ago and decides to turn up and rip now. Im still liking it for a swing..
WOAHHHH EGO
think thats called ‘surprises to the downside’
OPGN… hopped in some a bit ago
INFI …. hmmmm …
SOL would have been a nice boat to be on this morning…..popped out of that base
RENN …
so much for RENN …lol
KTOV …
What is that RGSE part 2.
It’s been a while since I ‘ve seen the Solars POP that much in one day
Maria – xxii….
HTGM : earnings Nov.7th. post bell.
Hi Alex,
Do you mind taking a look at NIB (Cocoa ETF)? In August, it had a record high short COT with a rounded bottom and has since been moving off it’s low. Think it’s too late for a low-risk entry for a long?
Thanks!
SNES….looked at it early this morn when it was up a bit….didn’t get it.. and then stopped watching……wow, now look at it….