Archive for month: March, 2015
I wanted to take this time and just share a few charts that I have presented to my premium members in various premium reports last week. Of course as time moves forward , charts can morph and change , so we keep our eyes on things as they unfold. Currently, however, things are still playing out as expected.
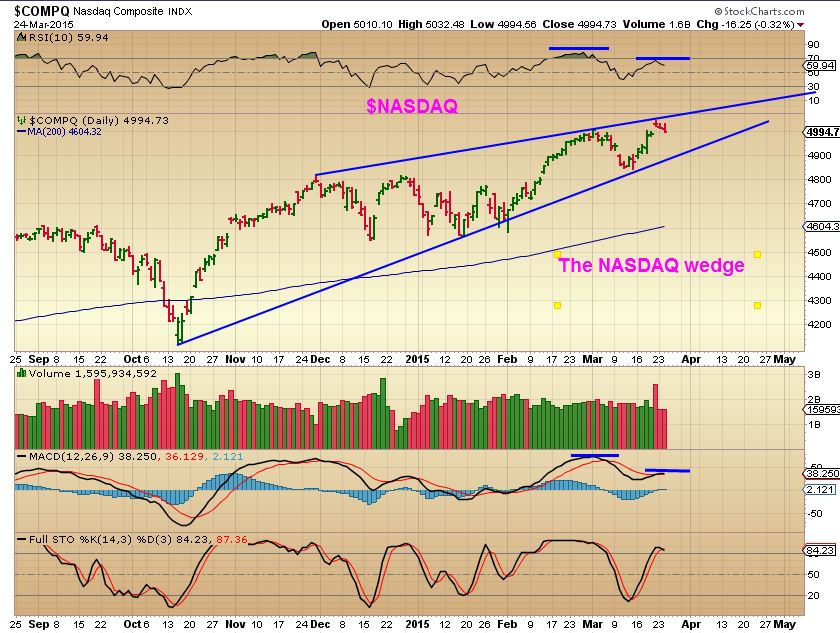
March 24 NASDAQ - I was pointing out a wedge pattern. They are bearish if they dont surge higher and break the pattern before reaching the apex.
Click to read more of this report
Read MoreI really like the way things are stacking up, it seems that some nice opportunities are approaching. Lets look at some charts and you'll see what I am talking about.
Read MoreThings seem to be playing out as expected, but that still leaves a few unanswered questions longer term. Lets look at some charts...
$USD - the pullback has acted exactly as expected (So far)
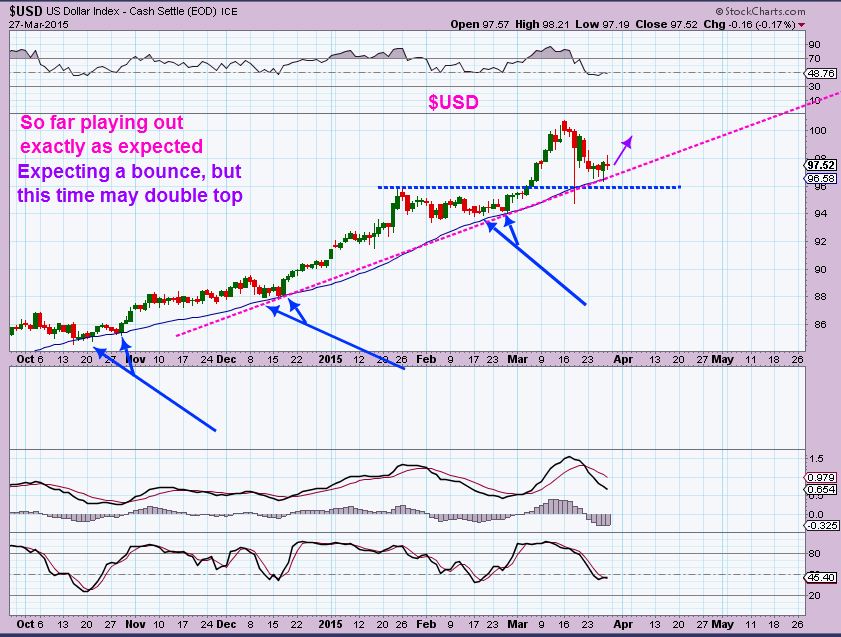
The weekly chart of the Dollar has been very strong...
Read MoreOften my Thursday report covers Thursday and Friday, leading into the Big Weekend Report, but a lot happened today, so I wanted to put out a Friday report. After a large drop Wednesday in SPX, DJIA, NASDAQ, IBB, etc , I felt we were right on target with the series of charts showing the Wedge Pattern, but were we about to slam right through it and break down? It looked it ...
Today, we saw this in many markets...
Read MoreWe re-entered Energy/ OIL stocks for a while waiting for Oil to POP. It really popped yesterday and overnight too, thats a perfect reminder that patience pays off if you're looking at the charts correctly. Gold & Silver Popped overnight and we'll discuss that, there is a Bullish and a Bearish Scenario that I have been pointing out and believe it or not, both are still possible. Then I have one more important reminder to point out. Lets get to the Charts...
This was my NASDAQ BEARISH WEDGE - from yesterdays report
This is the NASDAQ chart after yesterday...
Read MoreLets discuss the overall markets and then I'll tell you why I am looking for clues...
QQQ - Not much has changed, this takes time to play out, this was March 23
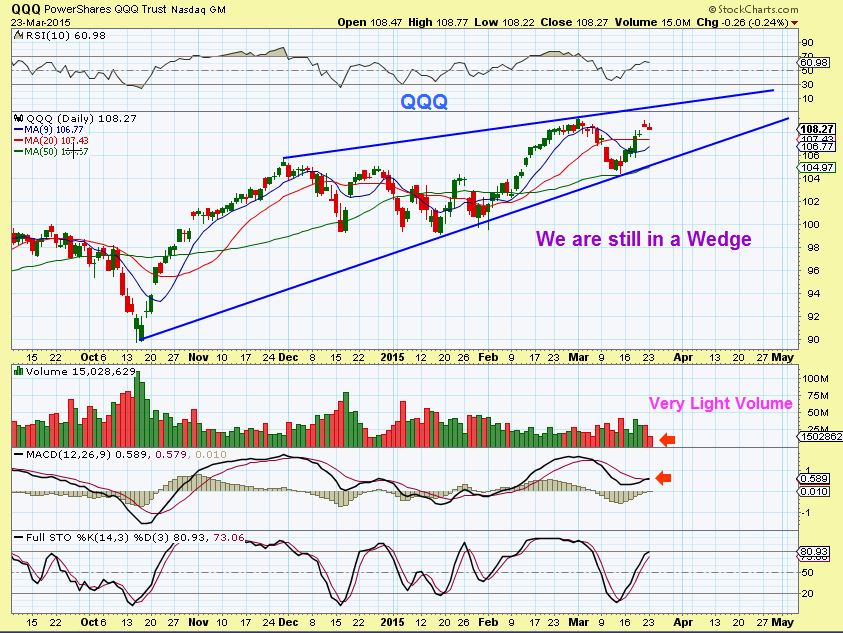
So we look at what happened since then...
Read MoreNot a lot has changed since the weekend report, so lets just look at some charts...
March 20 - The NASDAQ looked due to pullback
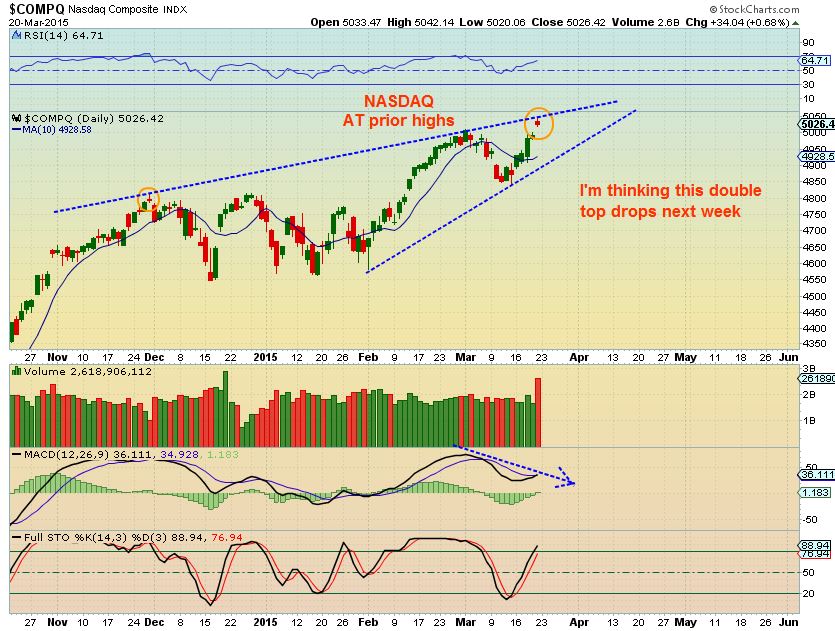
SO did it start to pullback, and if so, how far is it likely to do so?
Read MoreAs expected , the Fed Mtg Wednesday caused several areas of the market to really start popping. There is so much to cover this weekend, so lets get right to the (29!) charts...
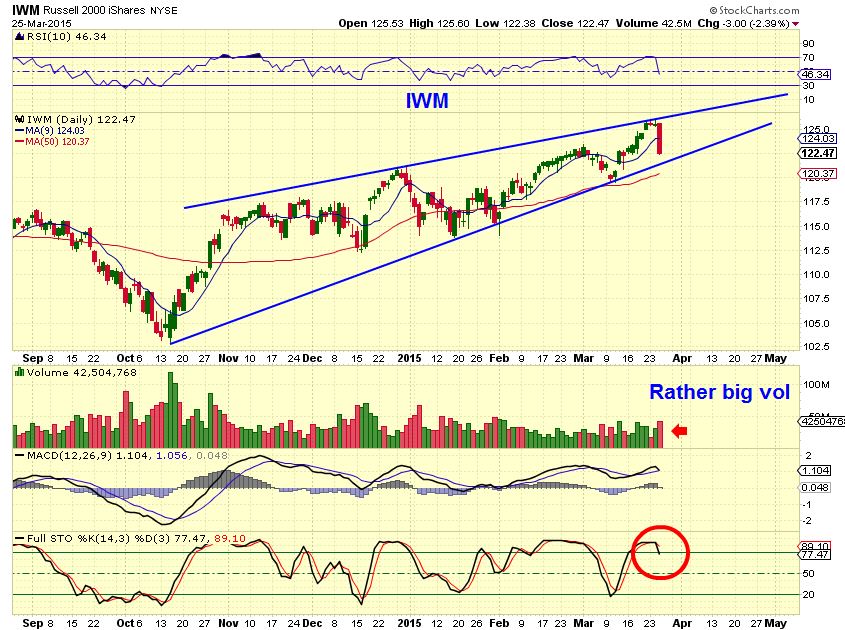
Starting with IWC - As pointed out over the past several weeks, This is a bullish looking set up
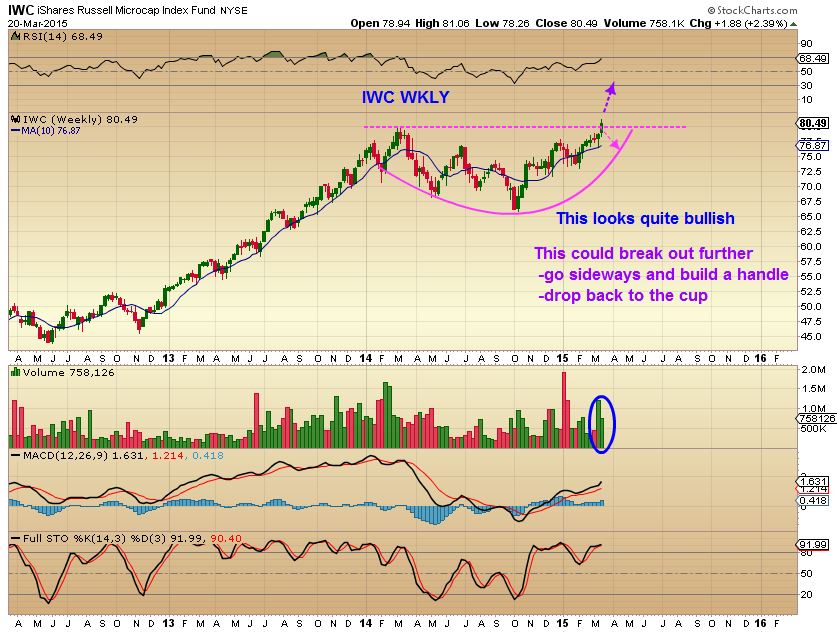
Another Bullish looking set up is he following chart...
Read MoreIn this past weekends premium report & again on Monday March 16th, I posted developments that we had been watching In OIL/ENERGY /METALS. I am going to share a small part of those reports here with you , and let you draw your own conclusions.
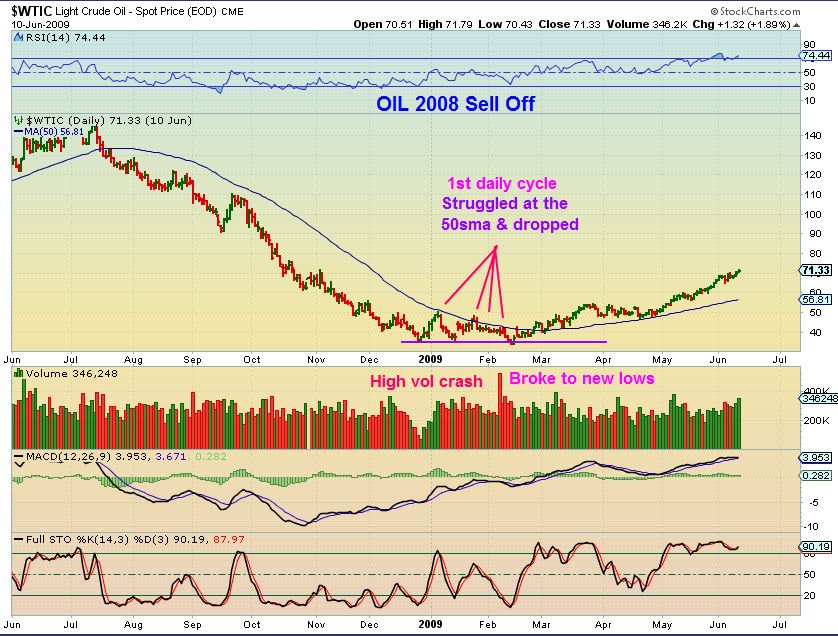
MANY went short OIL this week . The Wall Street Journal , CNBC, and several other letter writers warned of an imminent breaking down of OIL to the low $30’s. So when People saw OIL break to new lows- they got very bearish & shorted it. I like to check the charts and see if they can tell me something about what I am seeing. I noticed that in 2008 when OIL was attempting to bottom, something similar happened, so I posted this chart for my readers.
$WTIC 2008 – Notice how OIL struggle under the 50sma, then made a false break down to new lows. How many went short then?
$WTIC Friday March 13- Struggled under the 50sma and then it gave up. ( It now has dropped to new lows this week). Many went short.
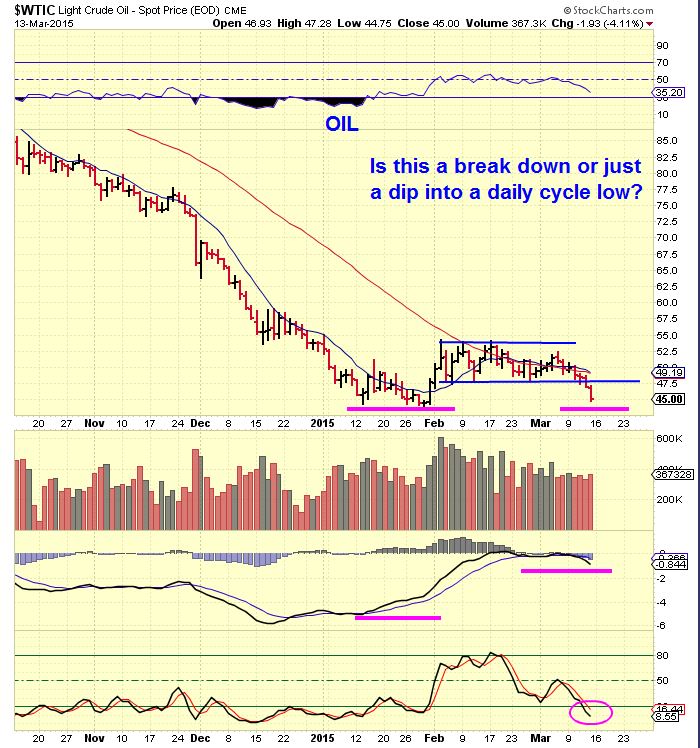
.
.
Going one step further I asked myself,
“Are ENERGY stocks breaking down to new lows too? Do you see any reversals in ENERGY STOCKS?”
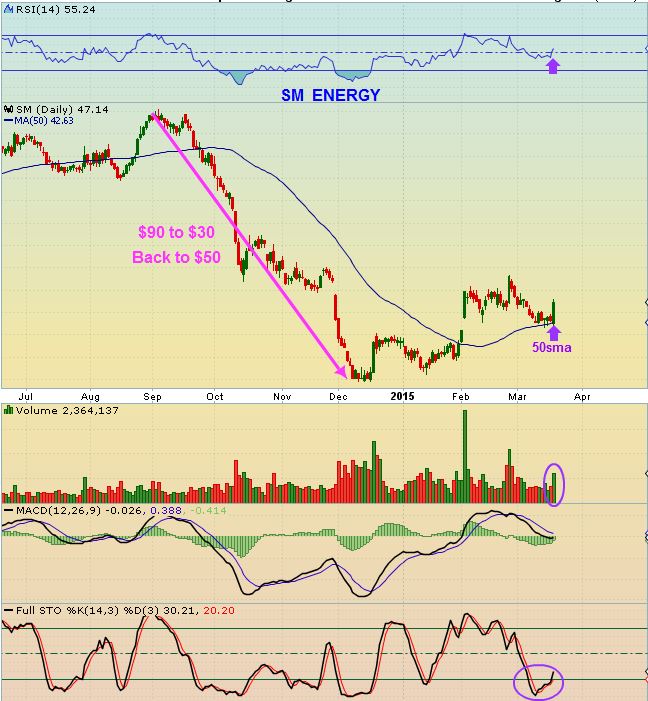
Check out SM – no new lows, it just ran from $30 to $50
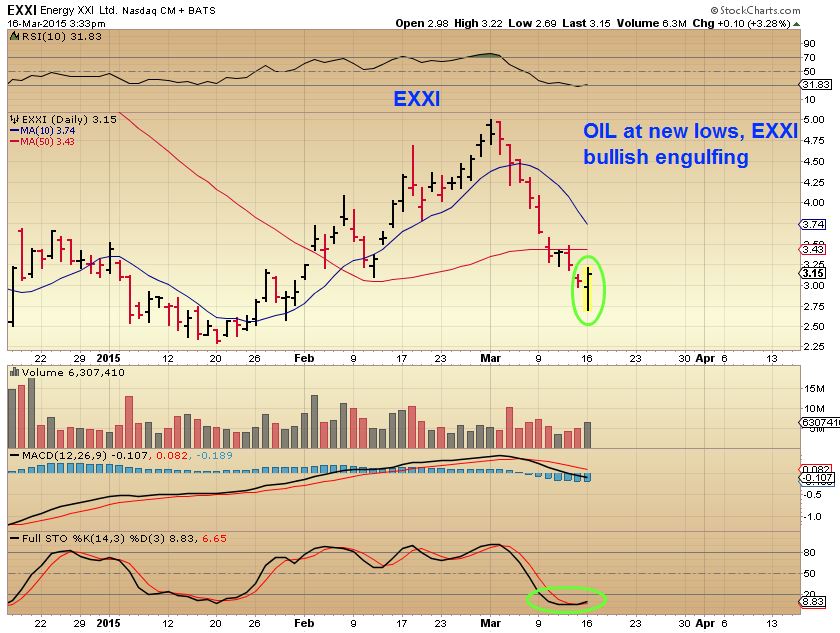
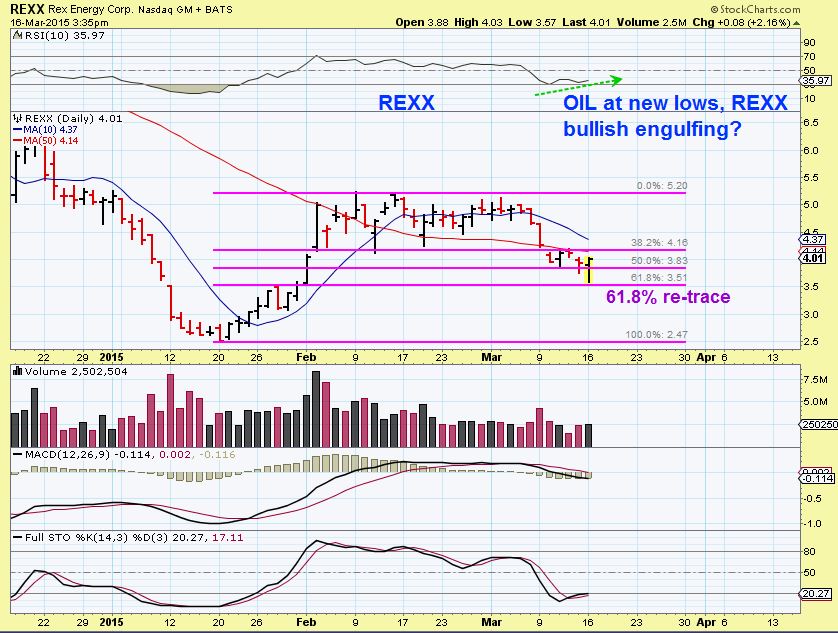
From Mondays Update: Look at REXX, EXXI, ( And I pointed out others) I wrote…
I may be early, but I took a couple smaller positions in EXXI, REXX , because I can place a stop below todays lows and they are bullish engulfing with OIL at new lows.
I concluded by also mentioning that with OIL at new lows, the XLE was looking rather bullish.
Reversing while OIL is at lows is also the XLE.
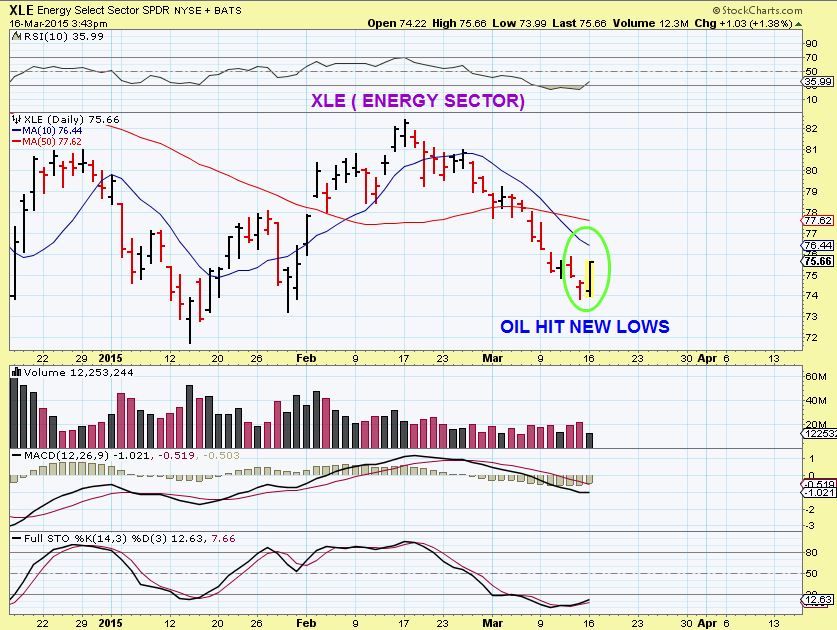
This is the XLE today as I write this (March 19)
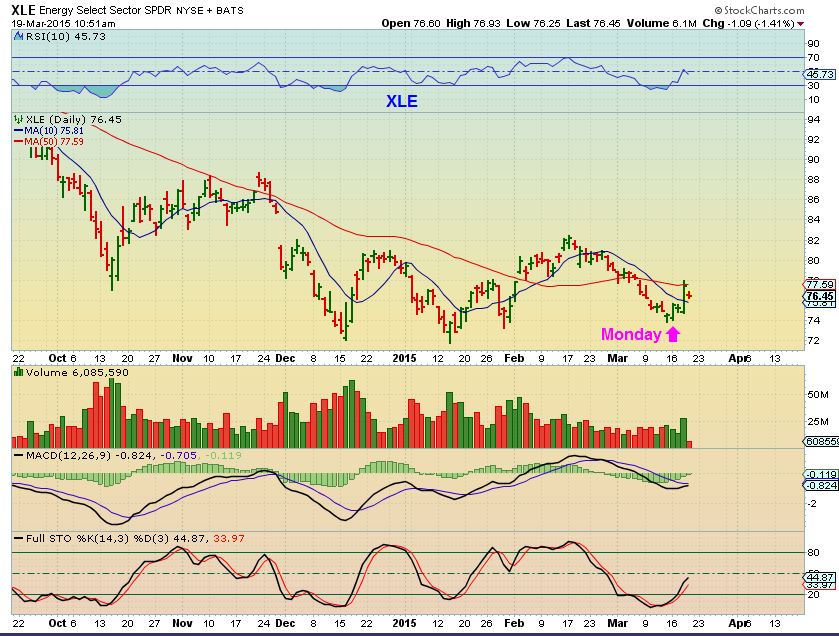
But wait. In that above XLE chart, I see ENERGY bouncing , and then dropping, bouncing and then dropping. Is there any safe way to trade this? Will this be a lasting type rally this time, or will it roll over again and again as it has in the past? I will be covering that in this weekends premium report.
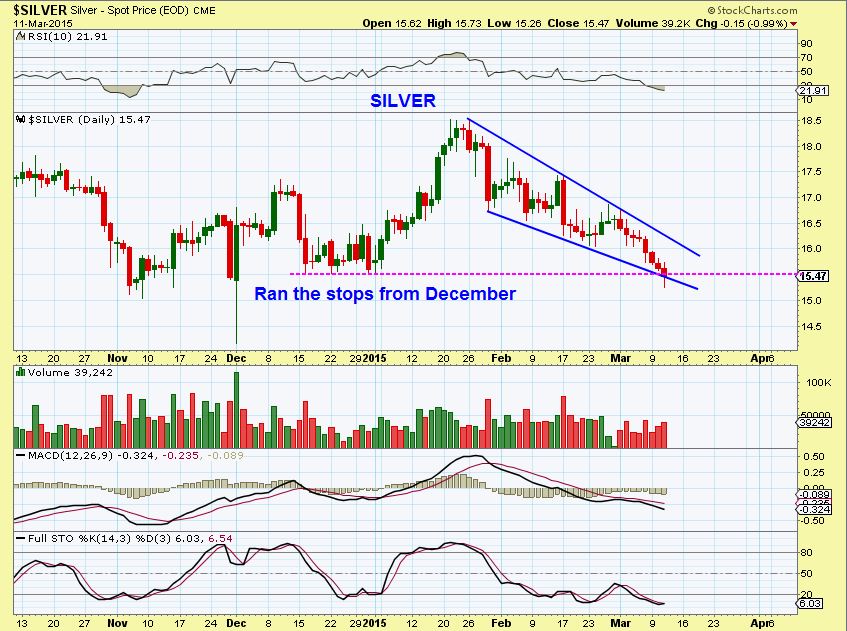
GOLD/SILVER and the MINERS were also due to bottom. It was a tough one to read. They also Popped with the FED WED release. I had posted this bullish set up March 11 in Silver , but again will it pop, run , and last? Or roll over?
$Silver – Ran the stops and this was the low.
I’m watching a variety of sectors and seeing what looks to be an interesting development taking place right now. Stay tuned for more information as these developments unfold. Thank you for reading along, I hope this article gives you a few new ideas to think about, and best wishes in all of your future trades!
~ALEX
If you were watching the markets yesterday, then you may have seen something quite interesting from about 2 P.M. onward as the FED information was released. It looked like this at a casual glance....
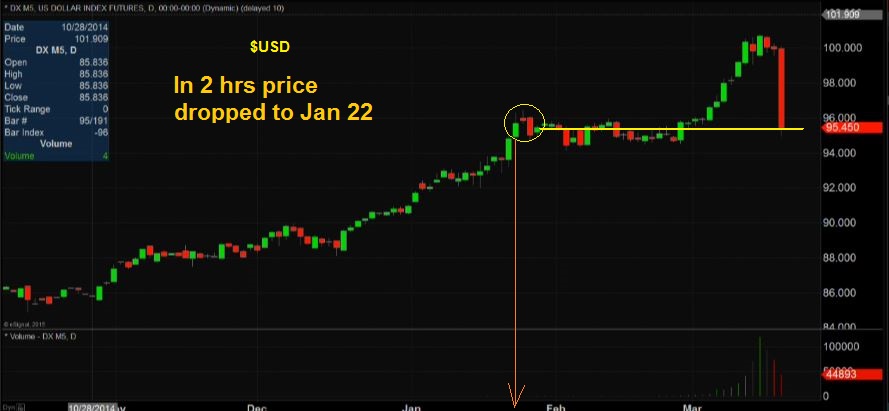
The $USD completely wiped out any gains from Jan 22 onward in very short order. Oh these fickle markets ...
Read More
Scroll to top