Archive for month: March, 2015
Sometimes people can look at the same thing and see something different than someone else. That is understandable , since we all have different experience in life and different ways of looking at things. When looking at charts , experience and training your eyes to look for certain things can be helpful in seeing what others may not. So is the above picture just a random pile of dots? Or is it a runner in action? The answer may depend on your focus or how closely you look at it. Lets look at some charts...
.
SPX- the markets have been resisting the pullback. I posted this yesterday
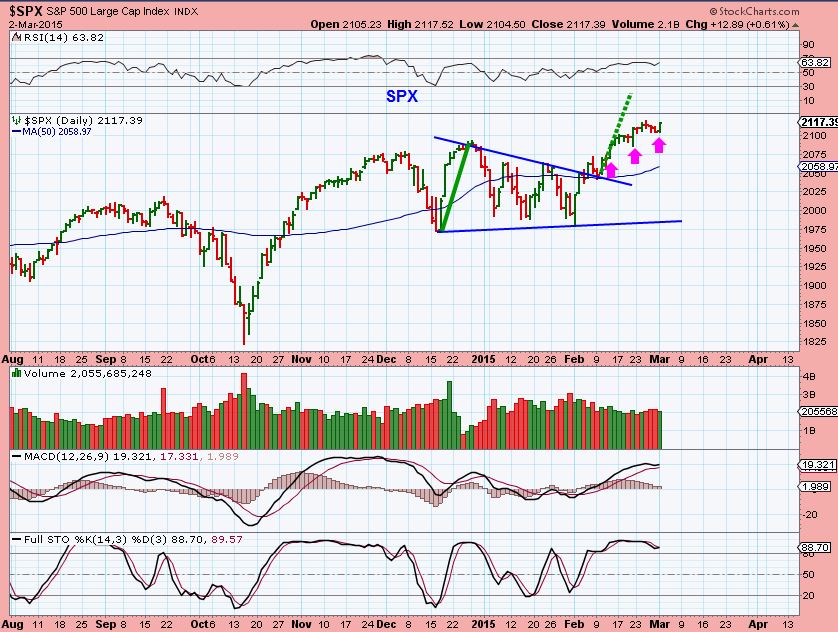
Is there anything noteworthy in todays chart of the SPX?...
Read MoreNot a lot has changed from the weekend report, so lets review the charts.
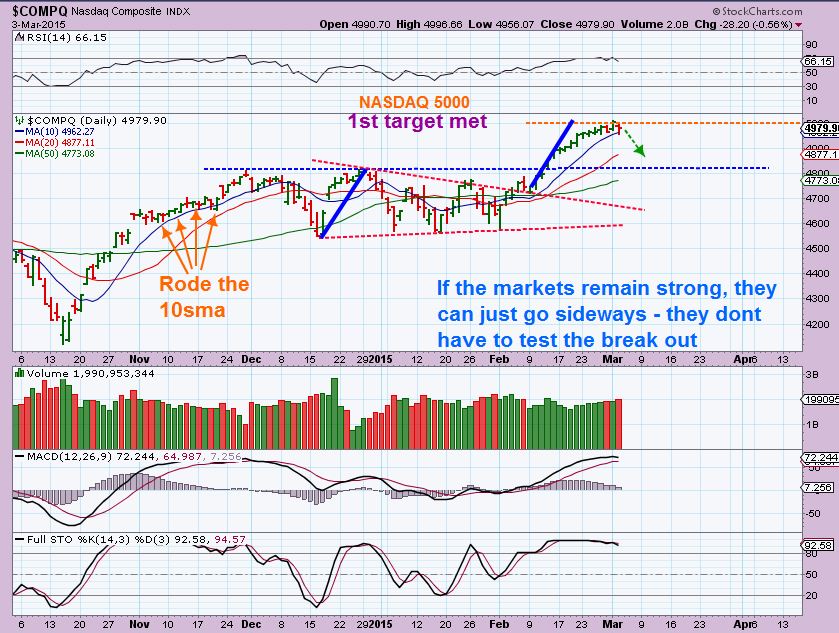
Nasdaq March 2
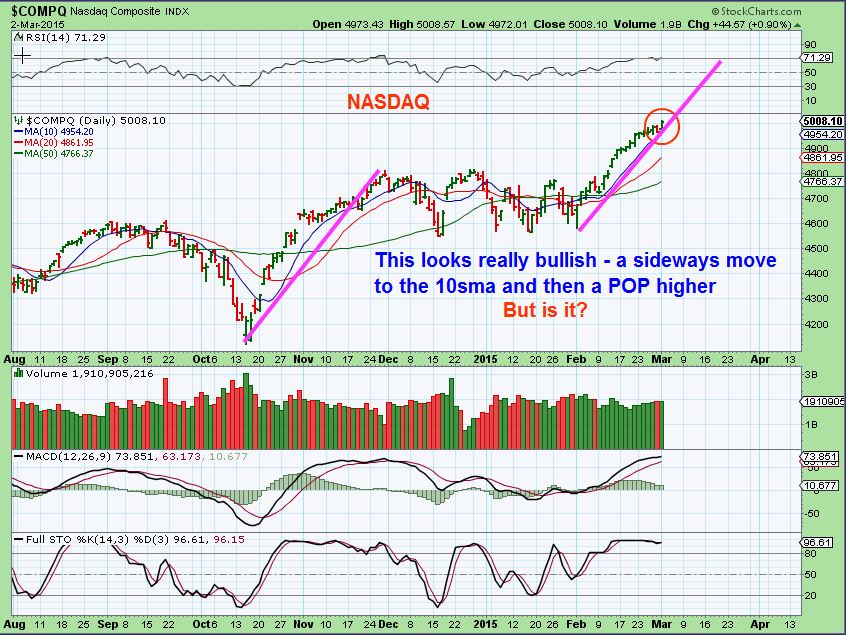
Certainly has had the bullish follow thru that I expected, right to 5000. Is it going to continue though?...
Read MoreIf you've been reading my posts here for a while, then you know that we caught some large Moves in Miners Dec through Jan rising out of their bases. When that move topped out, we switched to Energy from the end of Jan through Feb. While OIL sold off relentlessly, many of the energy stocks were forming sweet looking bases ( please see prior reports if you are new here. ). With both of those sectors, I have also kept an eye on the SPX, NASDAQ, NATGAS, etc. So what has caught my attention lately?
On Feb 24 - I called a likely temporary bottom in Gold using the charts below.
GOLD is in a squeeze with spikes along the bottom. This is a bullish set up
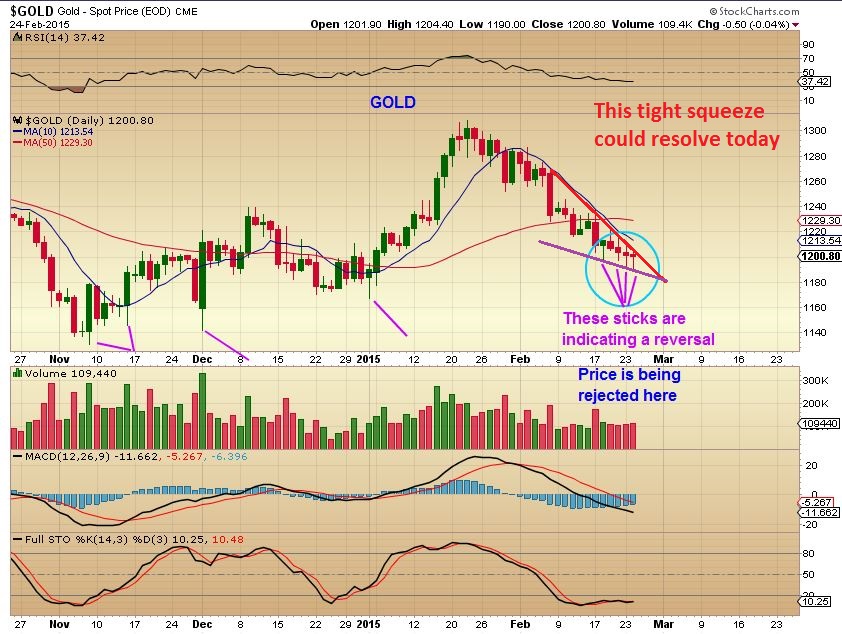
This next chart showed that GOLD was on a supporting trend line...
Read MoreSince I have 32 charts in this wkend report, lets just get right to the weekend wrap up and discuss future possibilities, shall we?
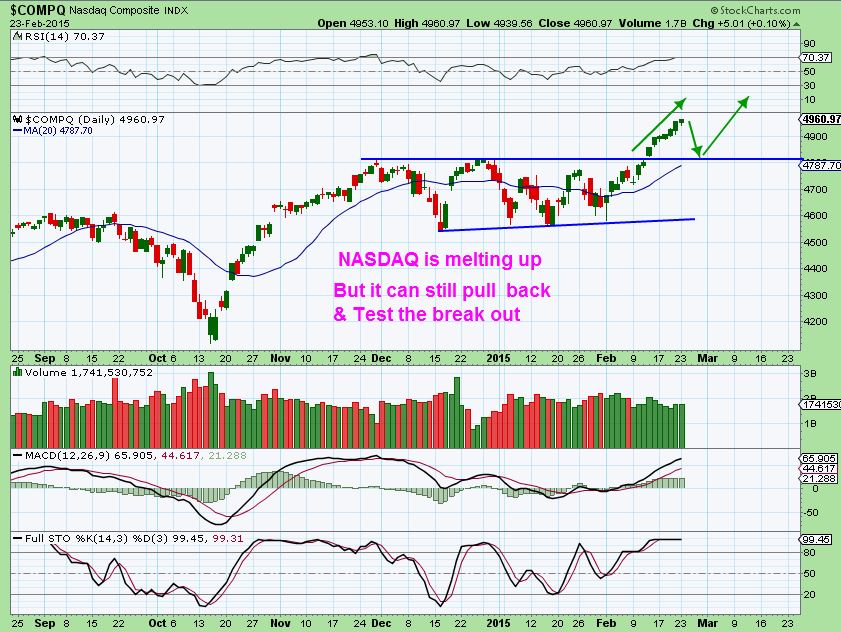
Feb 25 - I felt that the NASDAQ is close to a 'rest' here or near 5000, and then pull back.
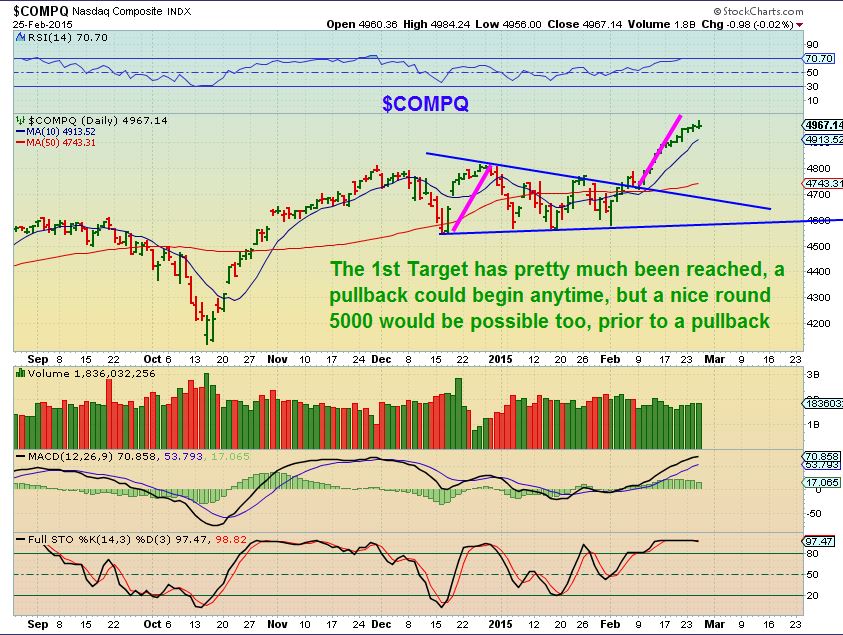
Does that mean it's done and going to fall apart, or just a small pullback, maybe even sideways move ?...
Read More
Scroll to top