Our positions in the Miners are pulling back, but it is a slow pull back so far. This pullback was expected. We’ll discuss what to expect later in the report, but lets start with the pull back that came in the equity markets first.
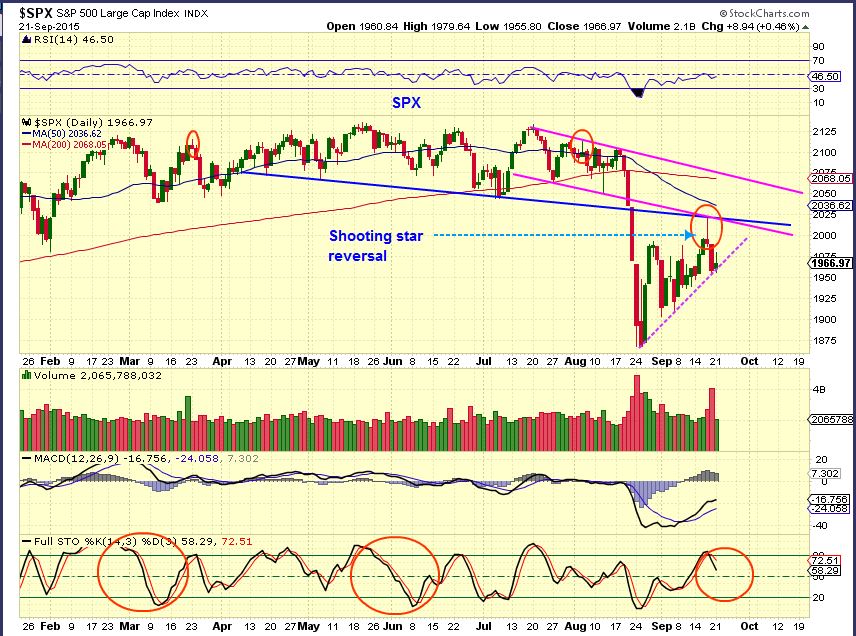
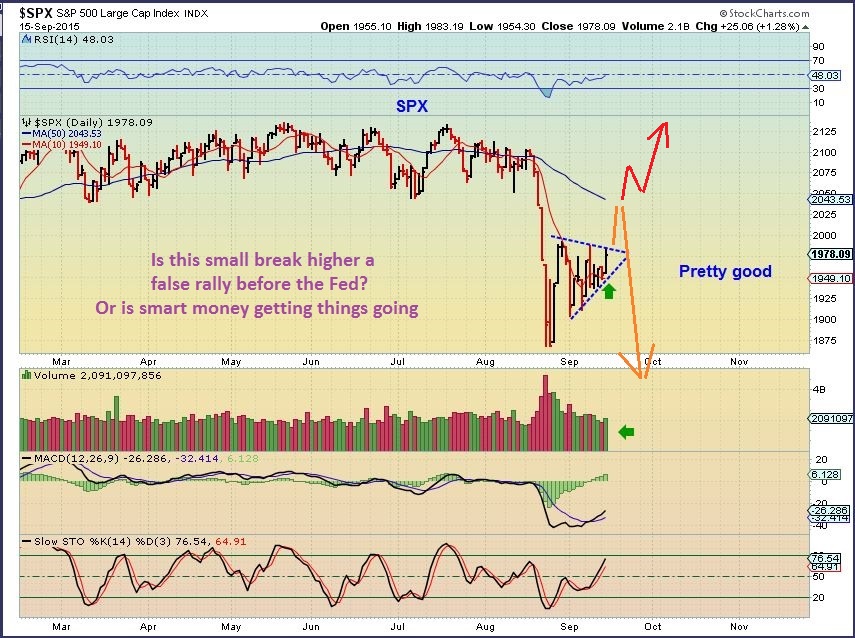
SPX – It started with a shooting star and the stochastics indicate that we could see more downside. In fact, I have mentioned that I expect a test of the ‘high volume candle lows’ sooner or later.
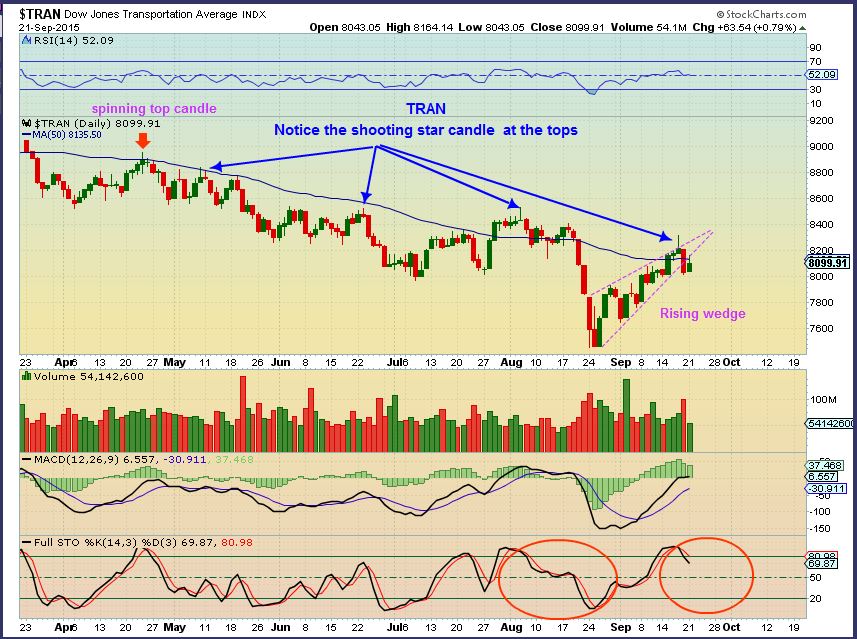
The TRANNIES looked pretty strong re-gaining that 50sma, but they’ve done that before and a rising wedge is bearish. Notice the shooting star candles at past tops?
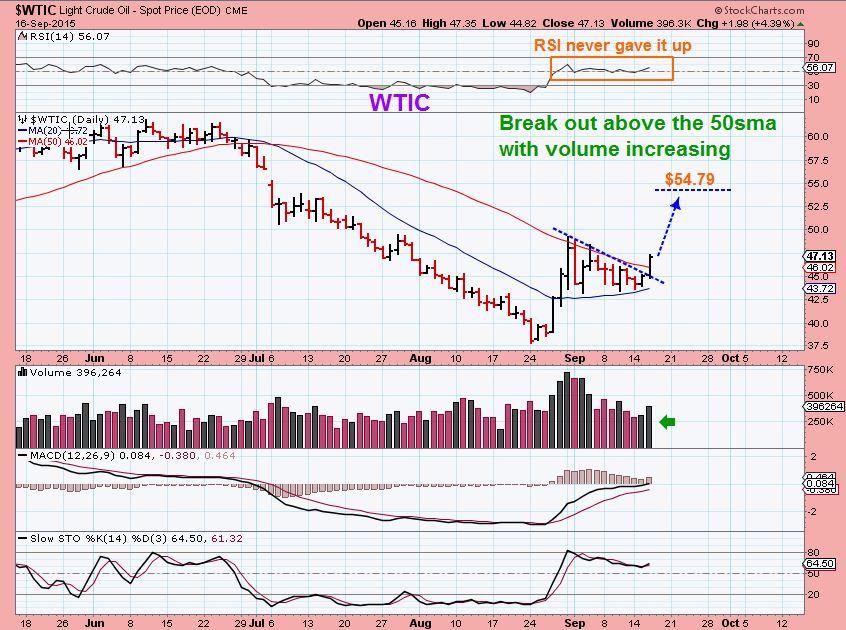
OIL is playing out as expected too…
Read more
Lately things are playing out as expected, but it’s always good to check this puppy out and see what is happening along the way.
I didn’t have a Friday report post Fed, because I had 2 reports on Thursday. Lets review charts and see how things played out.
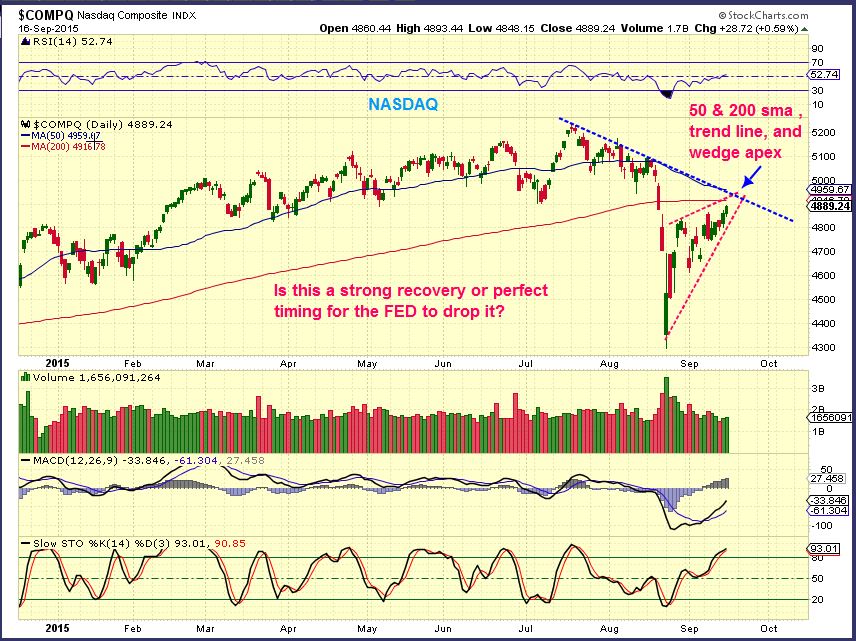
My NASDAQ chart from Sept 16 – Many were thinking that the markets were ready to rally to new highs after the Fed decision. I saw a rising wedge and a lot of resistance.
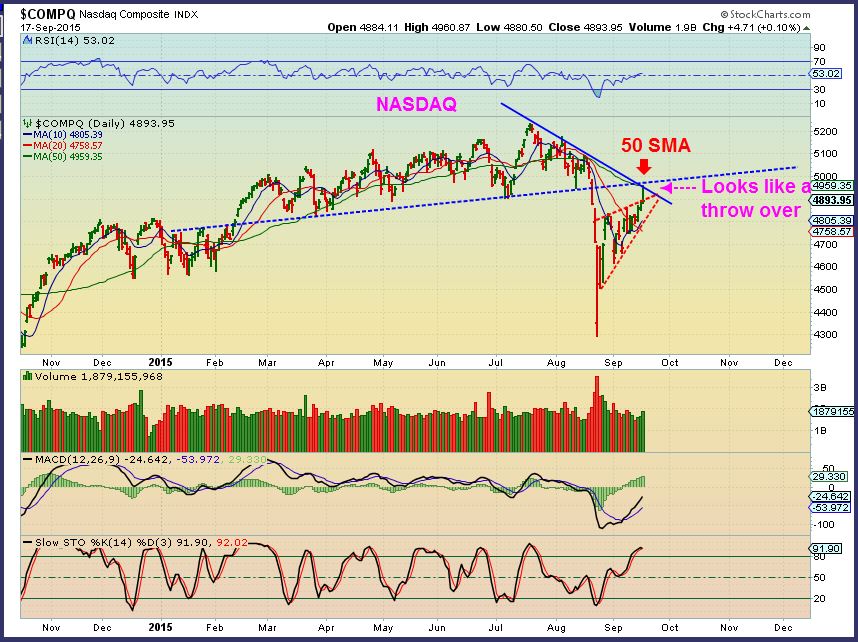
NASDAQ Sept 17 ( Fed day) Rejection at resistance. This was saying to short the markets.
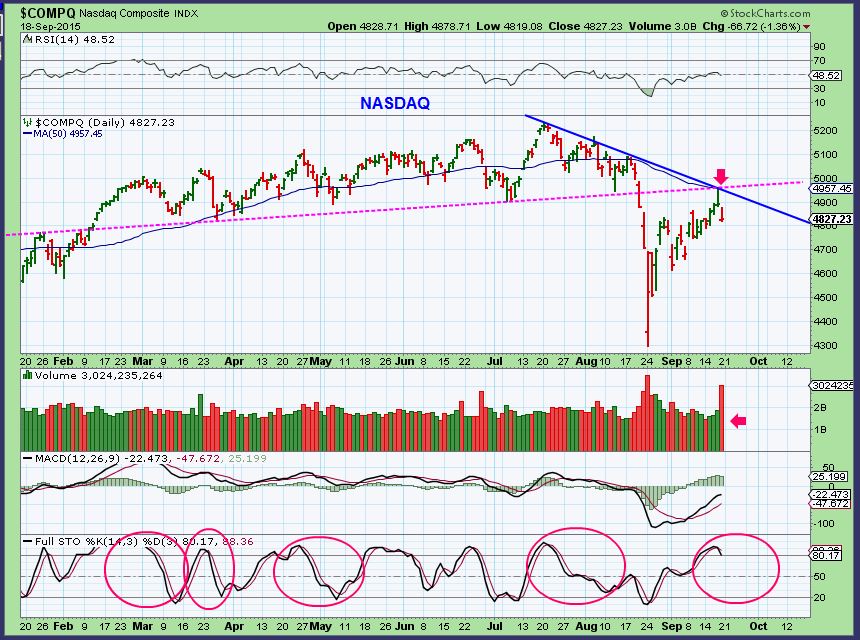
NASDAQ – Friday Sept 18 , The day after the Fed Decision. This is still within that wedge, but that was a high volume drop and there is a lot more room to drop stochastic-wise.
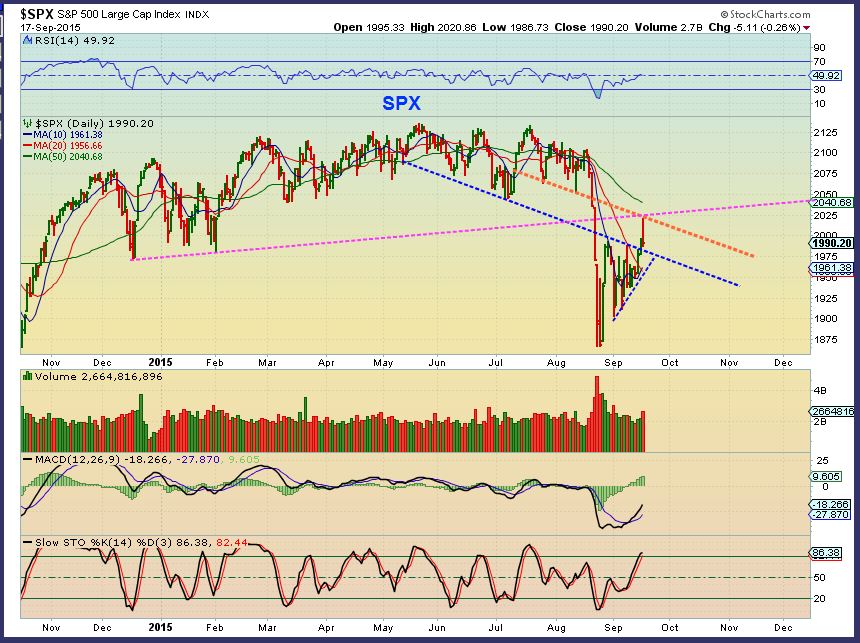
This was the SPX on Thursday Sept 17. Price was rejected
Read more
Earlier this week I certainly thought that the markets were waiting for the Fed Decision on Thursday before making any big moves. Yesterday, Oil, Energy, and Precious Metals jumped the gun and were off and running!
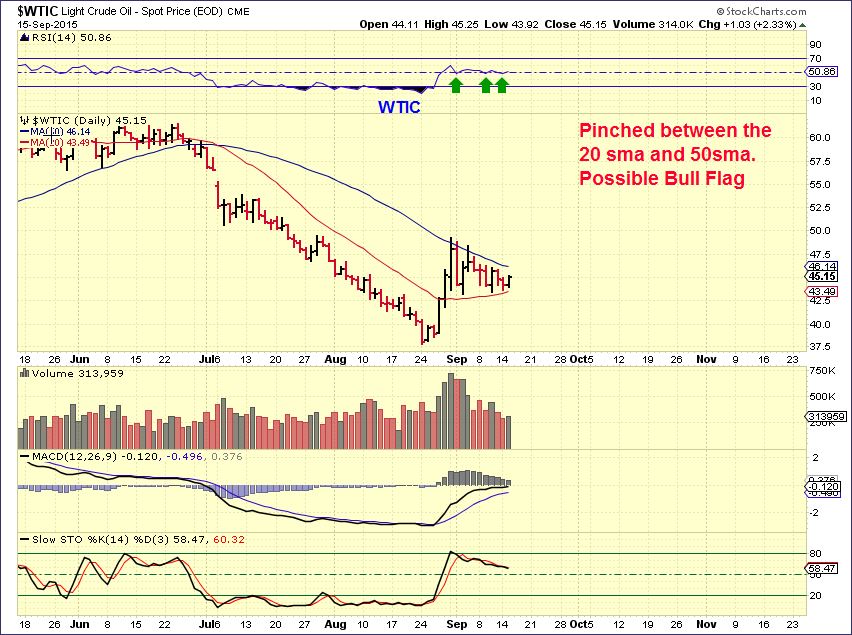
WTIC – The set up was a Bull Flag pinched between support & resistance.
Oil is not waiting for the Fed Mtg. Many energy stocks were up over 10% and some were 15-25% today alone.
I mentioned in a premium weekly report when the markets first crashed that in the past, bear markets dropped and rallied and dropped and rallied. A back test would be likely, as shown. Honestly – we are not quite at that level yet.
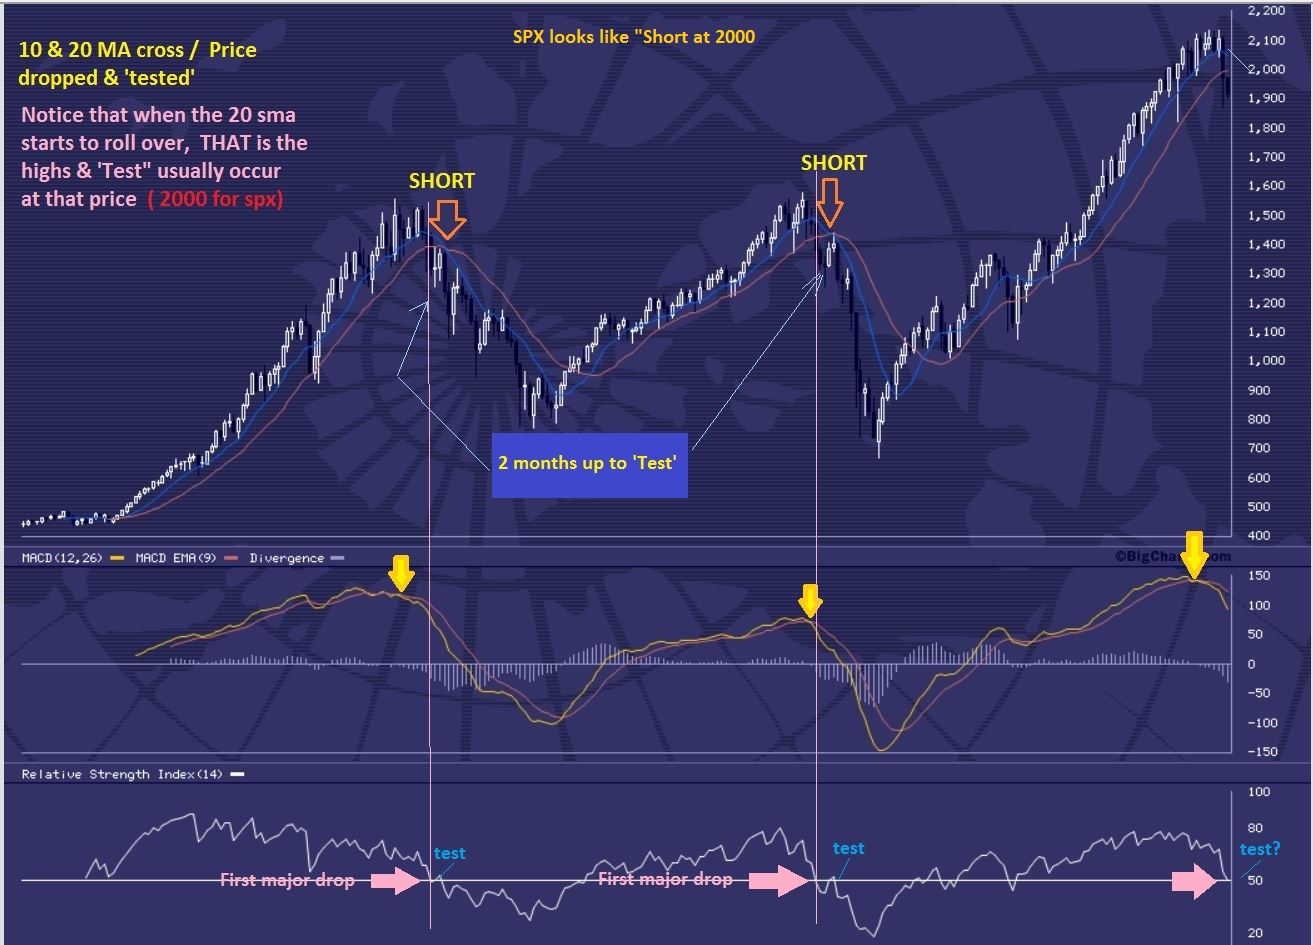
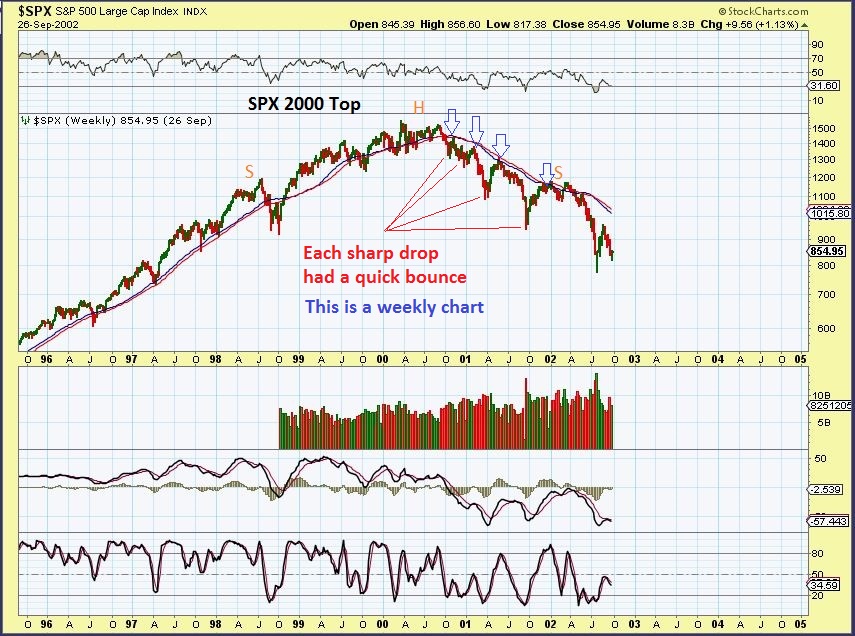
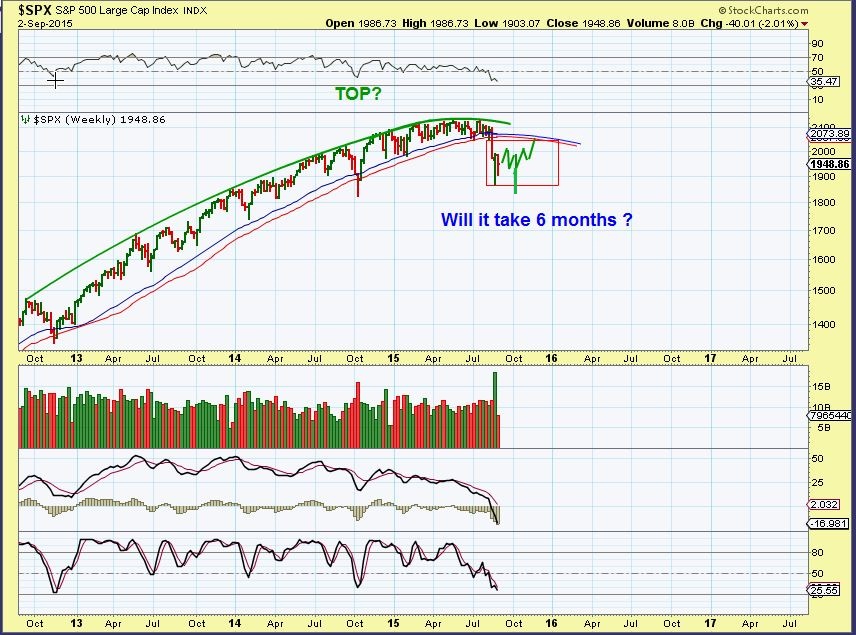
I want to point out a weekly chart of the 2000 Top. There were drops and rallies drops and rallies. We have dropped and rallied in the past 2 months too.
Could we be ready for a Fed induced drop? On a Monthly chart the ‘back test’ is not in place yet, but we can drop here & rally again later.
NASDAQ – I just wanted to point out this rally. It looks like a bearish rising wedge at this point, with overhead resistance in various forms.
GOLD and MINERS
GOLD – The chart in yesterdays report pointed out the # needed to have a swing low in place. Above $1111.90 puts a swing in.
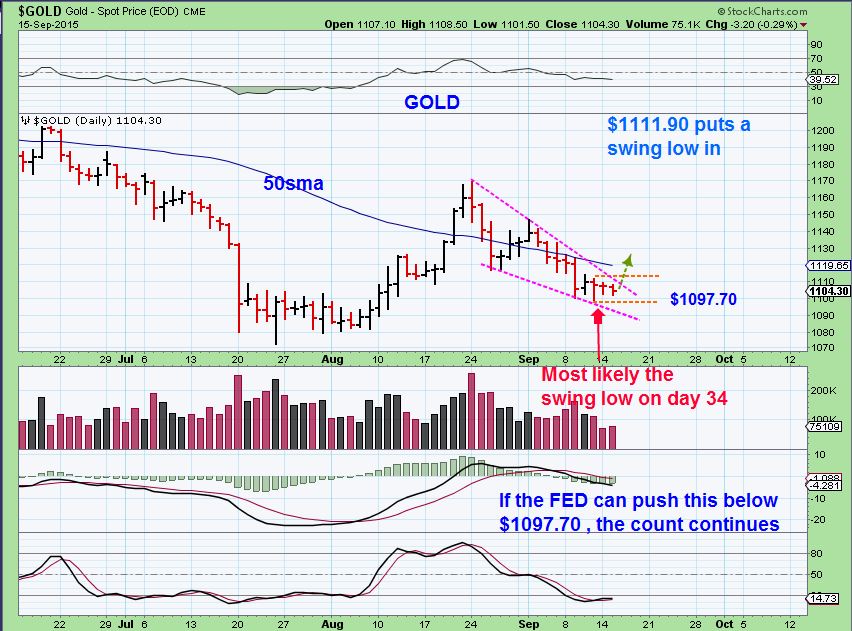
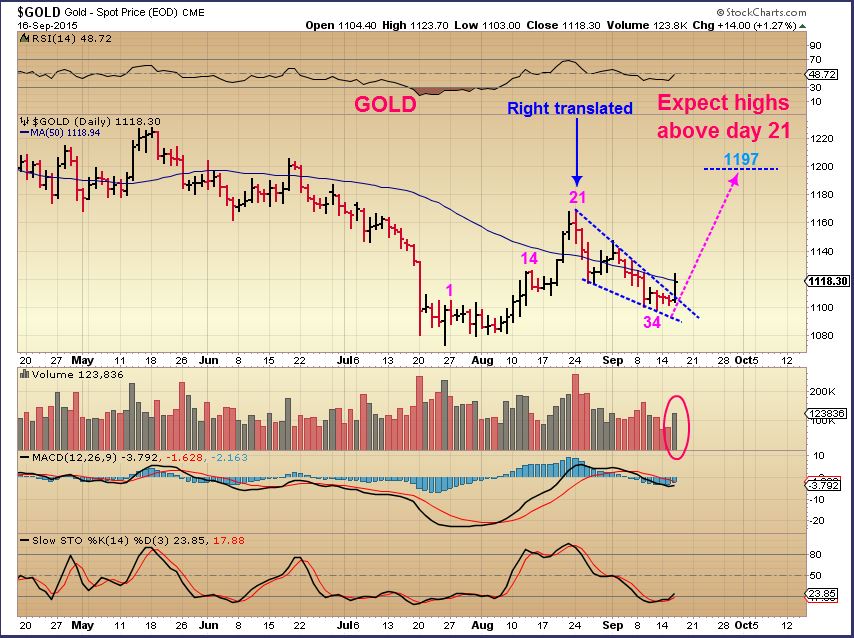
We certainly got that today. A swing low is in place on day 34. That was a right translated first daily cycle, so we can expect higher highs! We broke from a descending wedge and I consider this a buy. My initial target is near $1200 .
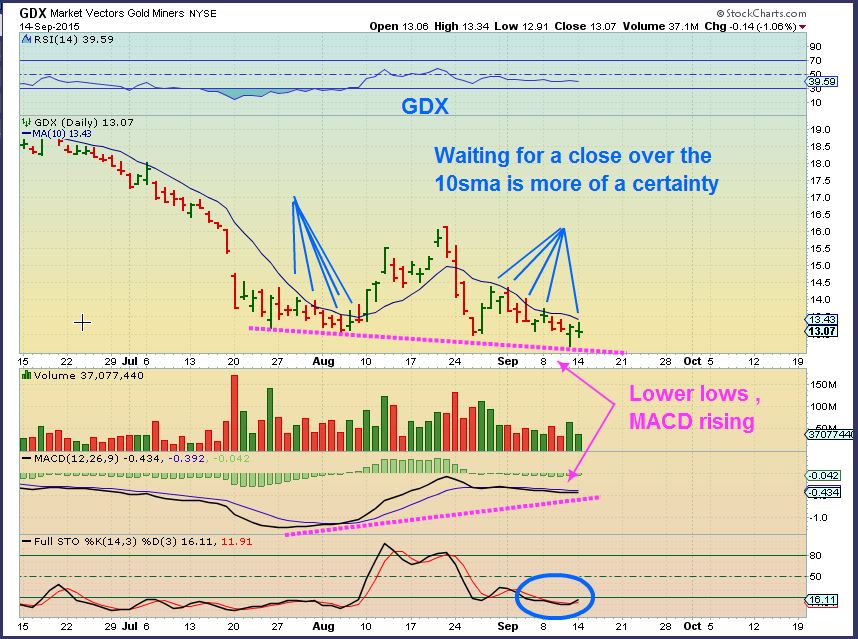
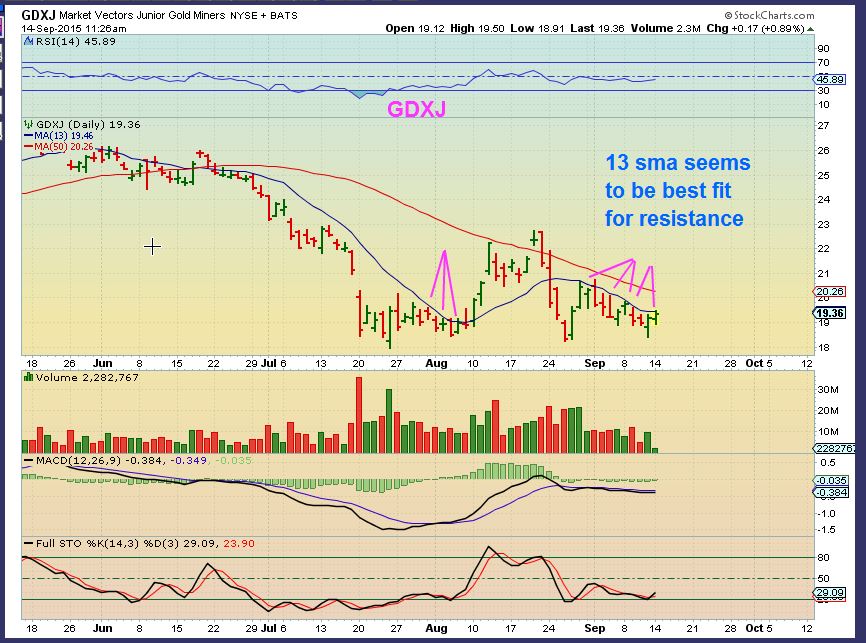
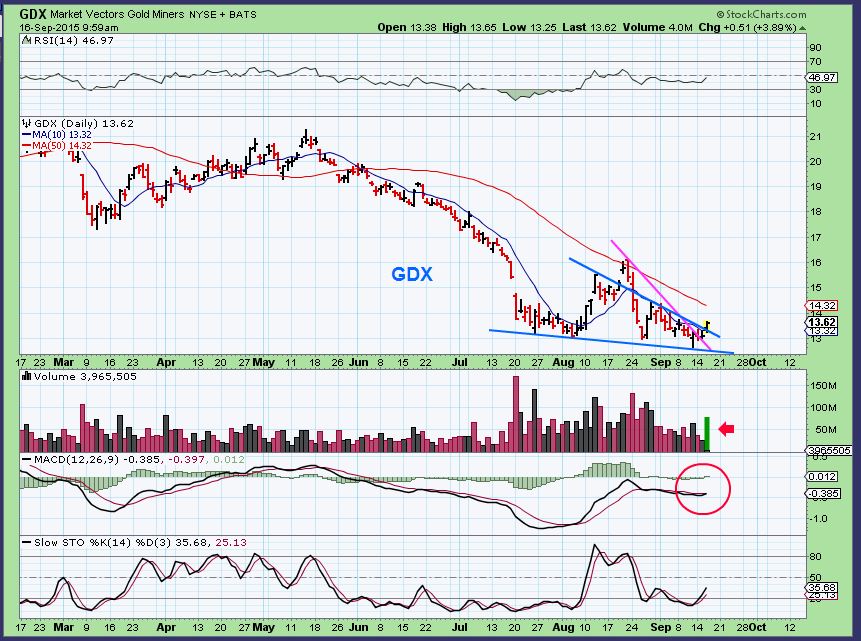
I have pointed out that a break above the 10sma ( and a close there) is a safer area to take a position in GDX. With GDXJ I used the 13sma.
I had expected Miners to wait until after the Fed decision too, but timing was late in the daily cycle and everything just popped all at once. I posted at 10a.m. that volume was likely going to be above 70 million ( by the close) as we broke from the wedge.
GDX – This was my 10 a.m. (yesterday in premium section) chart pointing out the volume to look for if the move was real.
While you wait you can look at DNN (uranium) . That’s a good looking stock set up. See also GTE and UPL – those looks like a buy right now ( Energy). XCO was up 30% (AGAIN!). To see the potential in some of these juniors, check out a 3 month chart of AXU, EGI, & GSS .
Good luck today
NOTE: It’s just $37 for over 20 reports and some 100 setup’s each and every month! If you’re serious about learning and trading, then come try it out. See: http://www.chartfreak.com/my-secrets/
~ALEX
As mentioned in last nights report, we saw an explosive move in Commodities yesterday one day before the Fed Decision. That caught a lot of people who were not in front of their screens flatfooted. Last nights report also pointed out that it looks as though what we have been expecting to occur during the Fed Speech is beginning to play out. Lets go shopping and see if we can find some low risk entries developing in OIL and Precious Metals.
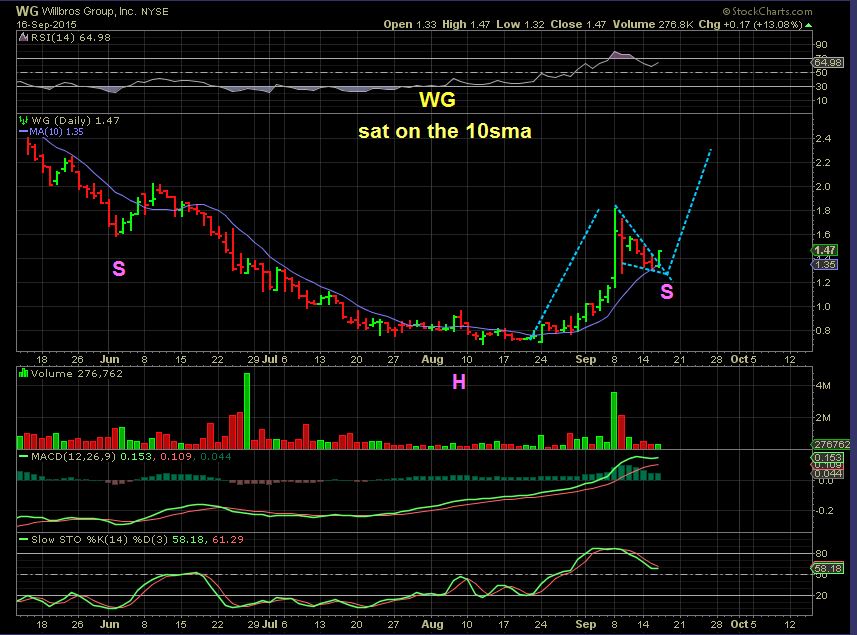
Lets re-visit WG. Rather low priced, I recommended this beaten down Energy stock here at $0.80 and $1.00 in early Sept.
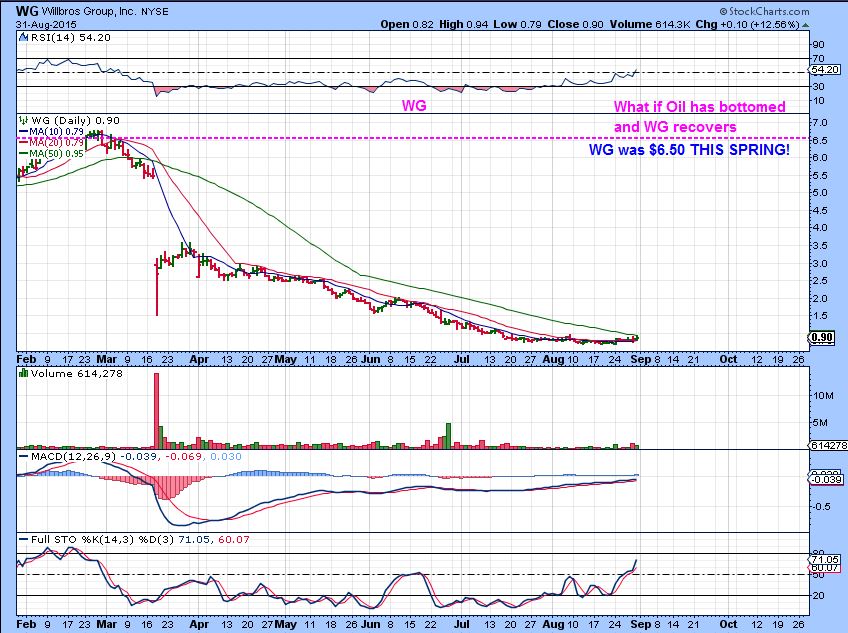
It Popped and ran to $1.80 rapidly and now has formed a bull flag type pattern, landing on the 10sma. You could buy this with a stop under the 10sma as a low risk entry.
Lets keep shopping…
Read more
Earlier this week I certainly thought that the markets were waiting for the Fed Decision on Thursday before making any big moves. Today Oil, Energy, and Precious Metals jumped the gun and were off and running! We’ll discuss more than just those areas, but first lets revisit what we were watching for.
WTIC – The set up was a Bull Flag pinched between support & resistance. Normally I would buy this with a stop below support, but I cautioned that the Fed Mtg Thursday may cause whip saw.
Oil is not waiting for the Fed Mtg. Many energy stocks were up over 10% and some were 15-25% today alone.
I will post some charts of energy stocks set up nicely at the end of the report.
Read more
Mondays trading was a little like watching paint dry in the markets and Tuesdays wasn’t a whole lot better. You can bet that things will pick up at all when the Feds decision on interest rates is finally handed down on Thursday,and it’s almost here. Lets look at what we have so far.
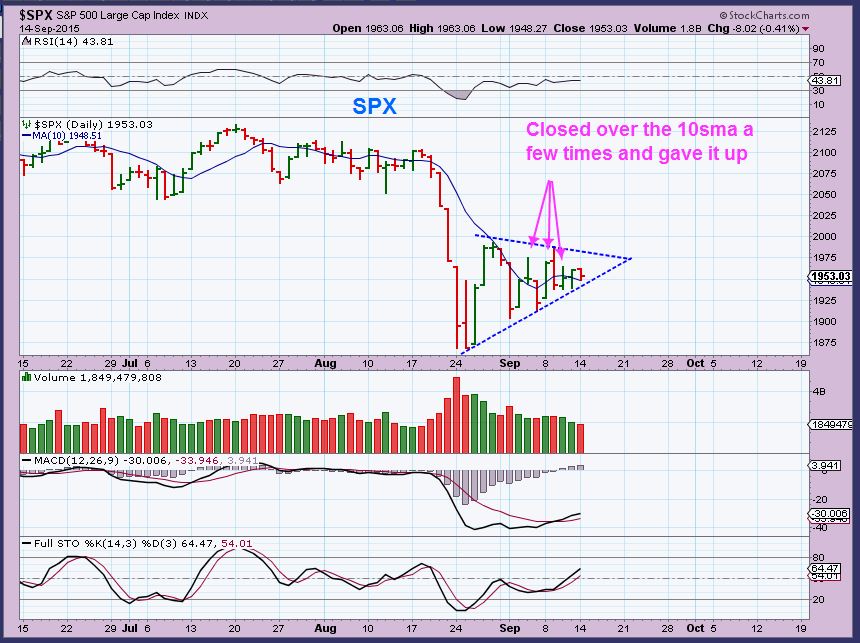
SPX – Tuesdays move gives it the look that it wants to break higher. If it does it may just back test of the break down.
Read more
I’m sorry if you came here hoping to hear an opinion on the FED EX company. I am actually here to point out that I am expecting some strong movements later this week as a result of the FED EXPECTATIONS. Some are expecting an interest rate hike and others are expecting no change. So far we are seeing a sideways move in most markets leading up to that big day this Thursday. I wanted to share some charts that were in my recent weekend report. They may help us to anticipate the reaction after Thursday. Lets look at charts.
.
SEPT 2 – I pointed out the topping action in the markets last Spring & early Summer. After the initial drop, it should likely lead us to expect volatility, possibly even sideways for a long period of time. We have that now.
I want to point out what I am looking for next…
Read more
WTIC– Another slow motion sideways move, but this looks like a Bull Flag that wants to break higher. Will it before the FED Decision? Maybe.
Read more
After watching the markets yesterday, I get the feeling that this week may be a sideways slow motion move that goes nowhere fast…until after the Fed Mtg. Lets review some charts.
.
SPX – You can see the same sideways move that has been playing out for weeks.
Read more
In an earlier report I asked, “Are we still on track?” It would take time to know for sure, but things are still playing out well in some areas, yet a little trickier in others. Lets look at charts.
SEPT 2 – I pointed out this topping action and said to expect volatility, possibly even sideways for a long period of time.
I want to point out what I am looking for next…
Read more
Scroll to top