As mentioned in the weekend report, Gold & Silver have been selling off at a very rapid rate, and I think that they should be due for at least a bounce. I want to take a look at that idea in this report, but first a review of the markets.
The markets don’t look bearish, but this possible rising wedge formed by Nov 4.
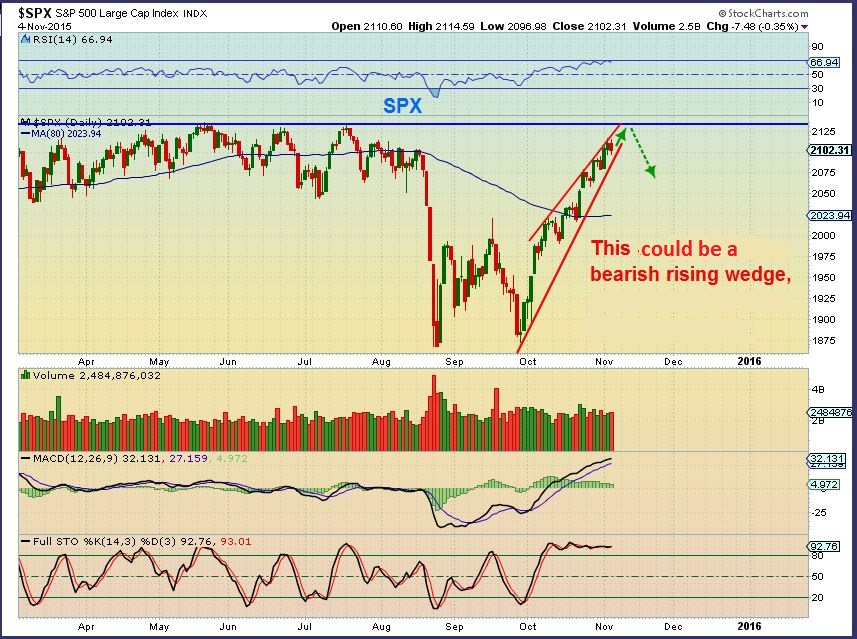
SPX currently- This does not have to drop too far, it could even go sideways.
Read more
From the time of the Fed Meeting to the Jobs report Friday, we have had a lot of action in the markets. Action in the markets is what draws our charts, and we have an interesting mixture of charts to examine this weekend, so lets get to the 36 charts that I have prepared 🙂
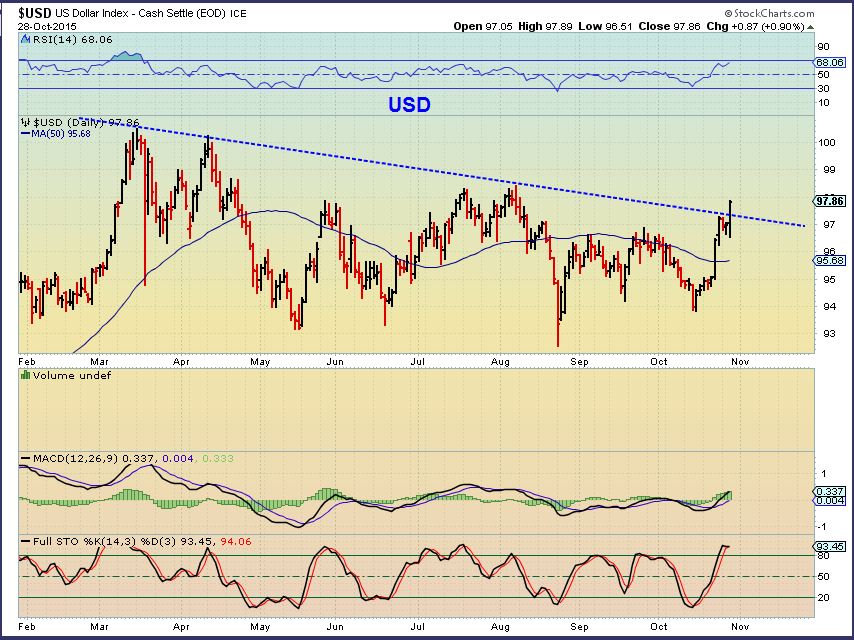
Lets start with the $USD WKLY. Nov 4 this looked too legit to quit, but we had to wait for Friday to see if out Dollar break out was real.
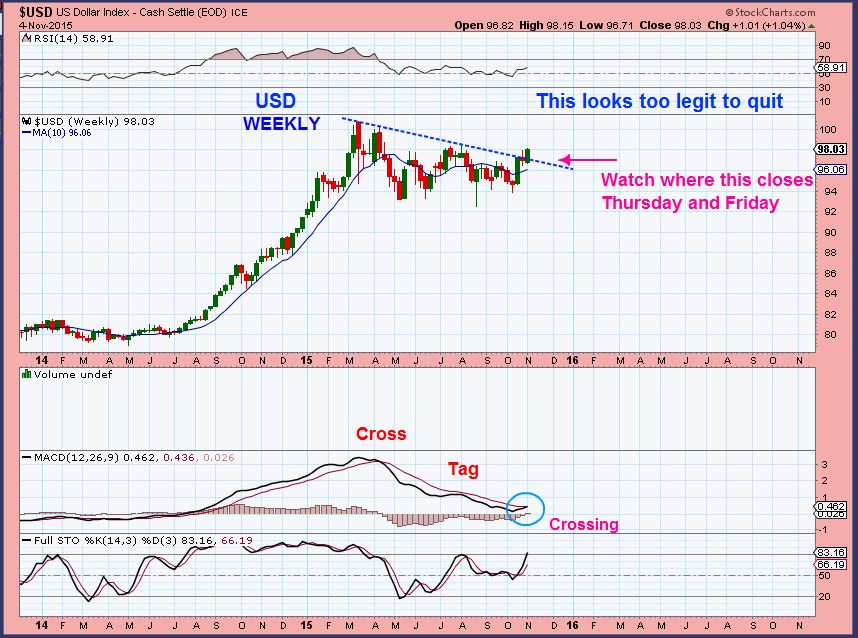
$USD – legitimate break out. This could have major implications.
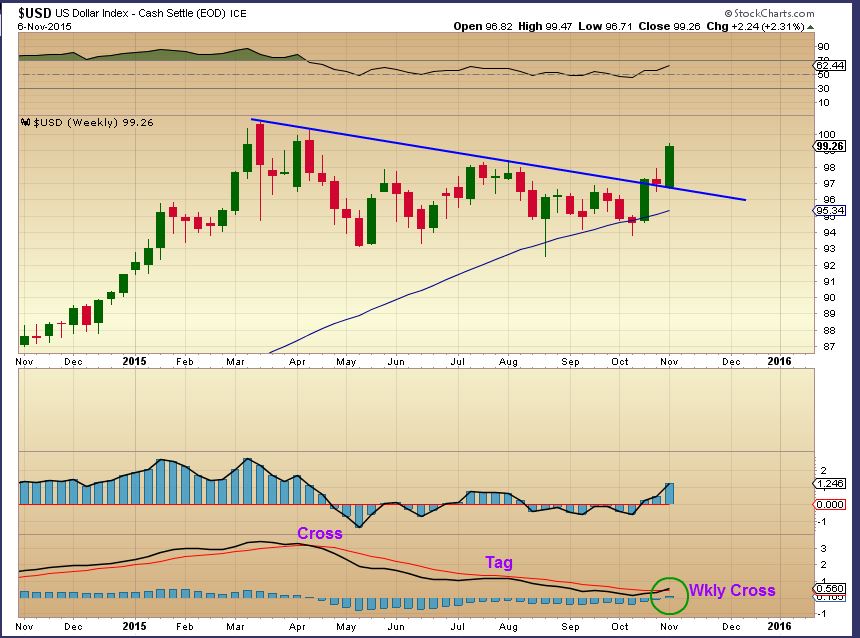
Lets look at the Dollar on a daily basis…
Read more
Jobs Report, Flying Dollar, Diving Gold. Please dont forget Energy 🙂
Read more
Count the Green days vs the Red days in Gold for the past 2 weeks, and you could say that it has been in free fall for a bit. We’ll discuss that after a market review.
The SPX has been moving rapidly higher and recovering from the August – September sell off quickly. Since the former highs could offer resistance, we may see a drop with the jobs report .
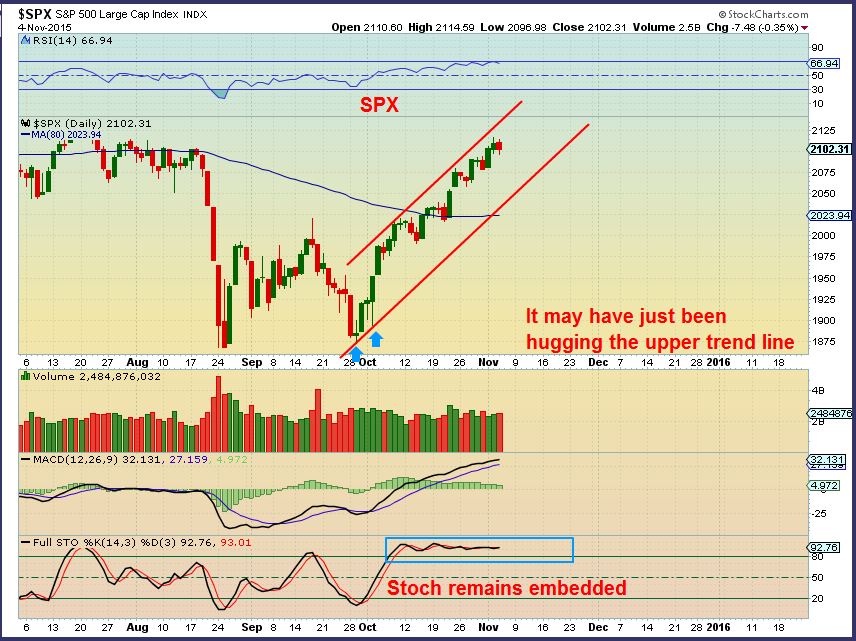
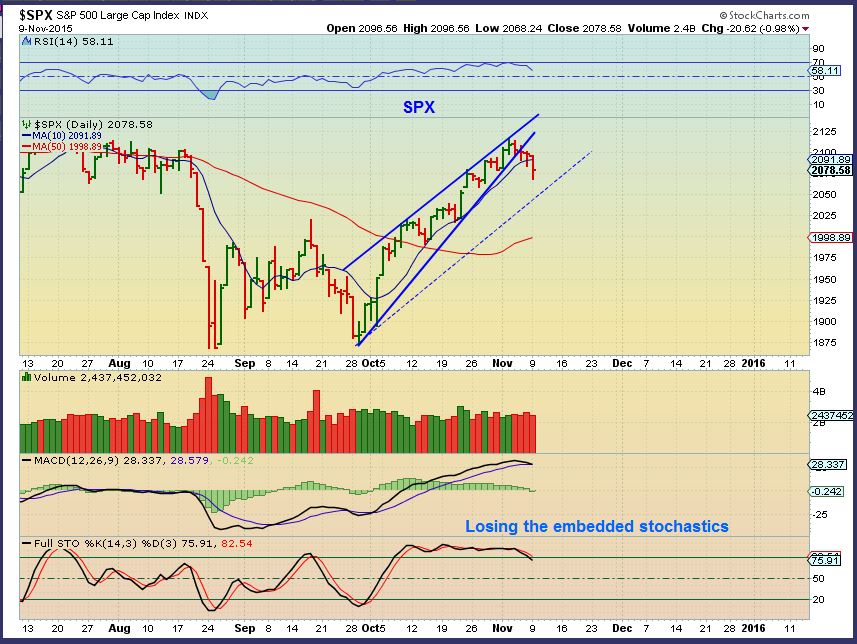
Now I want to show you a chart of the SPX that really looks like a drop could come soon.
Read more
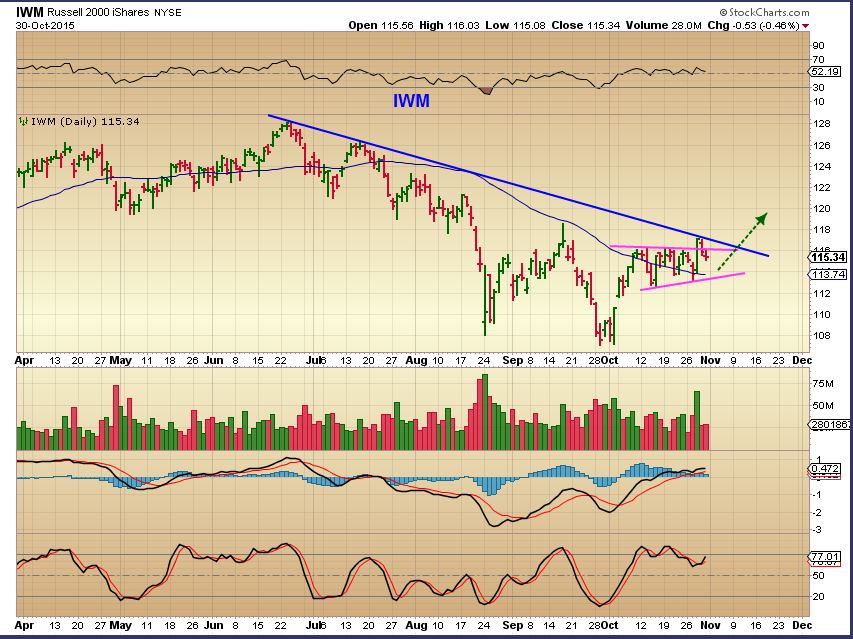
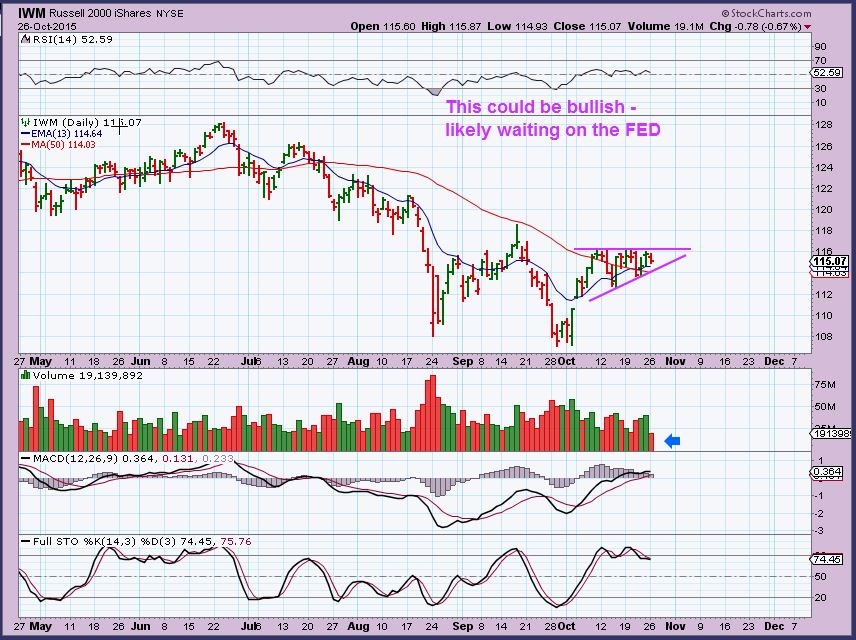
I want to discus a few things in todays report, and then I will have a small ton of charts & Set ups in Energy and Commodities. I will start with the markets and their nice run higher lately. I did mention that the IWM, TRAN, and the IBB looked to be lagging a bit. IWM had a bullish set up and popped higher, but it hit another short term resistance area. I wanted to see a pop higher if it is going to possibly play catch up.
This was the IWM at that point on Oct 30. I expected a break higher.
IWM Nov 3 – We got he break higher ( Note: We may back test that break soon).
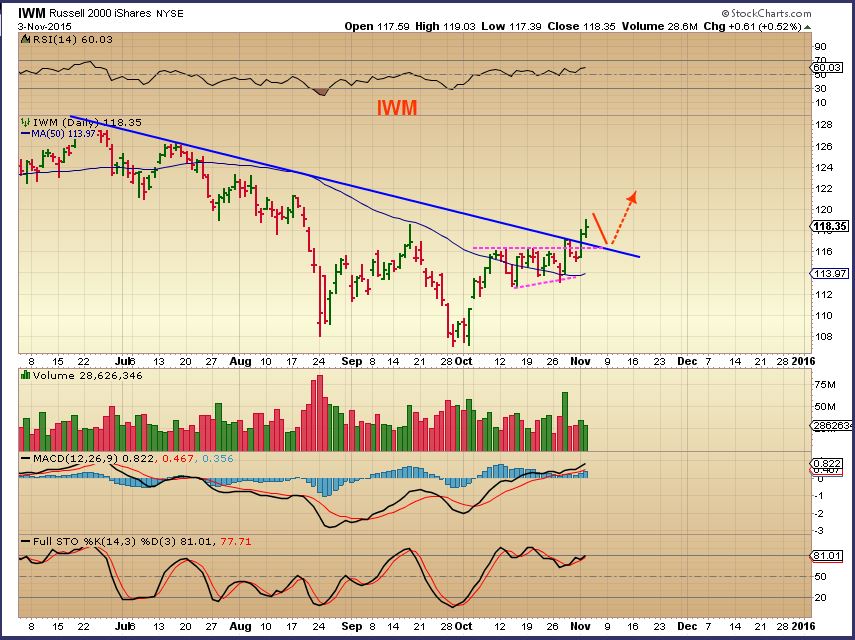
Lets look at the NASDAQ before we discuss Energy, The CRB, & The Precious Metals…
Read more
We had some nice reversals in certain sectors today, so I wanted to share a few ideas here with that in mind. Some ideas are Bullish , and a few cautionary notes in there too. This is your Tuesday morning report a tad early. 🙂
Read more
It was a Fed Week and the Action (or lack thereof ) and reaction were somewhat expected. Lets look at our week in review.
Thursday I mentioned that I found it surprising that the USD & CRB were both moving together Post Fed. Was one faking it’s move?
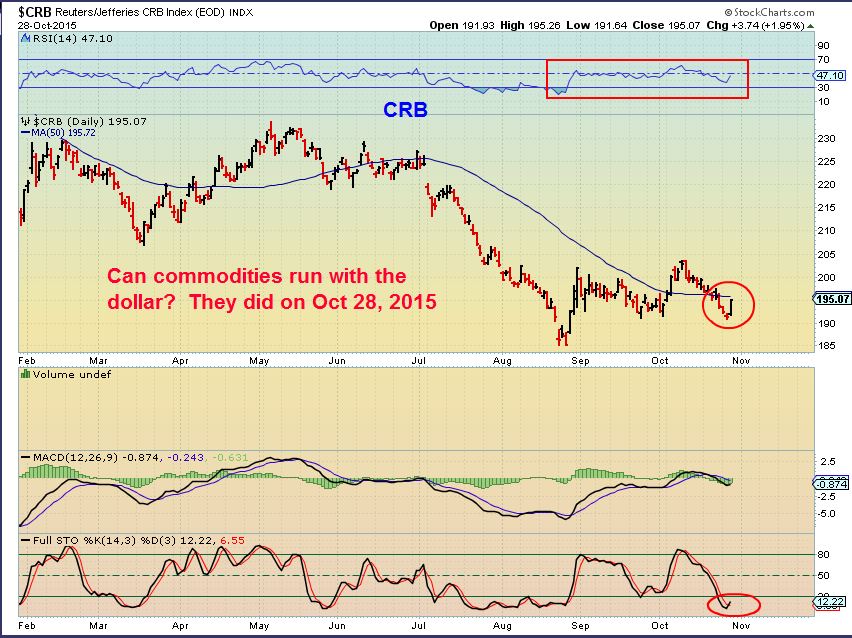
Now lets take a closer look…
Read more
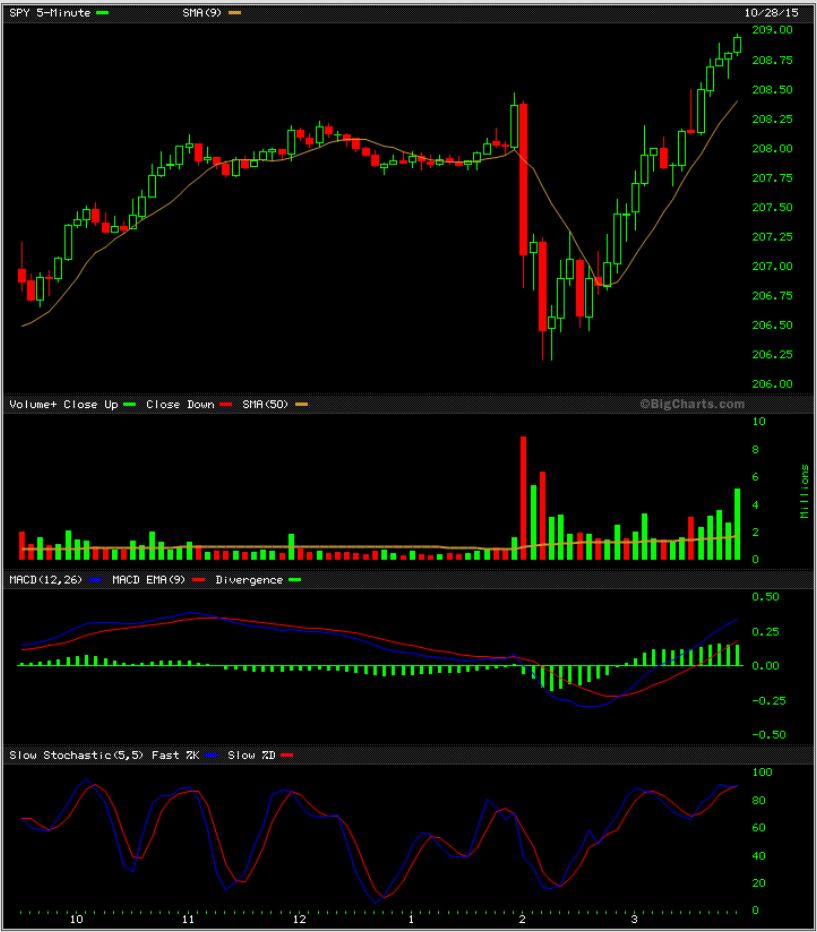
As expected, the Fed Mtg on Wednesday certainly gave us some dips to work with. We saw both strength and weakness as a result.
SPY – This was a tough dip to ride ‘real time’, but the markets closed back at the highs.
Read more
What can I say here when we all know that charts could be quite different after the Fed Mtg on Wednesday? Lets just review some expectations.
.
The SPX, Dow Jones and NASDAQ have recovered nicely from the summer sell off, but a few areas have yet to catch up (If they are going to). I showed this rather bullish looking set up yesterday, but…
Today the TRAN , IWM, and IWC sold off nearing the close. Is it a fake sell off or is smart money heading for the exits Pre-Fed? Lets take a look…
Read more
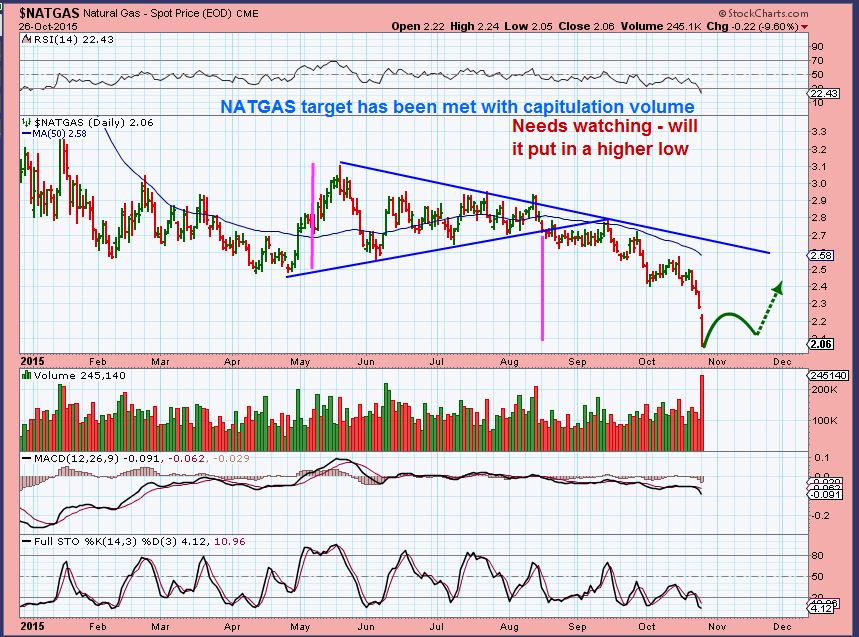
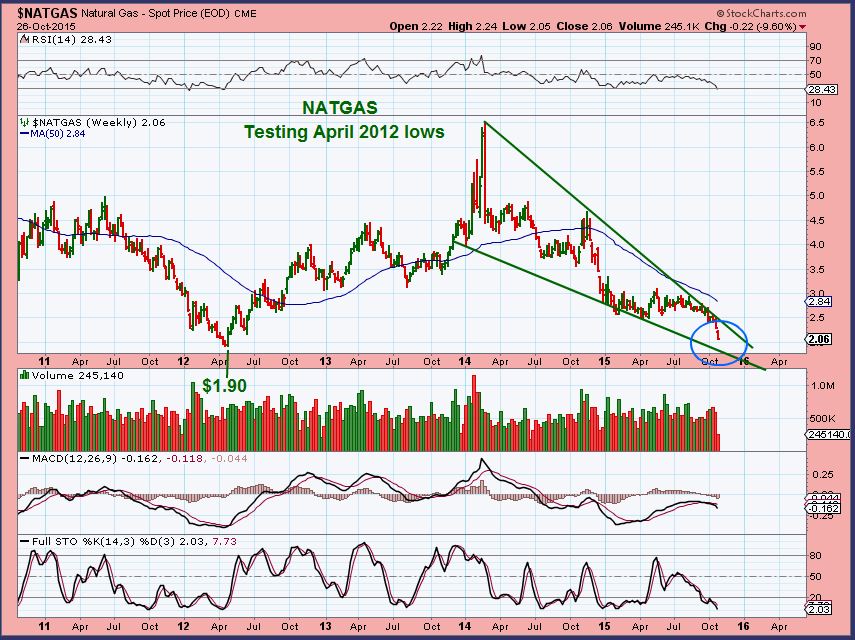
I’ve been hearing a lot of talk about the NATGAS plunge. It has dropped roughly from $3.00 to $2.00 since May! It’s bouncing today , so I wanted to take a look at a couple of charts and point out to members in the premium report this morning what we have before us technically. I will share 3 of those charts here.
.
Starting with a close up. ( Note: This volume was erroneous and later adjusted at stockcharts).
NATGAS has basically finished a measured move. It also broke well below the Bollinger Band, so a bounce was to be expected. A buy for a trade maybe, but will the bounce put in a higher low or could it roll over like prior bounces? It would be good to know.
So stepping back, I see that a bounce to the wedge and another drop wouldn’t be out of the question. If I was trading this bounce, I would keep this chart in mind. Prior lows in 2012 were at $1.90. and the lower wedge trend line is around that area. Lets zoom back one more time.
This chart shows that a prior Double Bottom Low in 2002 in the $1.88 area. That 2nd low on that double bottom was an undercut of $1.85, so we may see support in the $1.80’s and lower $1.90’s. $1.90’s since the 2012 lows were $1.90 shown in the chart above.
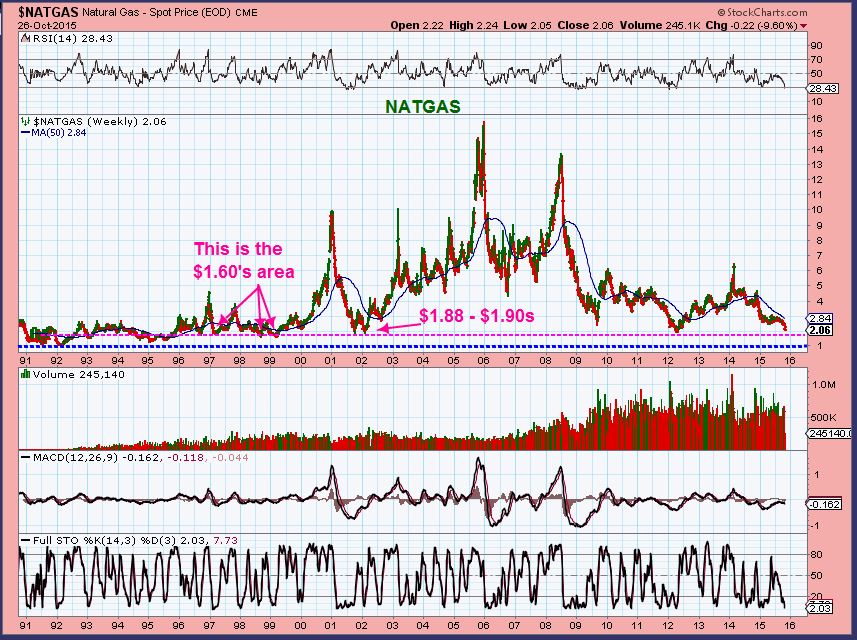
I am not trading NATGAS right now, but the bollinger band crash on Mondays daily chart was indicating that a bounce should follow shortly. Stepping back and looking at a couple of longer-term charts, we see that we either made higher lows here or there could be better support a little bit lower near $1.90. Double bottoms are common and sometimes they undercut recent lows with divergence.
I will be looking for that in the future and we may see another entry point if Natgas returns to its recent lows. If I was trading this bounce, and maybe you are, I would just keep the long term charts in mind and use a trailing stop or take profits with Fib Bounce #’s or whatever method you use to cash in on a trade. I would also keep in mind the crazy market activity that is often seen around FED WEDNESDAY and stay alert.
Happy trading 
~ALEX
Scroll to top