After any extreme sell off takes place and people finish discussing all the reasons why there can be no recovery, it's often a good time to go shopping. Why? When it gets overdone, the bargains can be great %-Wise. Recently while OIL & NATGAS sold off beyond expectations , I noticed that the equities stopped selling off and began building constructive bases. Temporary bottoms or permanent? Its too early to say for sure , but trade-able? Most certainly.
Here at Chartfreak, we have been buying & trading them for weeks now. I want to share some of the charts and ideas that we are again looking at , since I am expecting another leg higher.
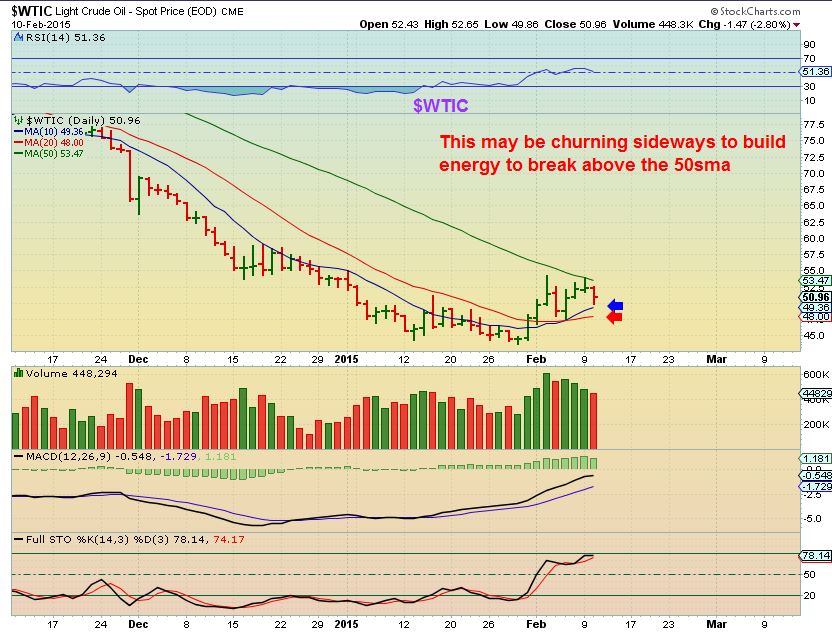
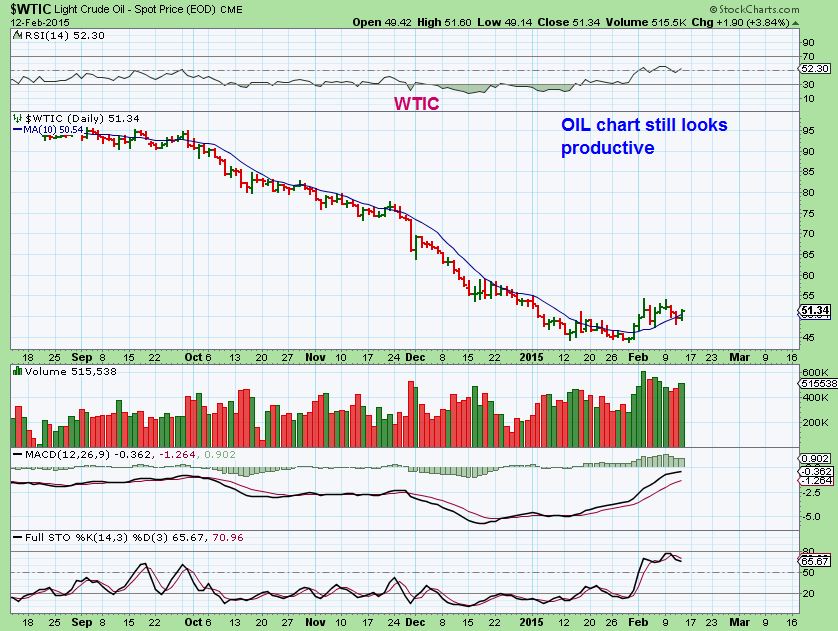
OIL Feb 10- Some said "Bear flag" We had been trading energy stocks , and I saw signs that OIL wanted to go higher.
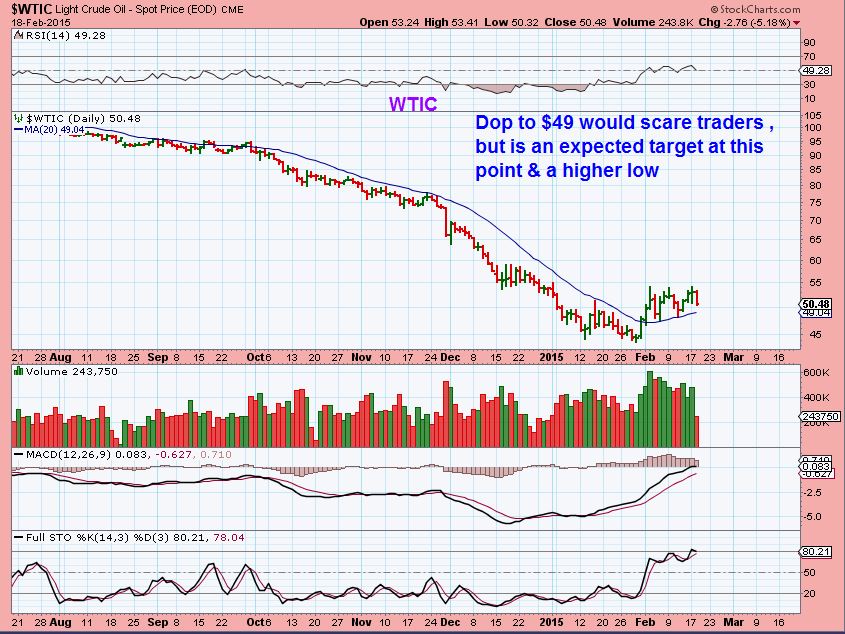
Feb 18 - consolidation/ base building. I posted this chart , I wanted a drop to $49 actually...
Read MoreI wasnt going to do a Friday report, I was just going to allow yesterdays report to speak for itself, but lets just do a quick review to be clear.
I posted this oil chart yesterday for a reason...
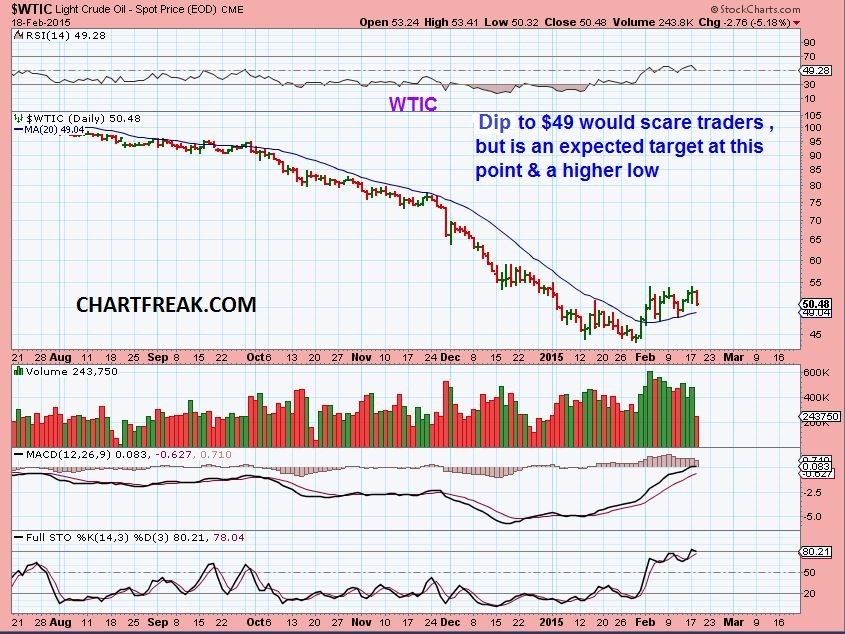
A drop to that area would be a low risk entry...
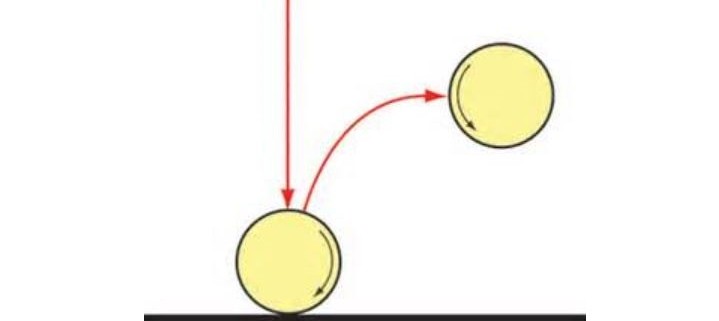
Read MoreWhen most traders were kids, it's probably safe to say that if they had one available, they loved playing on the swings. Today I think that it's safe to say that most traders still love to play on the swings. We'll discuss one such swing in a minute, but first I just want to show the chart of OIL as of yesterday. ( Excuse the typo) : )
WTIC
I know some people that are looking at this chart and saying that it has formed a bear flag...
Some people here have been waiting patiently to pounce...
Read MoreQuick buy update ....
Read MoreAfter any extreme sell off takes place and people finish discussing all the reasons why there can be no recovery, it's often a good time to go shopping. Why? When it gets overdone, the bargains can be great %-Wise. Recently while OIL & NATGAS sold off beyond expectations , I noticed that the equities stopped selling off and began building constructive bases. Temporary bottoms or permanent? Its too early to say for sure , but trade-able? Most certainly.
Here at Chartfreak, we have been buying & trading them for weeks now. I want to share some of the charts and ideas that we are again looking at , since I am expecting another leg higher.
OIL Feb 10- Some said "Bear flag" We had been trading energy stocks , and I saw signs that OIL wanted to go higher.
Feb 18 - consolidation/ base building. I posted this chart , I wanted a drop to $49 actually...
Read MoreAfter watching various sectors endure some prolonged sell-offs, we've been able to buy near the lows and make some decent gains %-Wise. This does raise a few questions. Are these THE lows? Are these sectors just bouncing from oversold conditions, only to continue lower later with a double bottom or even making lower lows? Lets start off by looking at some "lows"
This is our current chart of OIL
You see definite signs of improvement in this bounce, but I wanted to point something else out just to keep us alert...
Read More The Thursday report covered so much and the weekend report will wrap up the weeks activities, so I dont always feel the need to write a report on Friday. There are actually a few things of interest to note since yesterday however, so I wanted to cover those before the weekend. I'm going to start with...
OIL - As expected, A productive & Trade-able bottom for now. More on OIL in this weekends report.
Moving to the markets ...
Read MoreBack in Dec, I noticed some interesting activity in the charts of 3D printer stocks, and pointed it out in my reports. Often after a large sell off, when selling gets exhausted , you get a period of short covering. Sometimes that can turn into a mini rally, but the inevitable pullback is to be expected . What can we look for then? Is there a way to tell if they are a Buy? Lets review:
I noticed a strong high volume POP in VJET
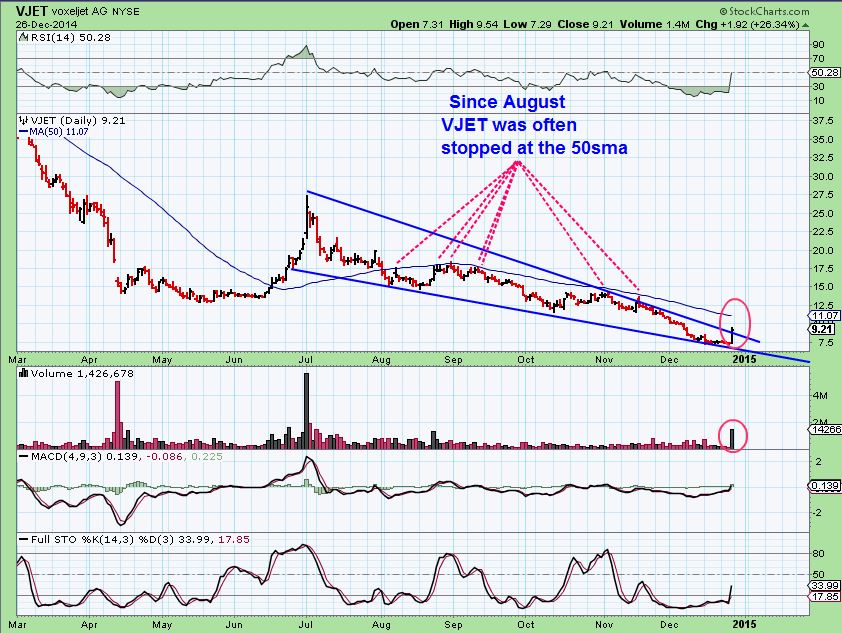
SO I decided to look at other stocks in that sector and see if anything was interesting ...
Read MoreDid you see what I saw yesterday? I had mentioned in the weekend and daily reports what I was looking for, and by the end of the day I was fairly certain that we got what I was looking for . First lets review the markets and then discuss other sectors.
Again, I had been shorting the Nasdaq at prior highs using TZA, but I stopped last week and pointed out why last wkend...
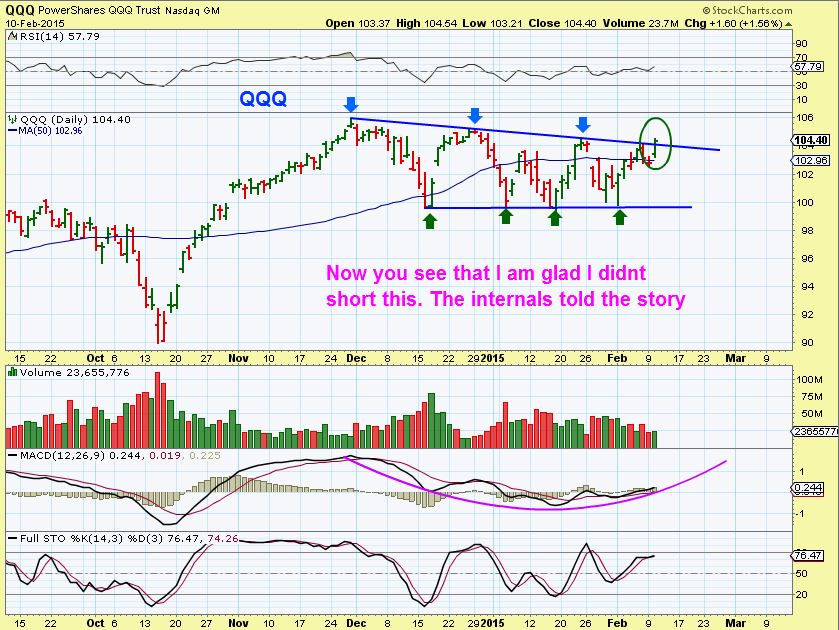
What do I see now in the NASDAQ, SPX, and DJIA?...
Read More
Scroll to top