At times we sell and stay out, conditions may not be setting up for a low risk buying opportunity. At other times, however, we wait patiently for the trade to come to us and then we Buy The Dips. Are we in that position now? Some sectors are saying, "Yes, you may want to buy the dip!" lets review several sectors first and then discuss what might be setting up as a good long entry. To the charts!...
QQQ - this weekend I said I wasnt shorting this set up anymore at the blue arrows anymore / I saw internal strength
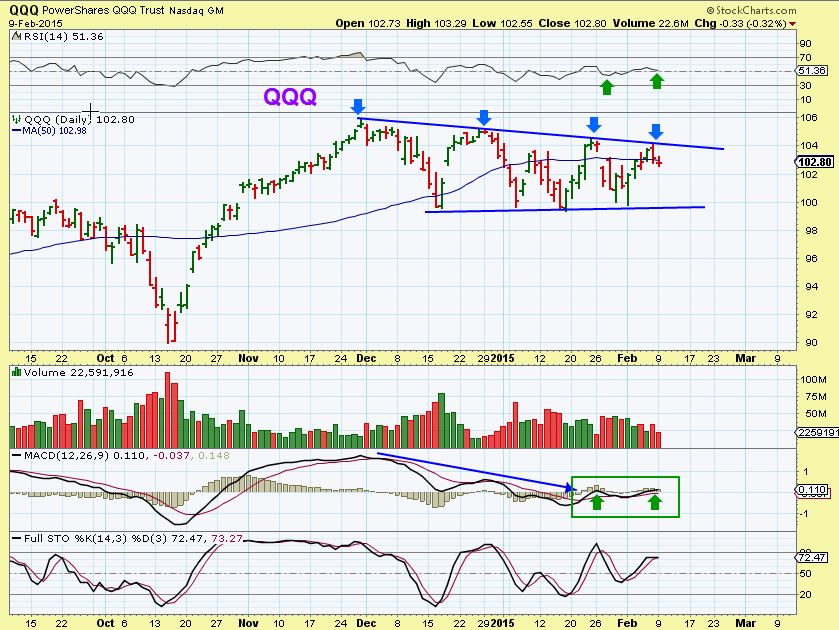
Yesterday we saw this
Here is what I am thinking...
Read MoreMy observations in last weeks reports and the weekend report are playing out very well and my recent recommendations in Energy are already up 20 - 40 % . There isn't much to add, but we are watching how things unfold to try to see whether we have further upside in some sectors, reversals in other sectors , and so on. This helps us to see where our opportunities may arise in the future. To the charts....
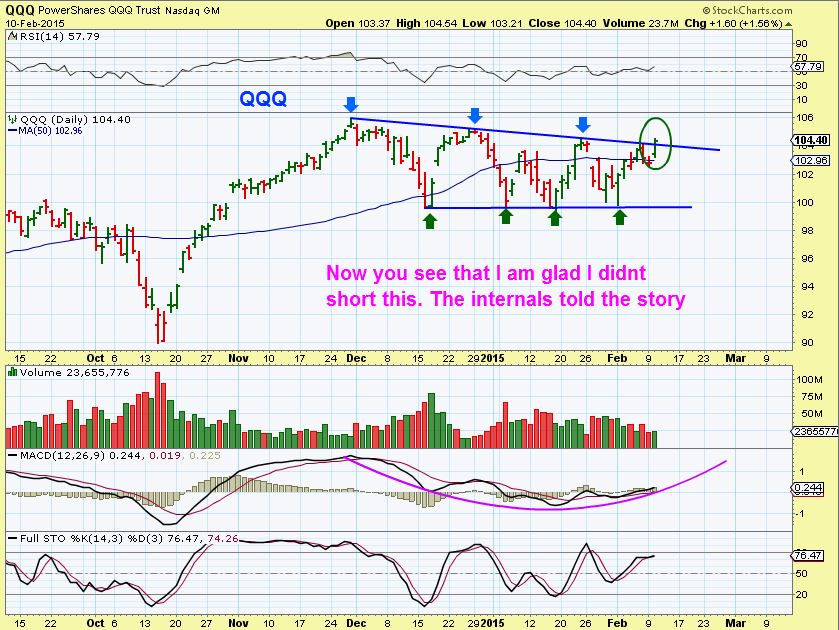
I expected a turn down, but wasnt shorting it this time
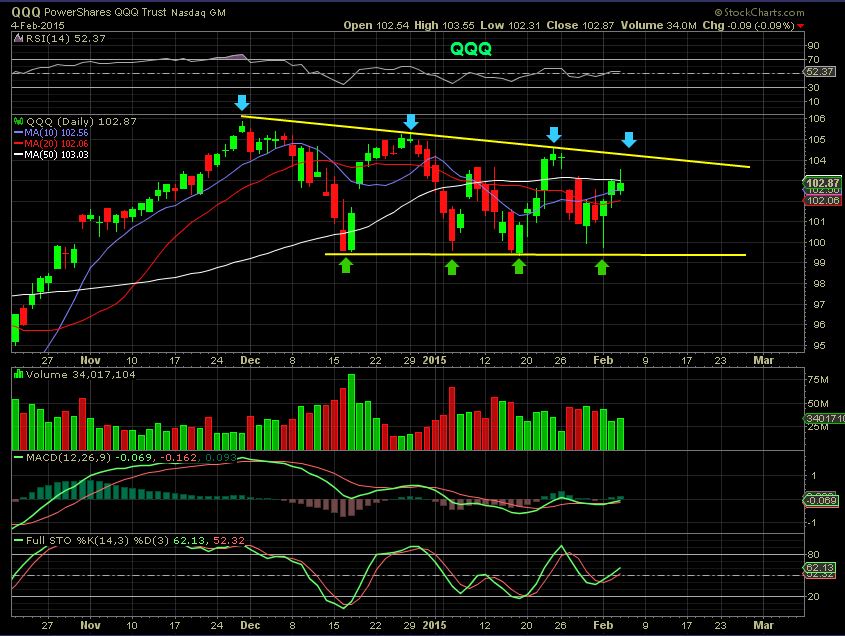
Why wasnt I shorting it this time? ...
Read MoreI have learned over the years that you never win when you try to tell the markets what to do. It is best to be patient and listen to what the markets want to do... being patient and less forceful can help keep one from getting bitten . With that in mind, I have a lot to look at in the weekend report, Equities, Natgas, Oil, Energy stocks, Gold & Miners , etc so ...To The Charts!
After shorting the trading range a couple of times at the tops with TZA , I posted this Friday Morning
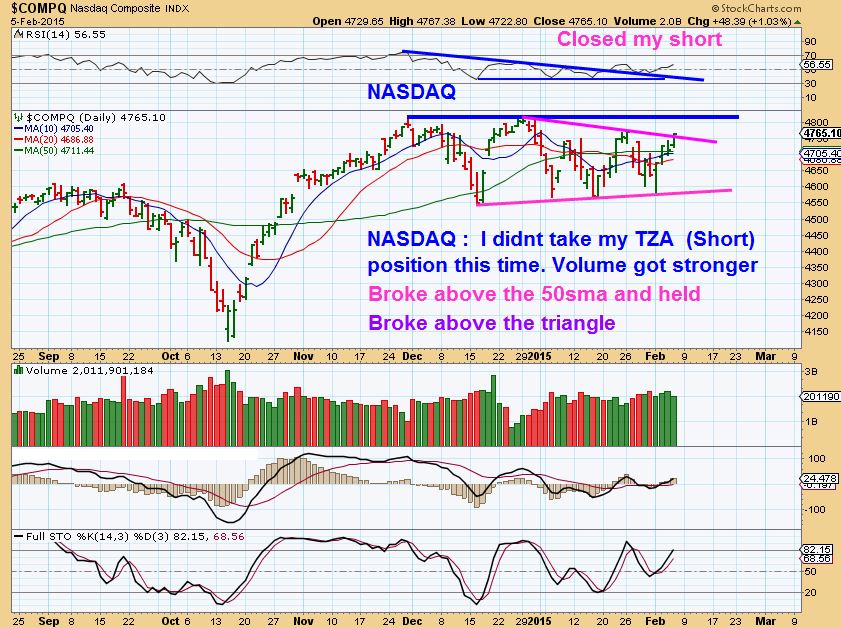
I wanted to watch things here and even though the markets did reverse into the close and started to head down, I still didnt take the short side. Let me show you why...
Read MoreFriday , one last day in the trading week. 'Friday reports' are often not necessary, unless something has changed. For the most part , Tuesday ,Wednesday, and Thursdays report still apply , but there are a few noteworthy developments , and today we have JOBS REPORT FRIDAY , released at 8:30 A.M. Eastern time , so let me just cover a few things.
I posted this yesterday
I had been shorting the blue arrows and selling 1/2 at the lows. It was fun while it lasted , but I said I was closing that position, some things looked different...
Read MoreThe website went down and my apologies for this report being released a little late, thank you for your patience! I had so much to cover, so I am going to try to write less and allow the charts to speak for themselves, feel free to ask questions in the comments section if you need my help...I will be available on & off today. To the charts...
QQQ - Same ole same ole.
I had been shorting the top ( adding TZA) and closing half at the lows, also watching the 50sma. I closed out this position , but may add if we reverse & drop lower again. It is still unclear which way this will eventually break, here is why...
Read MoreThe following is a portion of a ' Premium Report' put out Monday Jan 26. This is only 1/2 of the report, but should be helpful . To be honest, I initially only made small profits on some of these trades at first. I had to leave town after the New England Storm , and since positions are volatile at the lows , I cashed out & re-entered later when I could monitor them. I 've added a few updated charts too. Enjoy
JAN 26 ,2015
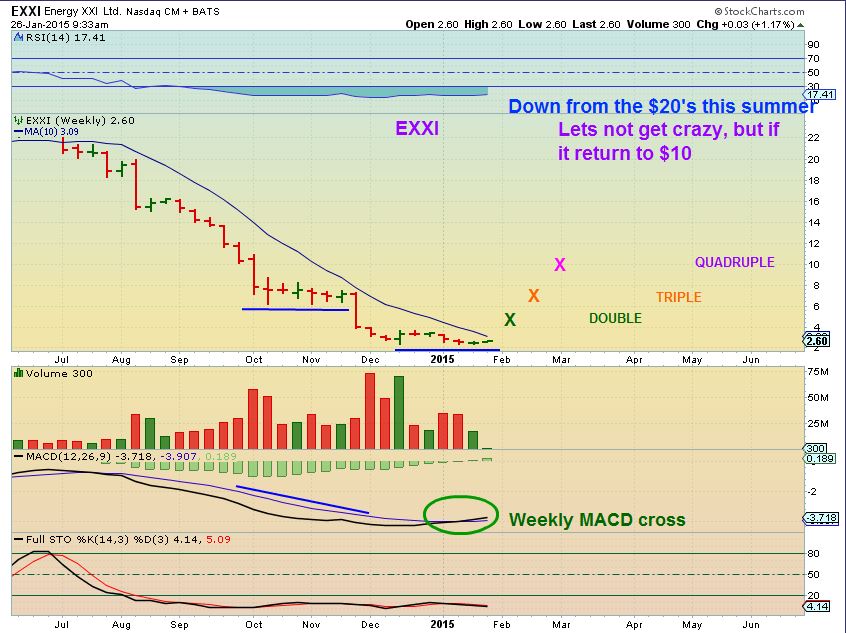
Let me start by showing you an Energy stock that got taken out to the whipping post. It is beaten down and has double bottomed. It seems like all of the downside ( At least for now) has been met. Risk reward is skewed toward less risk (Using stops) and more upside potential if conditions play out. Some of these stocks could just "Bounce" and do very well.
EXXI WEEKLY - Double bottom with a MACD cross? $2.60
Read MoreI have a lot to cover, so lets just do a quick review and on to the charts...
SPX - as the consolidation continues it goes from looking weak to looking more bullish
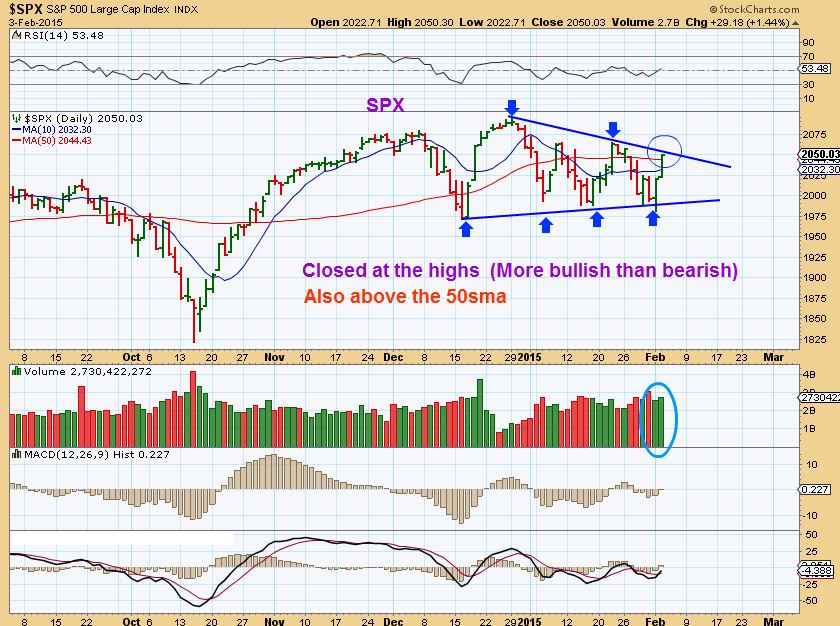
In prior posts I wrote that...
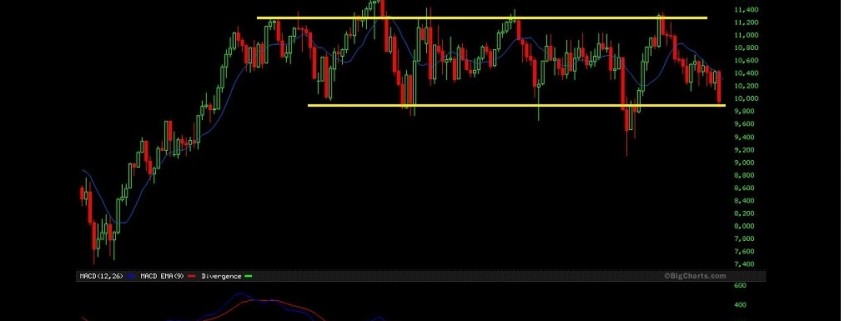
Read MoreAnswer: Frustrating ! Actually its an example of a trading range. Often after a stock or index Price has run higher , you get a sideways consolidation that is called a trading range. They can form as flags, wedges, channels, etc. It can be a trading opportunity on one hand, buy the lows & sell the top/ flip and short the top , ride down to the lows. If you aren't an active trader, however, and you are just waiting for some directional move, a nice trend to ride? It can be a little frustrating. Its tough to tell which way it will break, and the chart above actually looks like it may break higher. The chart below is the end result of the chart above.
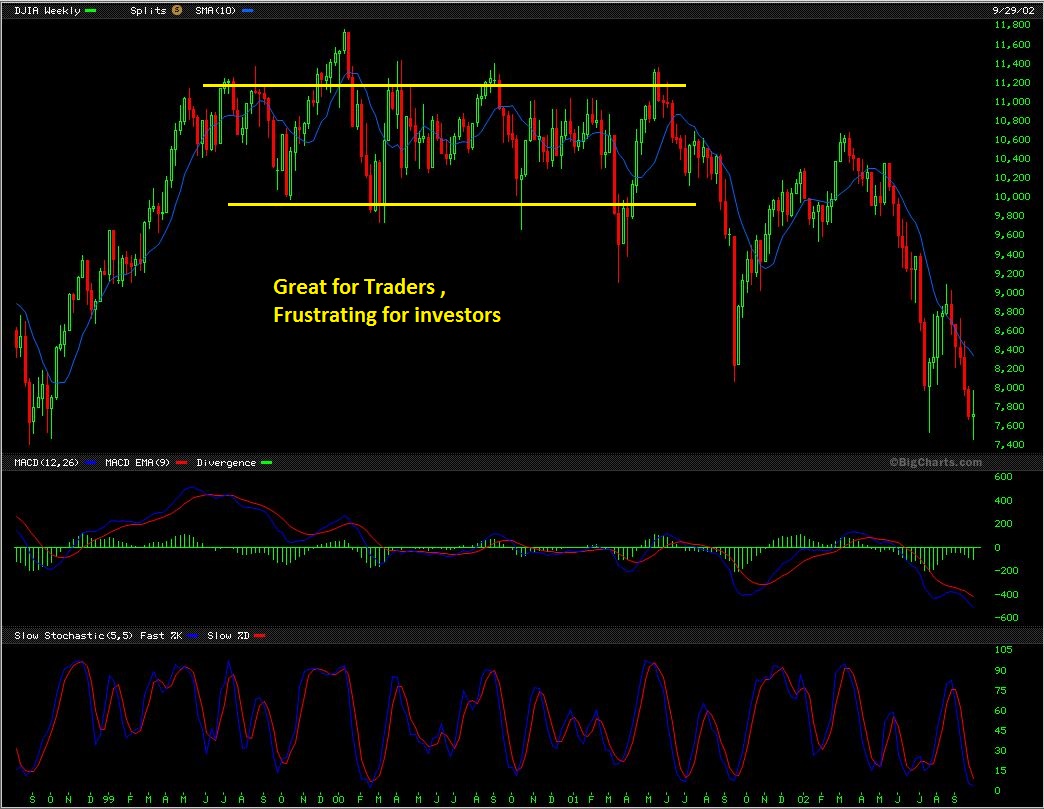
The reason that I bring this up is because our markets are currently in a consolidation too...
Read MoreWe have been watching some great battles going on, and thankfully we have been able to make some nice trades despite the up & down action of the various markets. Volatility can be a traders paradise, but an investors nightmare as price basically can remain the same in the up & down battle for direction. Having technical analysis, some cycle counts , and a bit of experience in our tool box , we gain an edge in certain areas. This weekend report will highlight some interesting charts ( 24 charts again to be exact!) ...so to the charts!!!
Well look at this break out in OIL
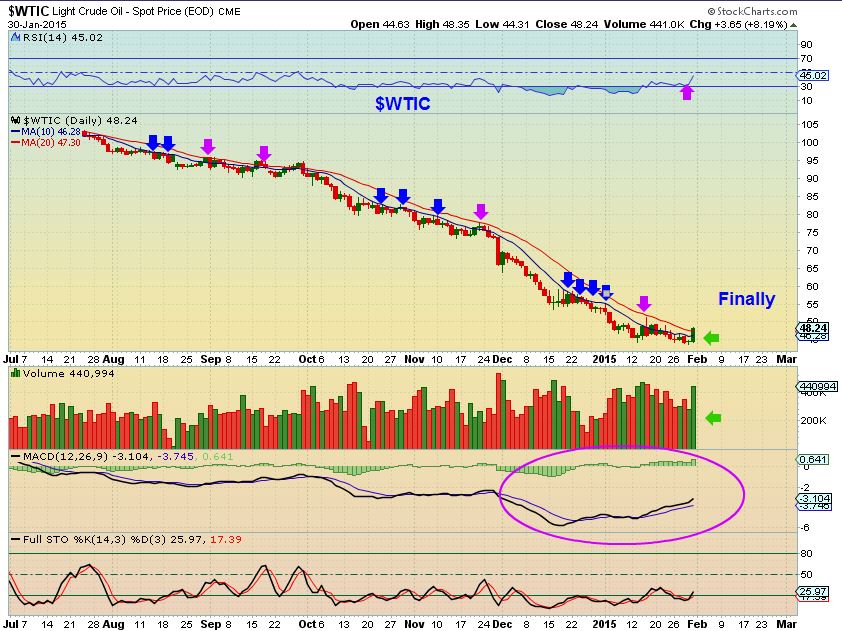
It exploded at the end of Friday and shot up 8%. That is a lot for a commodity like OIL. It closed above the 10 & 20 sma for the first time in a long time , as you can see.
Read More
Scroll to top