Archive for month: September, 2015
It's time to discuss decay in the Oil and Metals markets, but first lets do a review of the equity markets.
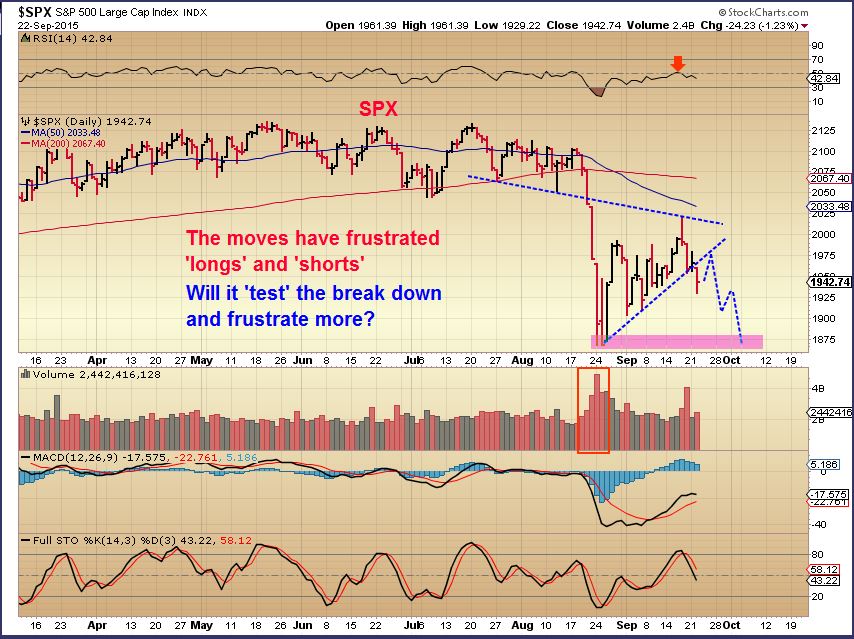
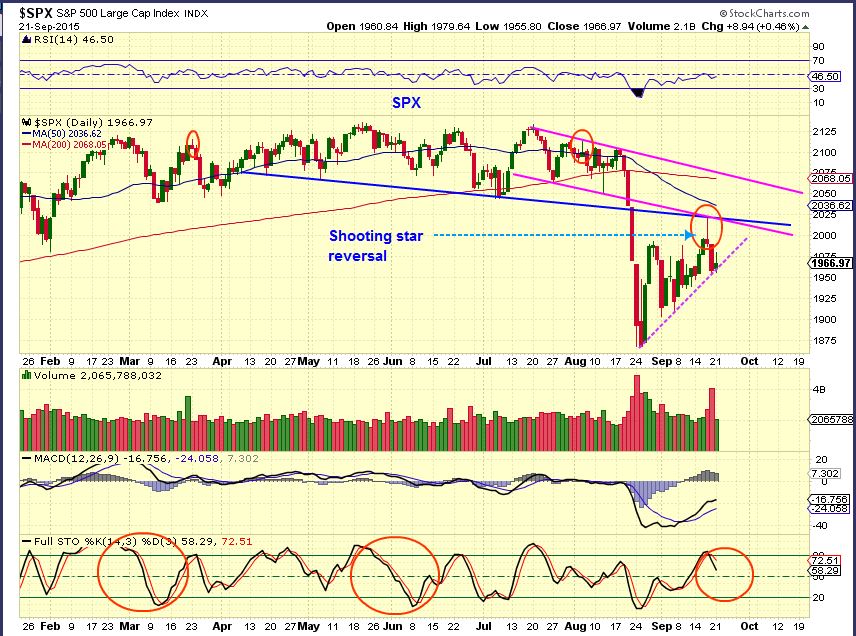
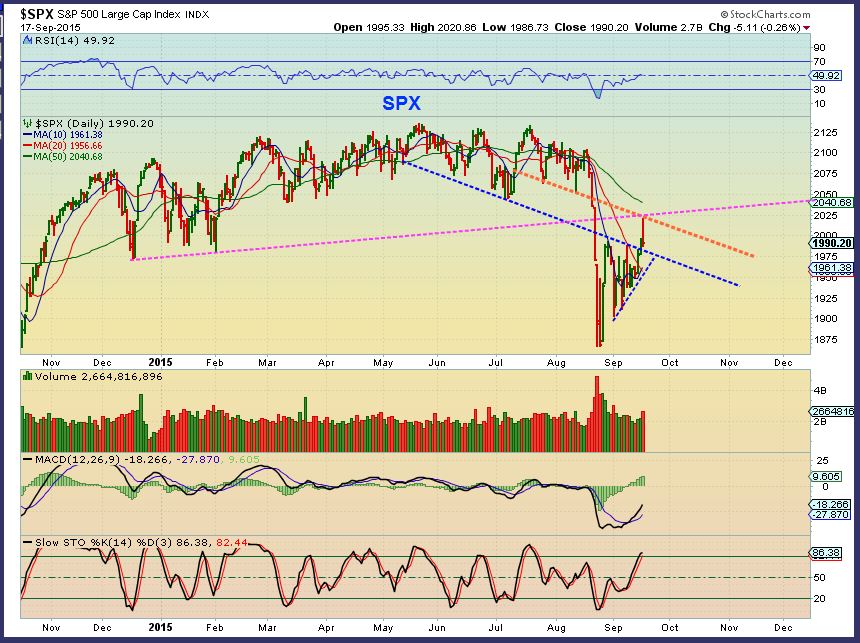
SPX- This was Sept 15. I have been saying since August that I expect the lows to be tested sooner or later.
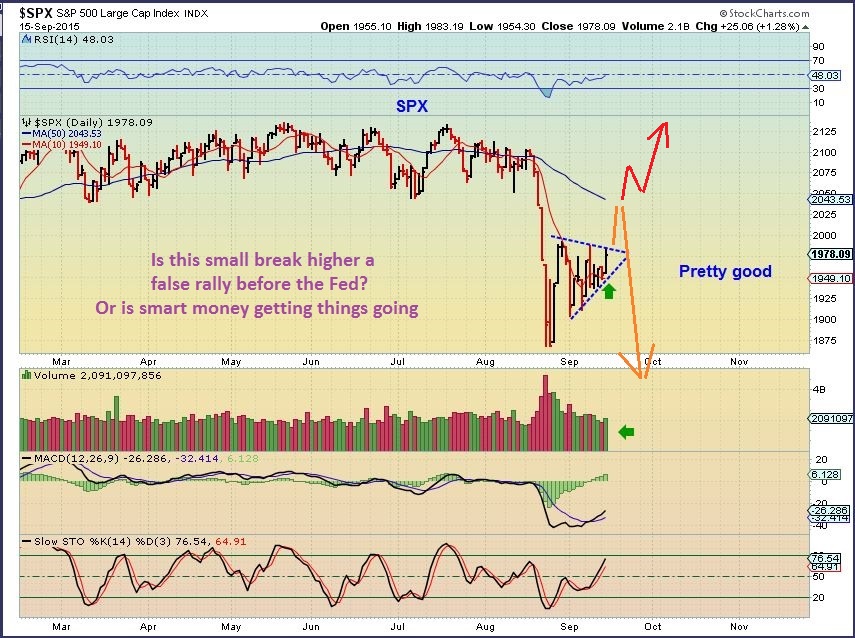
We see that happening now, so what next? ...
Read MoreCrazy action in the markets today. Some of it was expected, but some of it doesn't seem to fit. Lets take a look.
IBB - Really taking it on the chin lately. This is a weekly chart and todays volume was massive.
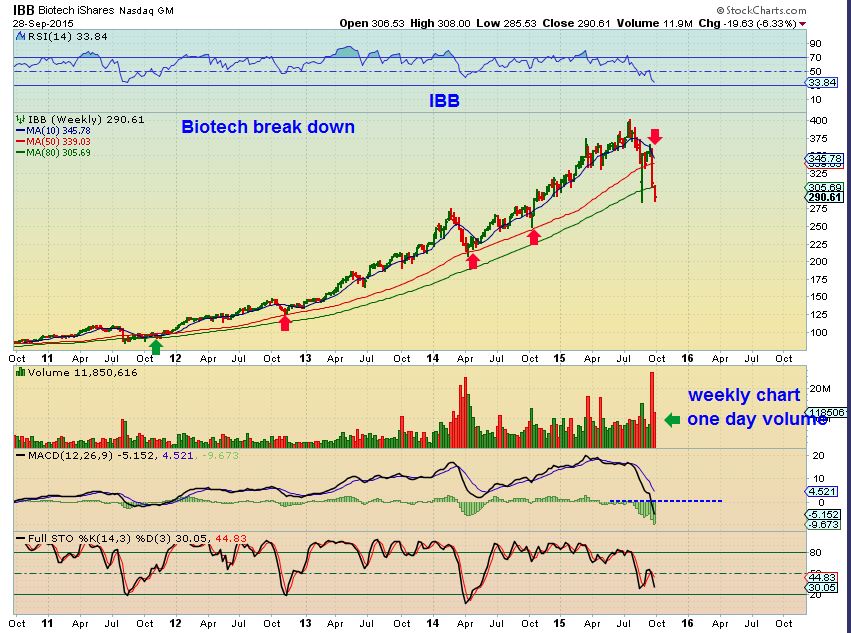 Read More
It would be good to look back at the past weeks activities and see how things are stacking up.
TRAN WKLY - This surely hasn't looked bullish as the trend changed. The Tran was rejected at the 10 ma this week again.
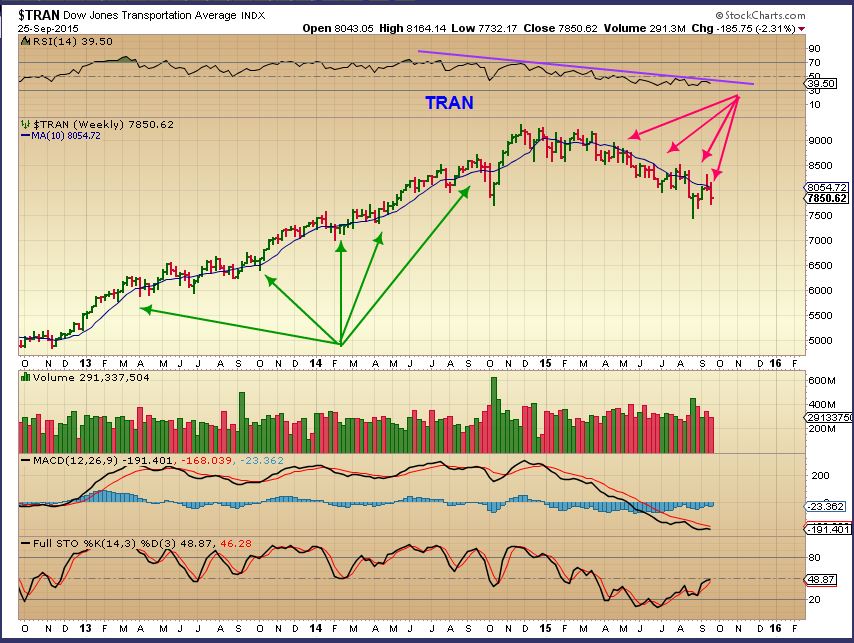 Read More
A quick look at the markets and a brief discussion on shopping
On Sept 22 - I said that I was looking for a possible 'Test' of the break down and then a drop.
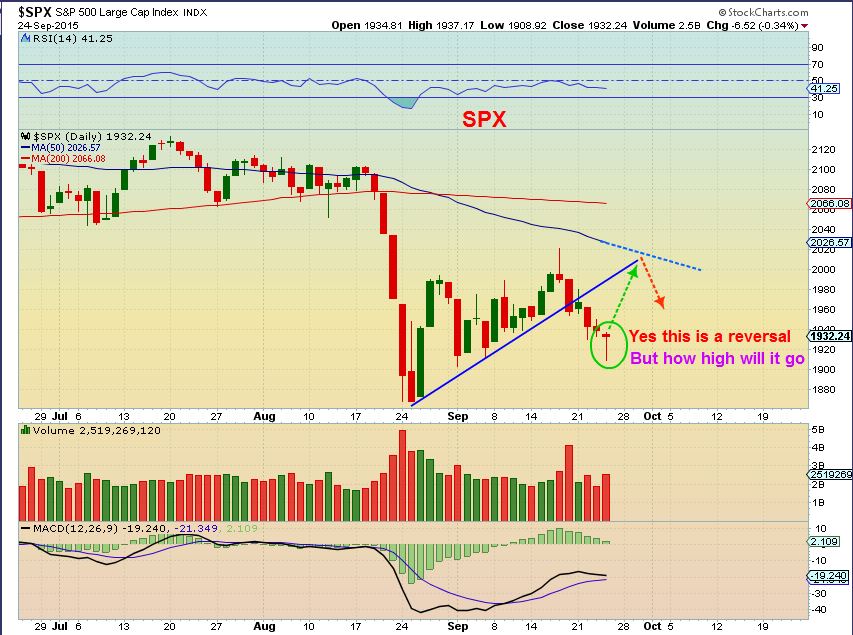
SPX - Reversal candle. Maybe that 'Test' comes now.
 Read More
Yes, Gold is jumping, but we’ve seen that before, right? The question is , ” Will it make it to it’s intended target, or land flat and flounder around like a (gold) Fish out of water?” Here at Chartfreak, we have been waiting for this next leg higher. Lets review some of the charts from recent premium reports…
GOLD,SILVER,& MINERS
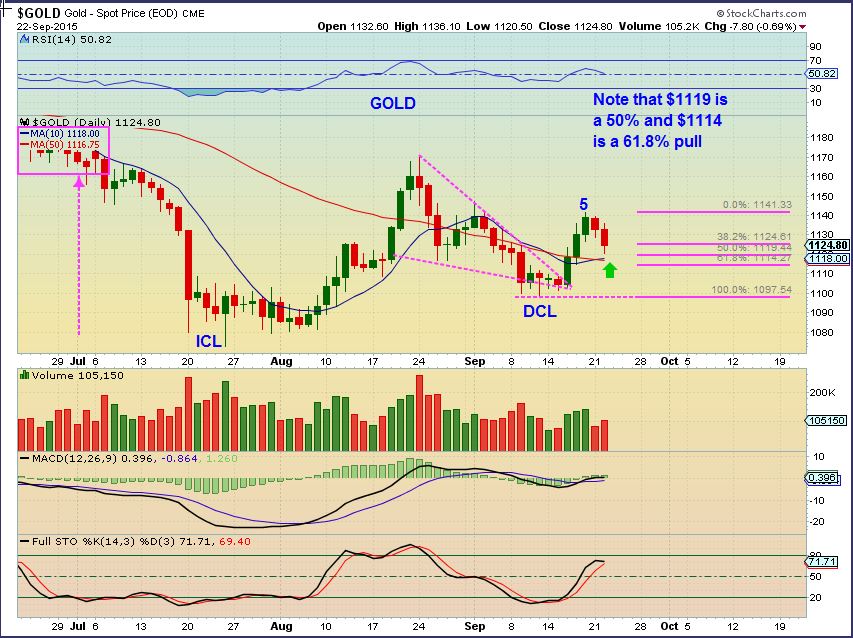
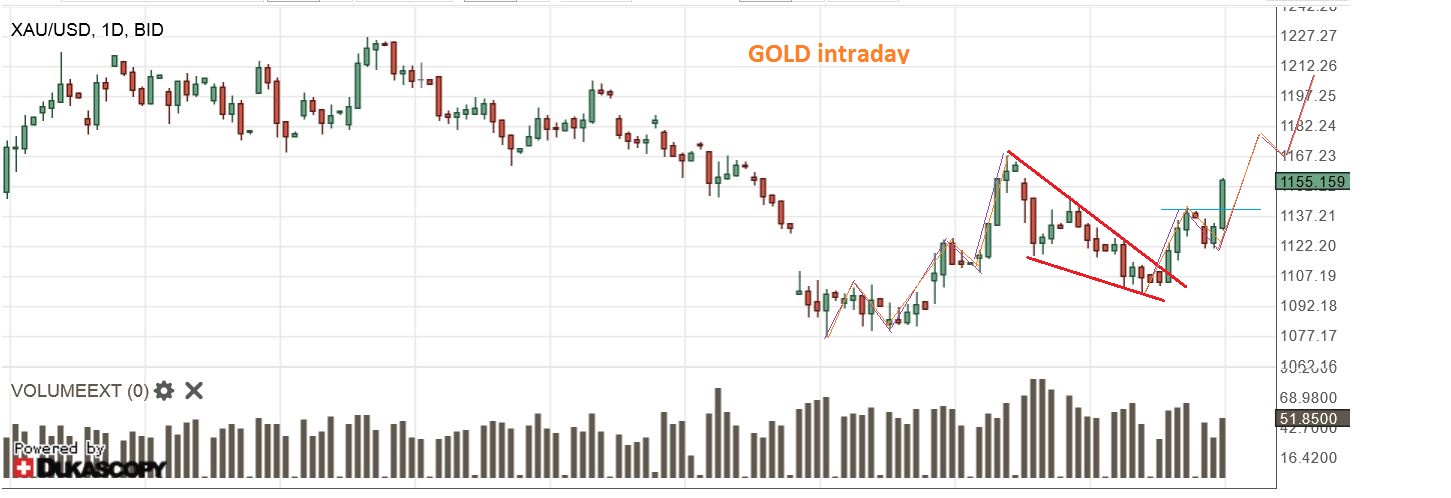
GOLD SEPT 22 – Looks great on day 7. The first run up went from $1072 to $1169. It could pull back even further and still look very Bullish, but it doesn’t have to. We are in our second daily cycle and I expect that Gold could run to at least $1200. We will monitor it along the way.
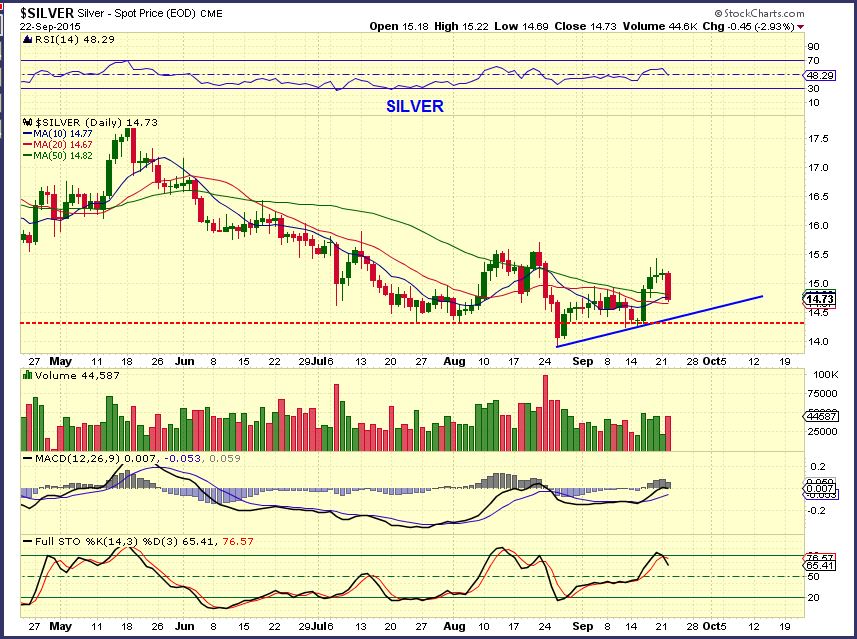
Silver – pretty big 1 day drop, but it has not moved down with Gold on the last 2 days, so it is not a broken chart by any means. Notice similar 1 day drops in July and August that had no follow through. I wanted to see those moving averages hold, and I am also watching the trend lines drawn.
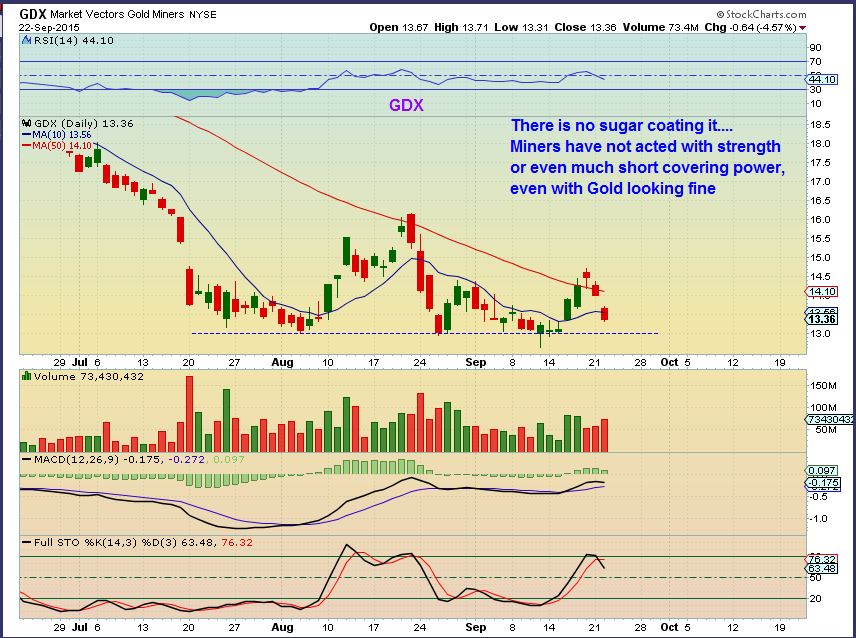
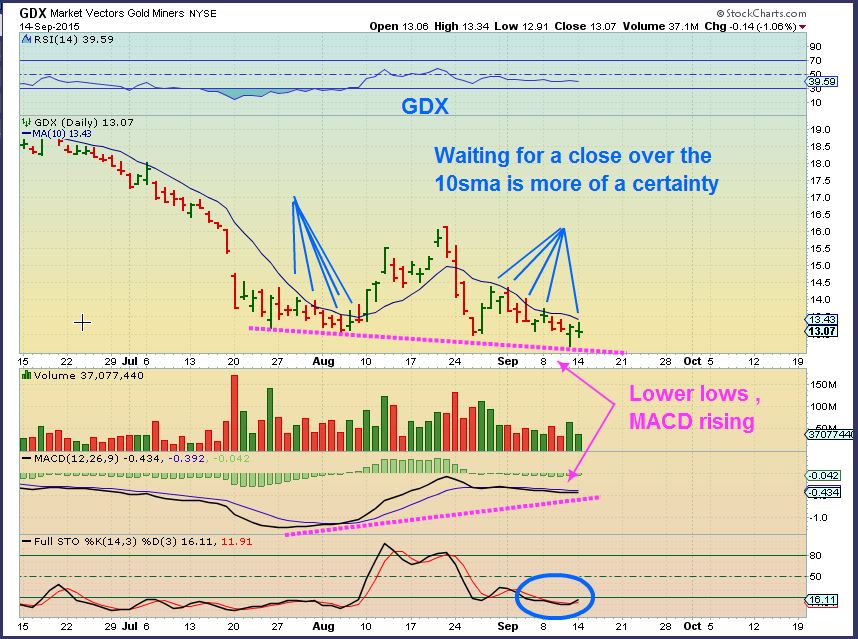
GDX – Yes, GDX fell more than I expected. I was looking for the 10 SMA to possibly hold as support. The chart is not broken and I’ll show you why…
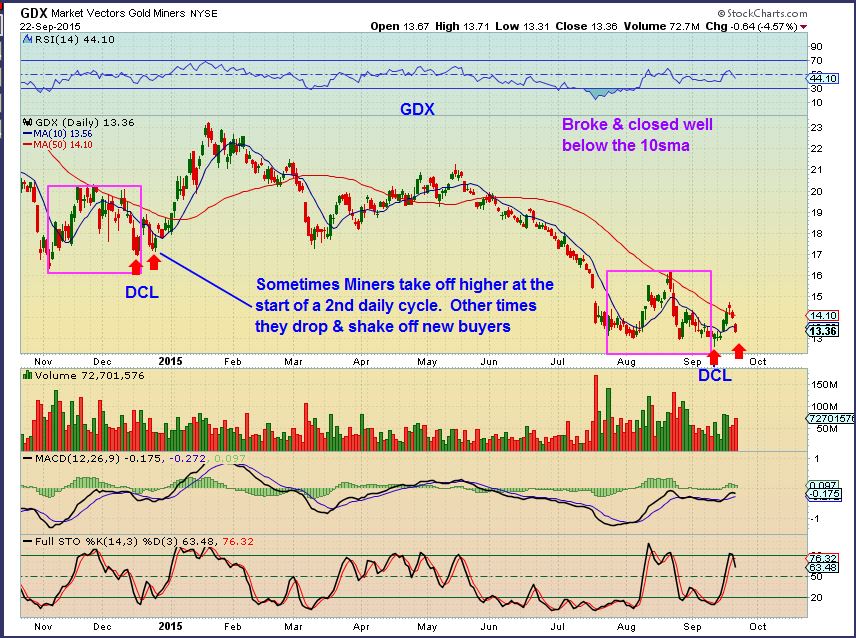
GDX (2)– Looking back at last Nov-Dec when we were dropping into a 2nd daily cycle (RED ARROW) . We took off and curled back down to the lows again ( 2nd red arrow) before a nice blast off higher into January. We could be seeing that here, thats why I say the chart is not broken.
Some were not happy with the action in GDX (understandably) , so As a reminder , I posted this in last nights premium report.
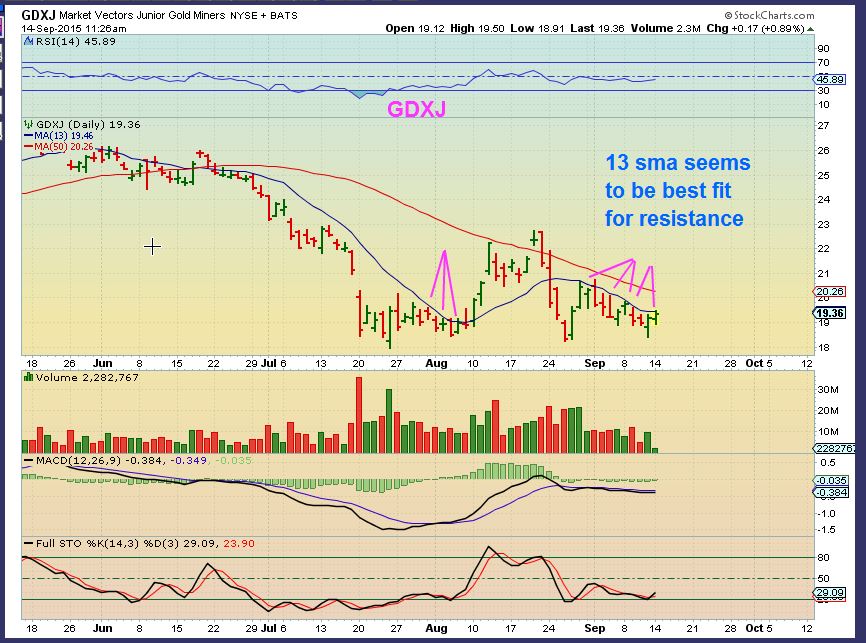
Here is a close up of that period last Dec 2014. GDXJ popped and dropped to shake out weak hands. This looked exactly like what we were seeing now. Compare these 2 charts below together. The 1st is last Dec and the 2nd is today. Twins.
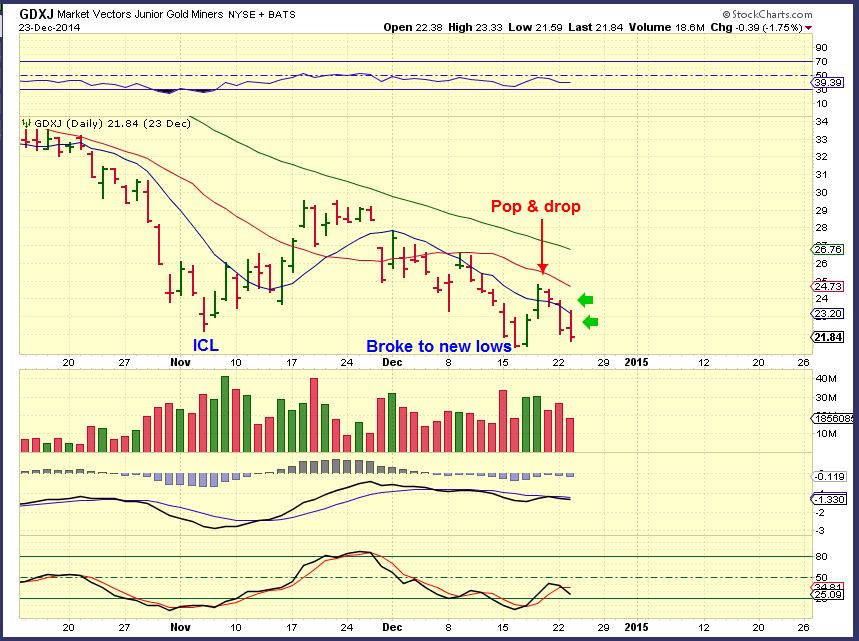
. 
What happened next? This is the same chart of last December as the anticipated run started. The red arrow points to where the first chart above ended.
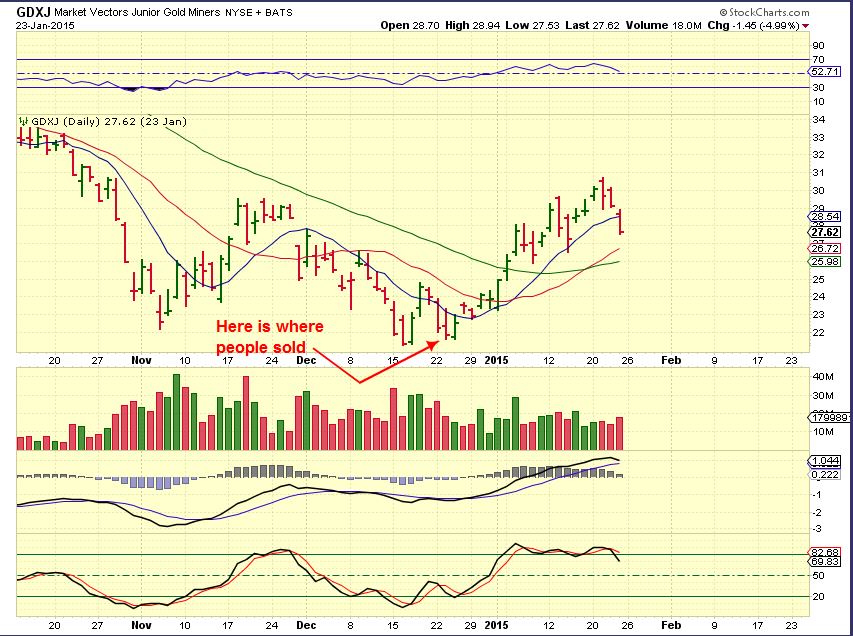
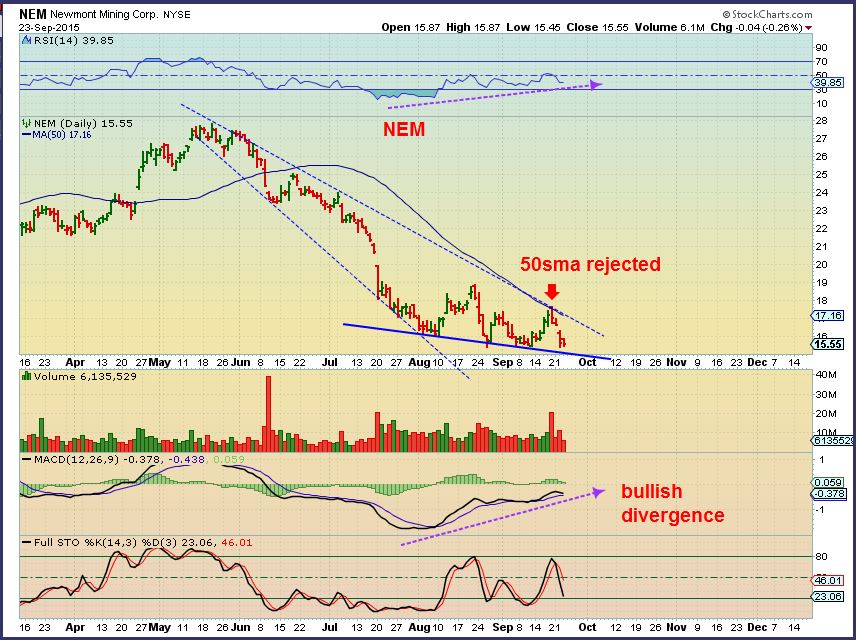
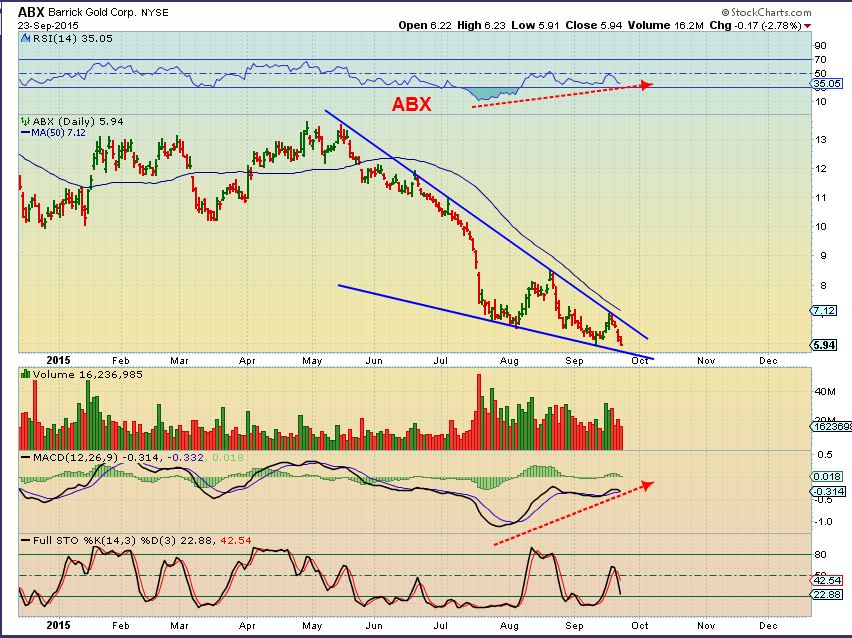
Conclusion: We were in the 2nd daily cycle and a rally should begin soon unless something is very wrong. I also looked at the 2 charts below and declared them bullish, to further the case for a bullish move in the near future. They are larger components of GDX. Bullish descending wedges.
Today we have this (Click to isolate)
GDX 2 hrs into trading
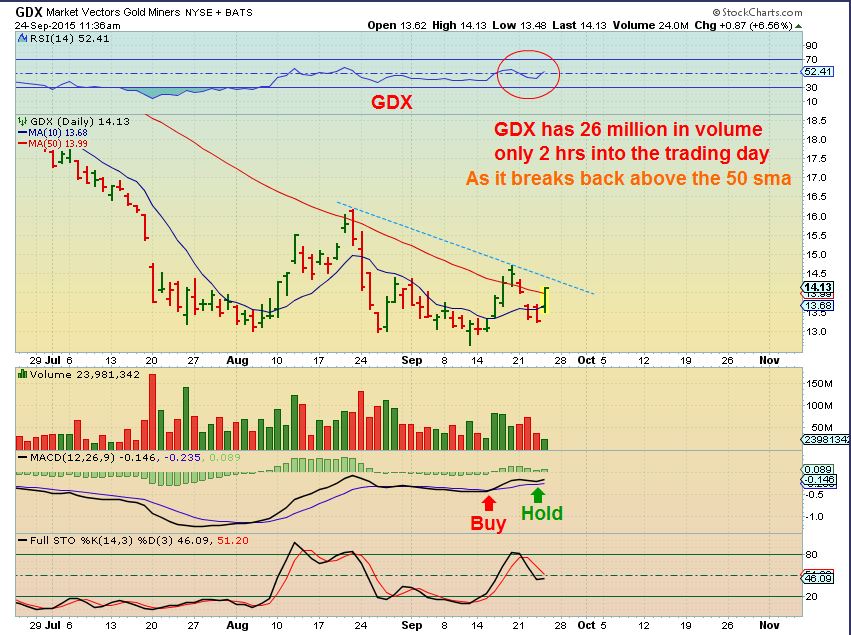
I have been calling for another leg up, but many were growing weary (understandable with that GDX drop) . The above analysis was designed to help my readers to see the possibility and likelihood of the coming move higher. We saw dips like that before, right before a rally. It’s time to go shopping friends. Find your favorite Miners and gather a basket, start small if you have your doubts. Were you confidently expecting a move higher in Gold? Do you still have doubts? Though we saw weakness in Miners, we were still expecting a move higher in Gold , and we were watching for the Miners to get on board. Today we are seeing positive follow through.
I will be covering some set ups in future premium reports, and also navigating this move forward, since I believe we have started the next leg higher. Why not try a 1 month sign up? Thanks for being here!
~ALEX
Whenever we get mixed signals in the markets, it may take time to allow things to clear up. We are seeing that with the divergence between Metals and Miners right now, but until time resolves the differences, we can also look for clues. We'll do that here, but first lets review a few other sectors.
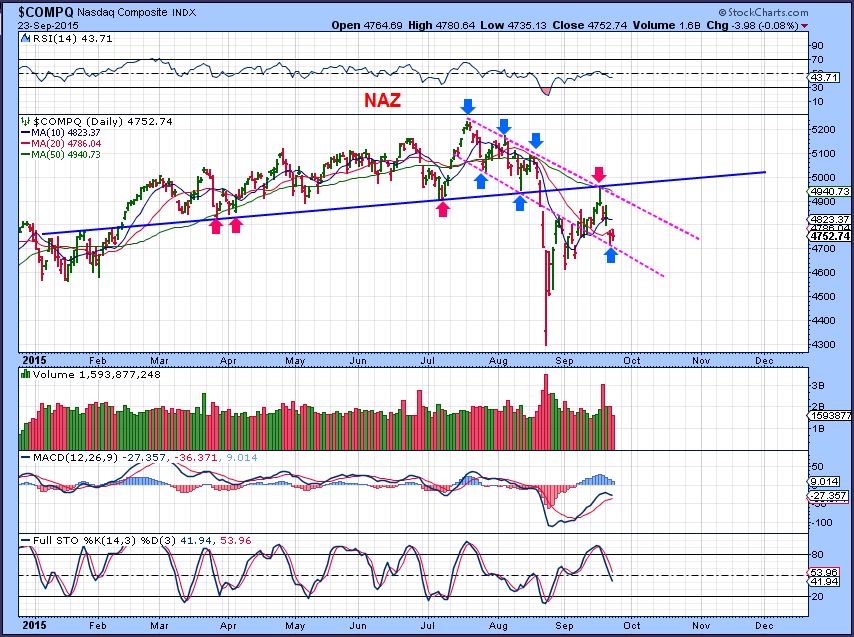
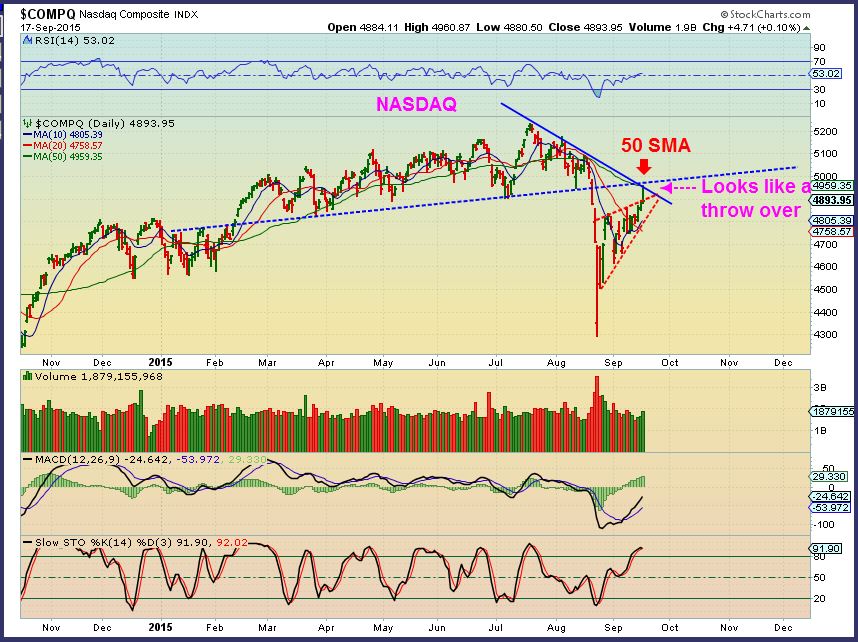
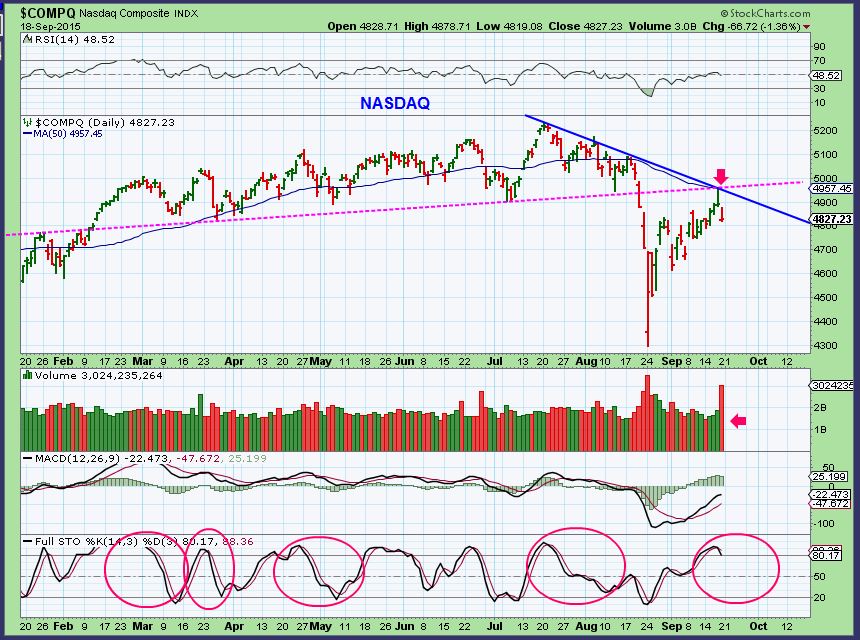
NASDAQ - We got the back test that we expected and then the drop back down. I expect the Aug lows to be tested or broken, but you can see that volatility has kept things from being a smooth move. We may bounce around inside this down channel too.
 Read More
We are still keeping an eye out for various signs in these markets. Lets take a look...
TRAN - I posted this wdge as a warning in Monday nights report
TRAN - There was some follow through.
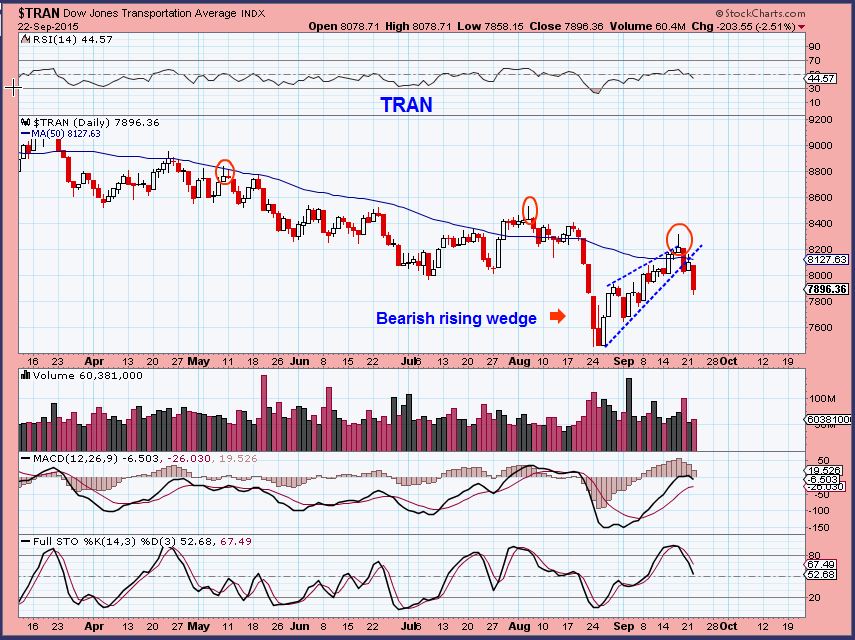
The selling was not on very heavy volume, so I am starting to think this move is going to drive longs and shorts crazy, here is why -
Read MoreOur positions in the Miners are pulling back, but it is a slow pull back so far. This pullback was expected. We'll discuss what to expect later in the report, but lets start with the pull back that came in the equity markets first.
SPX - It started with a shooting star and the stochastics indicate that we could see more downside. In fact, I have mentioned that I expect a test of the 'high volume candle lows' sooner or later.
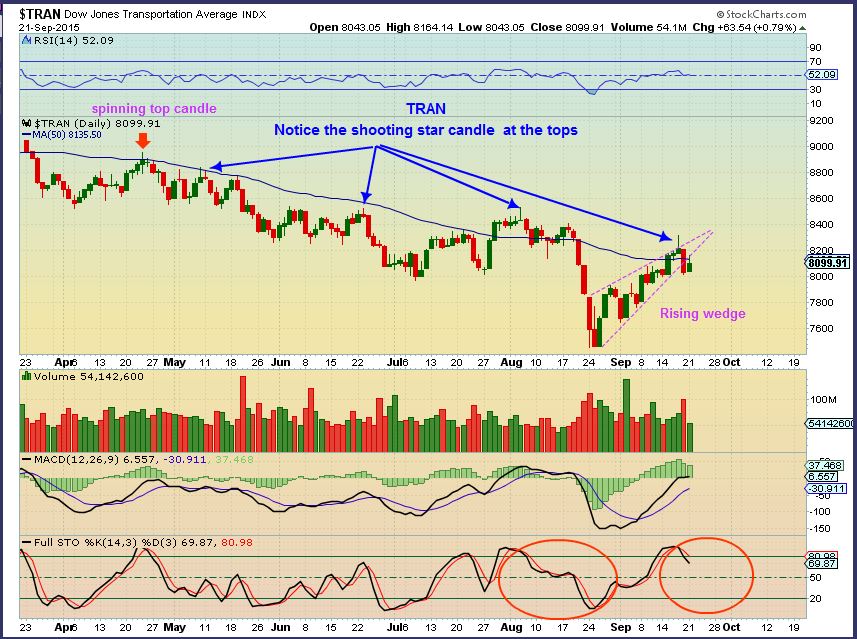
The TRANNIES looked pretty strong re-gaining that 50sma, but they've done that before and a rising wedge is bearish. Notice the shooting star candles at past tops?
OIL is playing out as expected too...
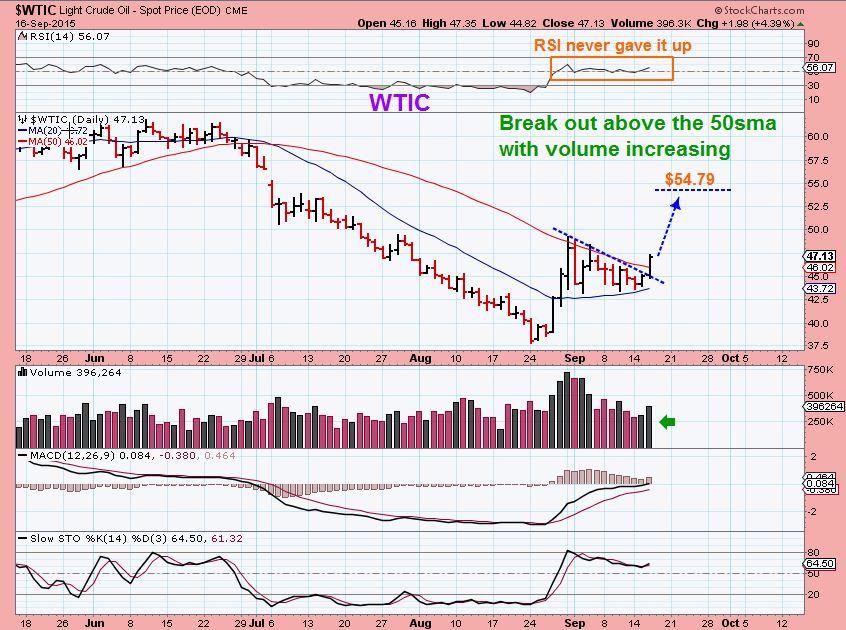
Read MoreEarlier this week I certainly thought that the markets were waiting for the Fed Decision on Thursday before making any big moves. Yesterday, Oil, Energy, and Precious Metals jumped the gun and were off and running!
WTIC – The set up was a Bull Flag pinched between support & resistance.
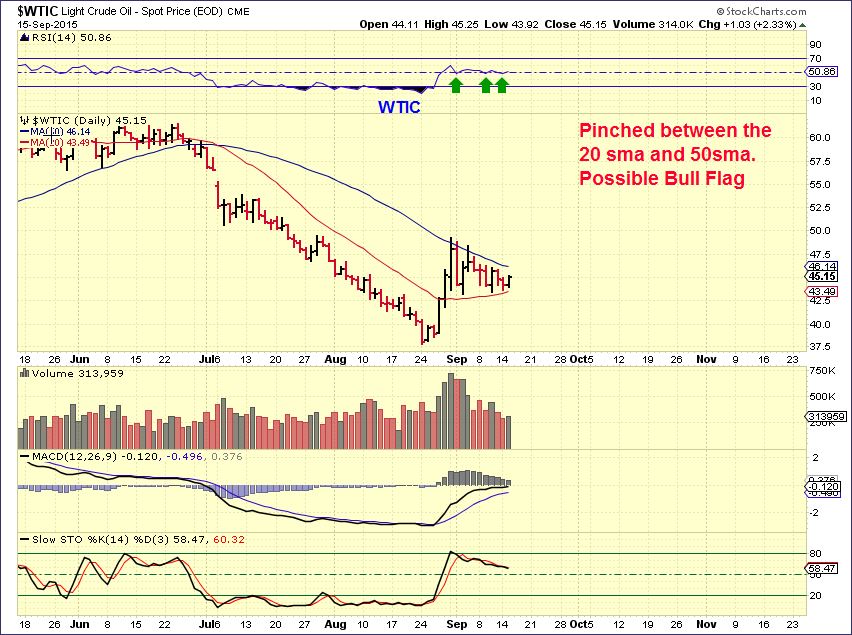
Oil is not waiting for the Fed Mtg. Many energy stocks were up over 10% and some were 15-25% today alone.
I mentioned in a premium weekly report when the markets first crashed that in the past, bear markets dropped and rallied and dropped and rallied. A back test would be likely, as shown. Honestly – we are not quite at that level yet.
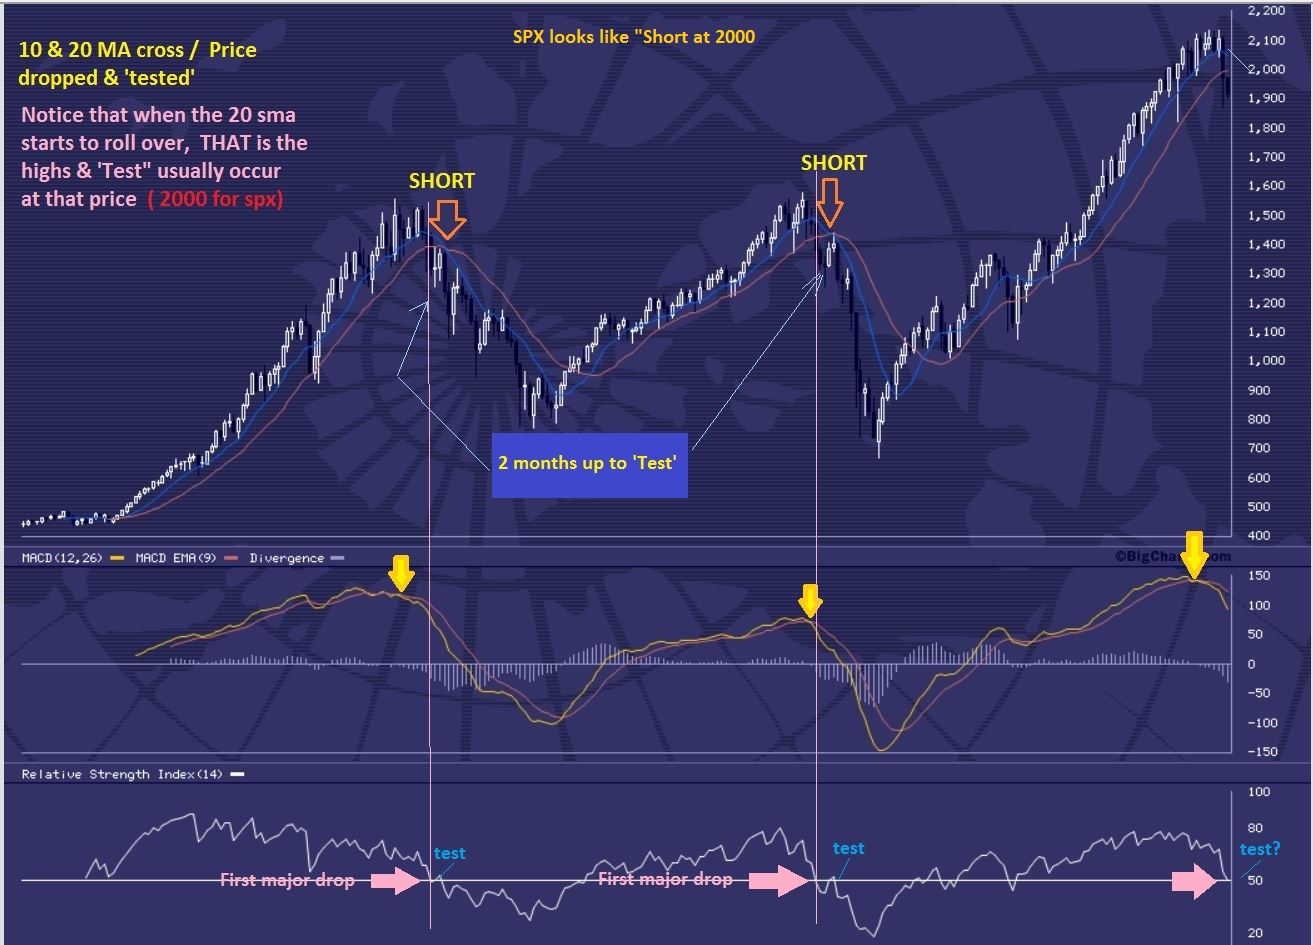
I want to point out a weekly chart of the 2000 Top. There were drops and rallies drops and rallies. We have dropped and rallied in the past 2 months too.
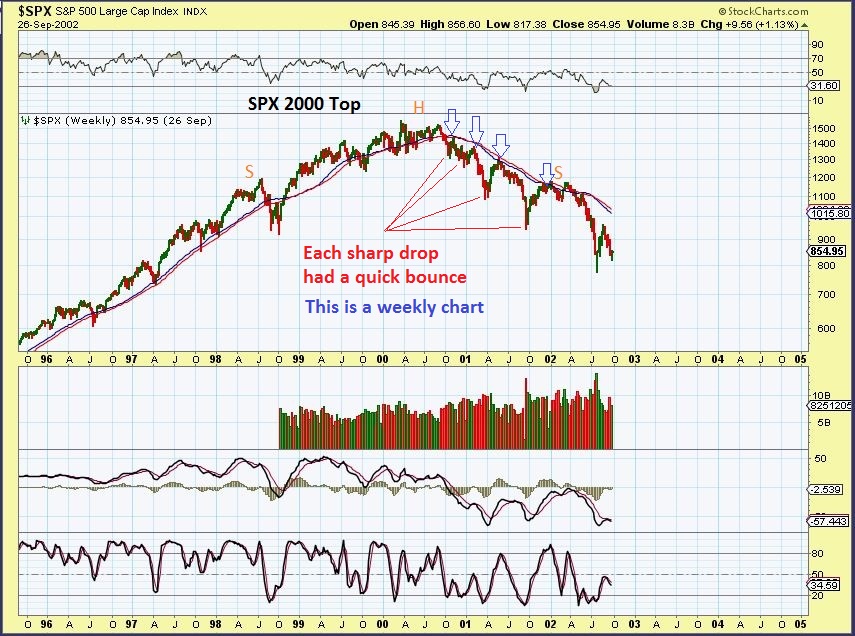
Could we be ready for a Fed induced drop? On a Monthly chart the ‘back test’ is not in place yet, but we can drop here & rally again later.
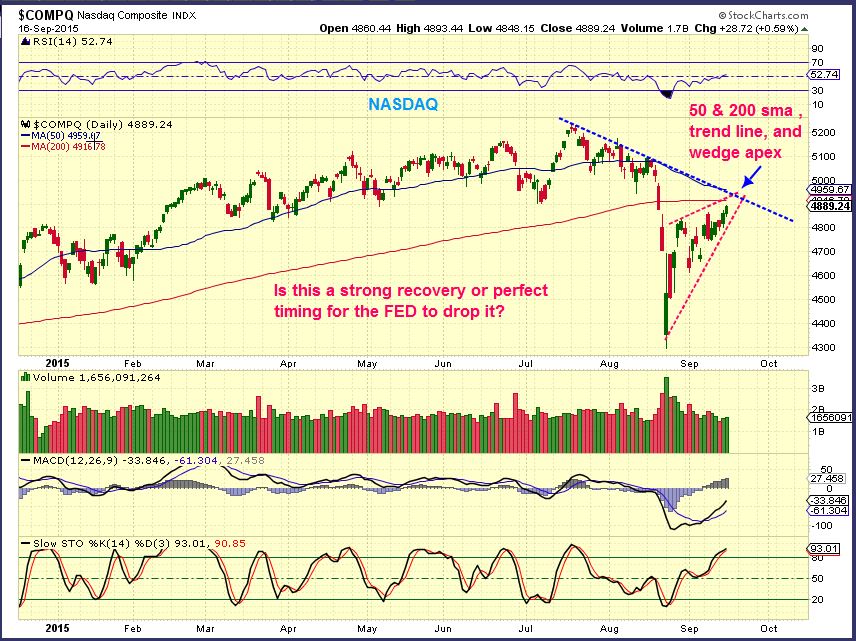
NASDAQ – I just wanted to point out this rally. It looks like a bearish rising wedge at this point, with overhead resistance in various forms.
GOLD and MINERS
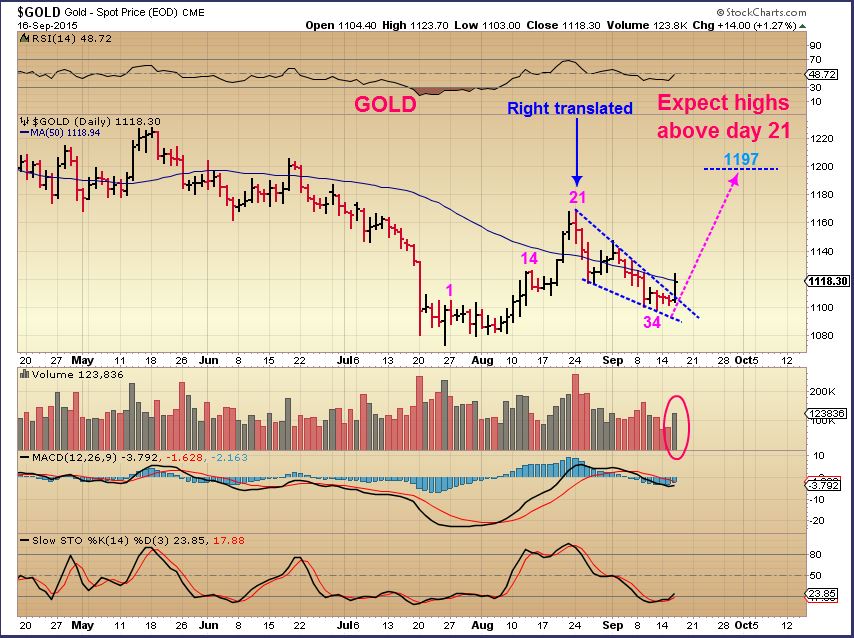
GOLD – The chart in yesterdays report pointed out the # needed to have a swing low in place. Above $1111.90 puts a swing in.
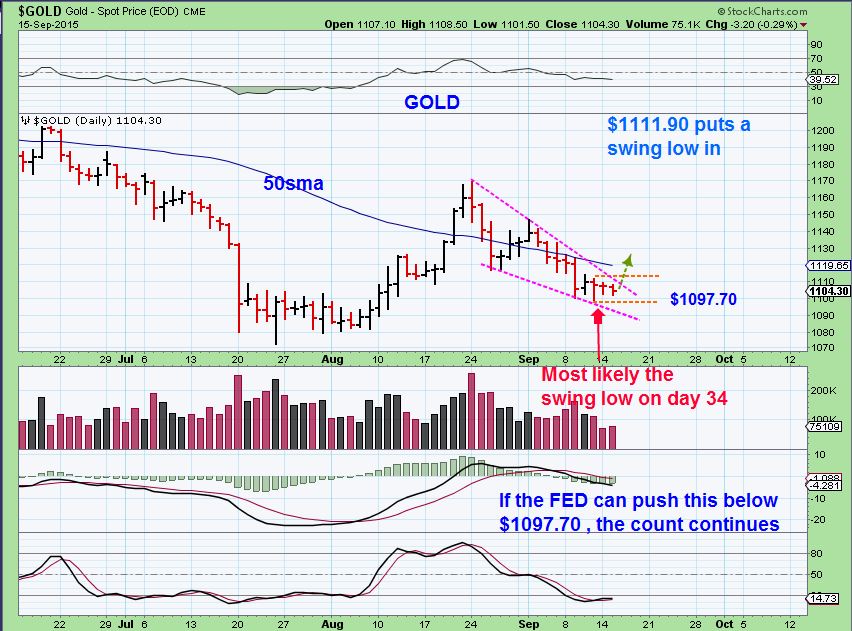
We certainly got that today. A swing low is in place on day 34. That was a right translated first daily cycle, so we can expect higher highs! We broke from a descending wedge and I consider this a buy. My initial target is near $1200 .
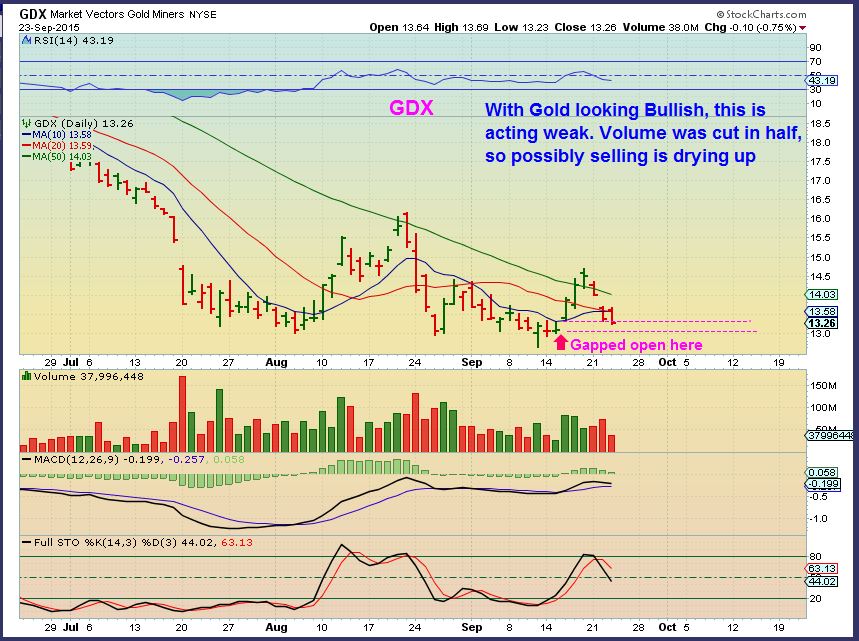
I have pointed out that a break above the 10sma ( and a close there) is a safer area to take a position in GDX. With GDXJ I used the 13sma.
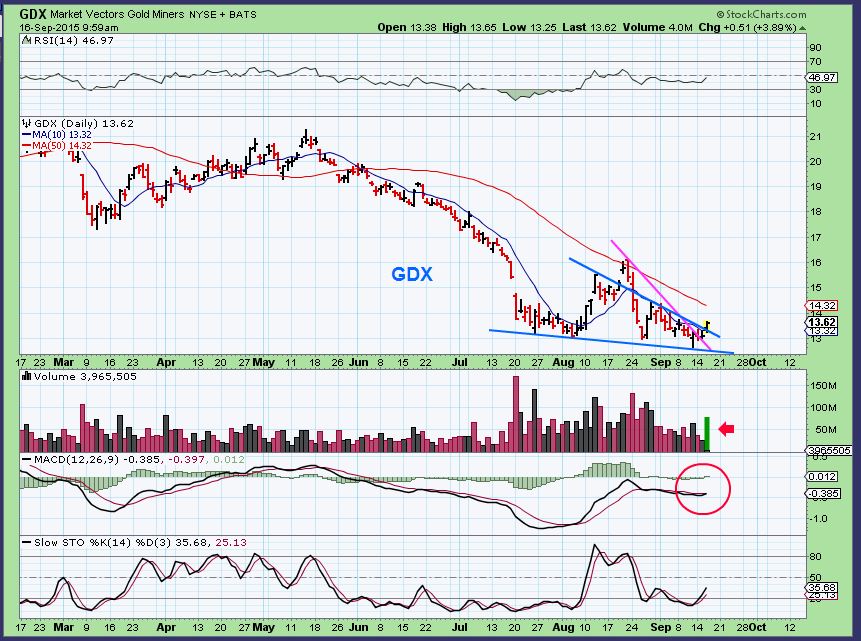
I had expected Miners to wait until after the Fed decision too, but timing was late in the daily cycle and everything just popped all at once. I posted at 10a.m. that volume was likely going to be above 70 million ( by the close) as we broke from the wedge.
GDX – This was my 10 a.m. (yesterday in premium section) chart pointing out the volume to look for if the move was real.
While you wait you can look at DNN (uranium) . That’s a good looking stock set up. See also GTE and UPL – those looks like a buy right now ( Energy). XCO was up 30% (AGAIN!). To see the potential in some of these juniors, check out a 3 month chart of AXU, EGI, & GSS .
Good luck today
NOTE: It’s just $37 for over 20 reports and some 100 setup’s each and every month! If you’re serious about learning and trading, then come try it out. See: http://www.chartfreak.com/my-secrets/
~ALEX
Scroll to top


 Read More