You are here: Home1 / Premium
The markets didn't move in quantum leaps yesterday, but there was a little change in how we may want to view things. Lets discuss what stayed the same and what may have changed.
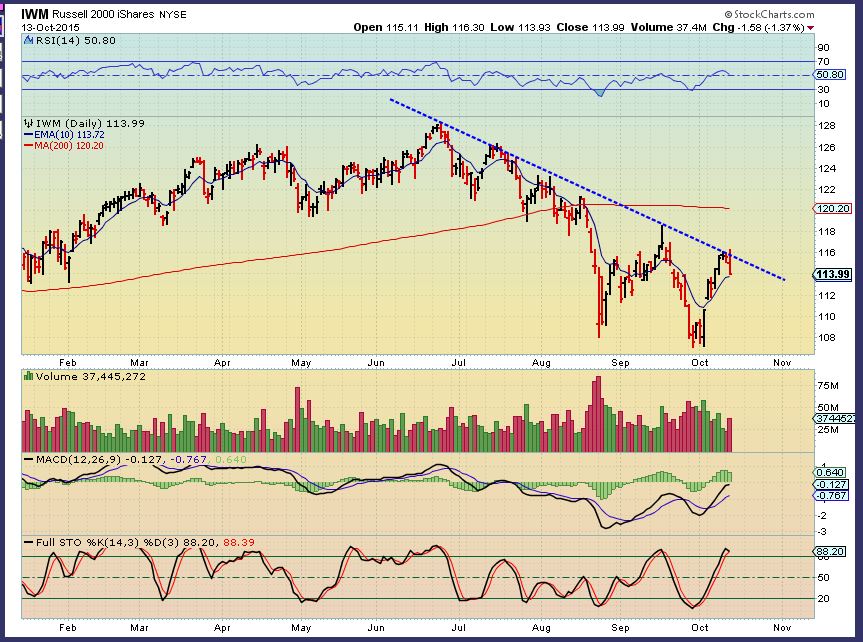
IWM - We saw a reversal at a point of resistance
 Read More
I was a little surprised to see the dollar down and also see the $CRB, $GDX, and $OIL down too. They've all had nice moves out of their lows, and now it looks like it may be the moment of truth. Time to see if it was just another bear market rally or could it be the start of something more?
WTIC - From the weekend report. I had been expecting the 200sma to offer resistance and a quick dip lower.
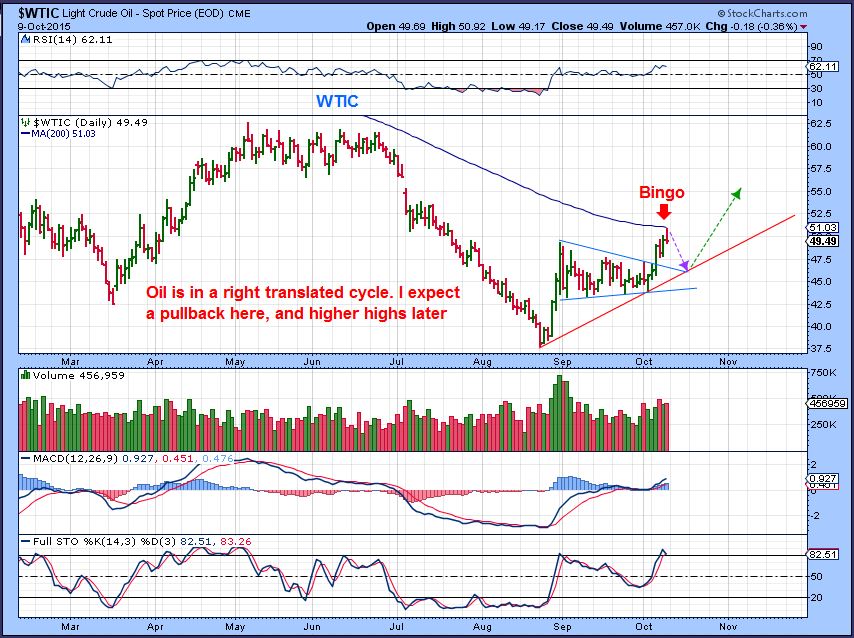
There are a couple of other factors in play that I am watching too at this point.
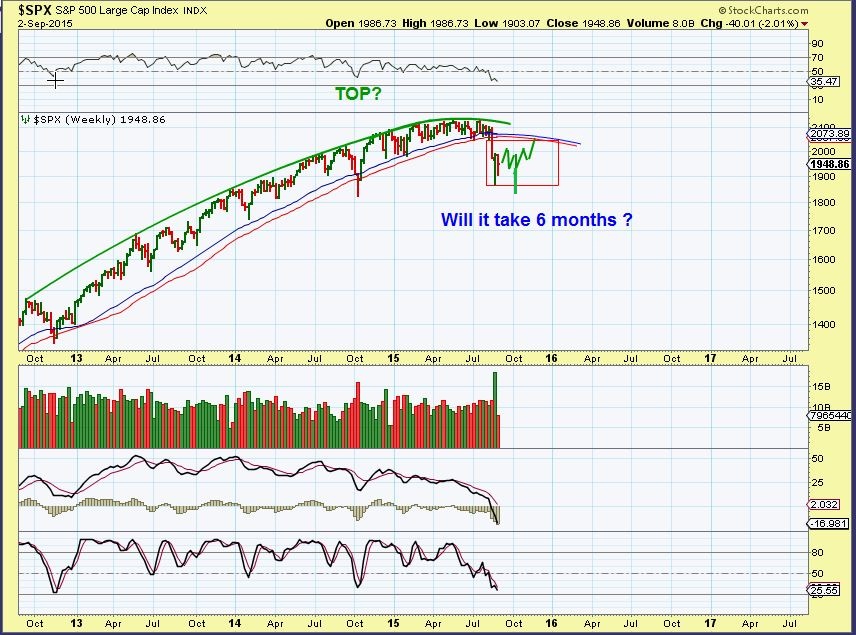
Read MoreEvery now and then I like to step back for the weekend report and take a look at the Big Picture. I have been reporting for months that I see big picture changes in many sectors starting to take shape. Lets see if they are advancing or falling apart.
The SPX is approaching resistance. Will it halt the rise, or possibly just give it a pause like we saw in 2011?
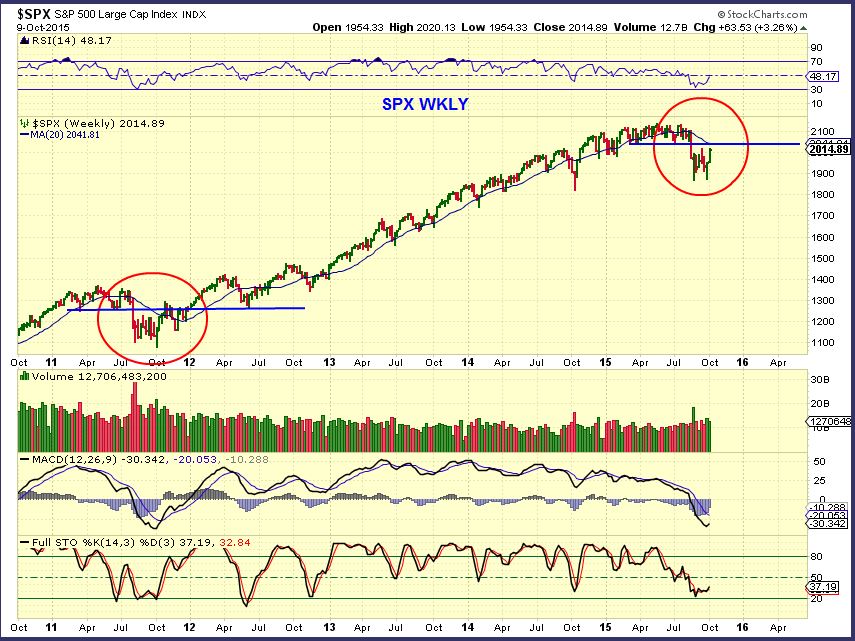
Lets look for some clues...
Read MoreThe saying , "What goes up must come down" is true within Bull and Bear markets. Lets take a look at what is going up and what is likely to come back down, keeping in mind that the FED MINUTES are to be released later today.
.
I drew this last week to show that I expected the SPX to move up to the purple line
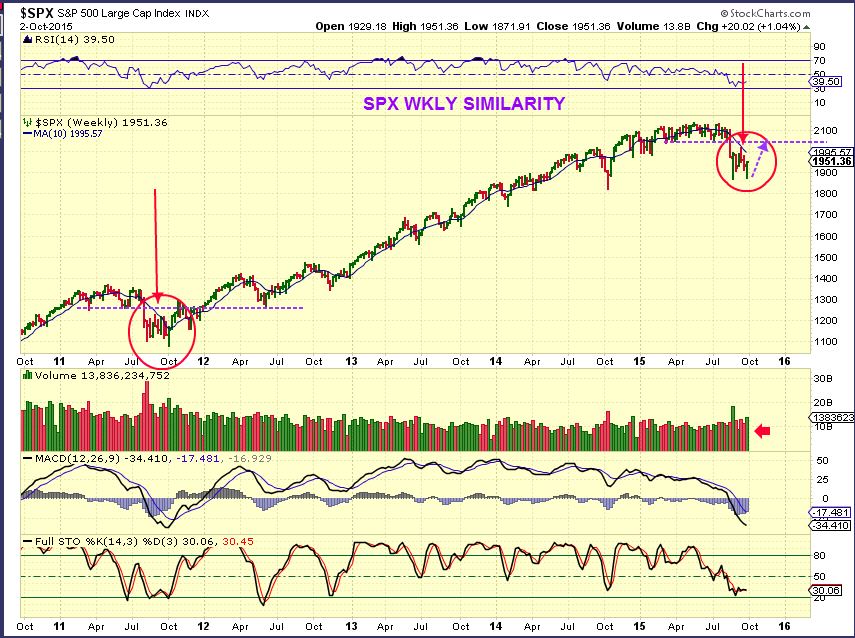 Read More
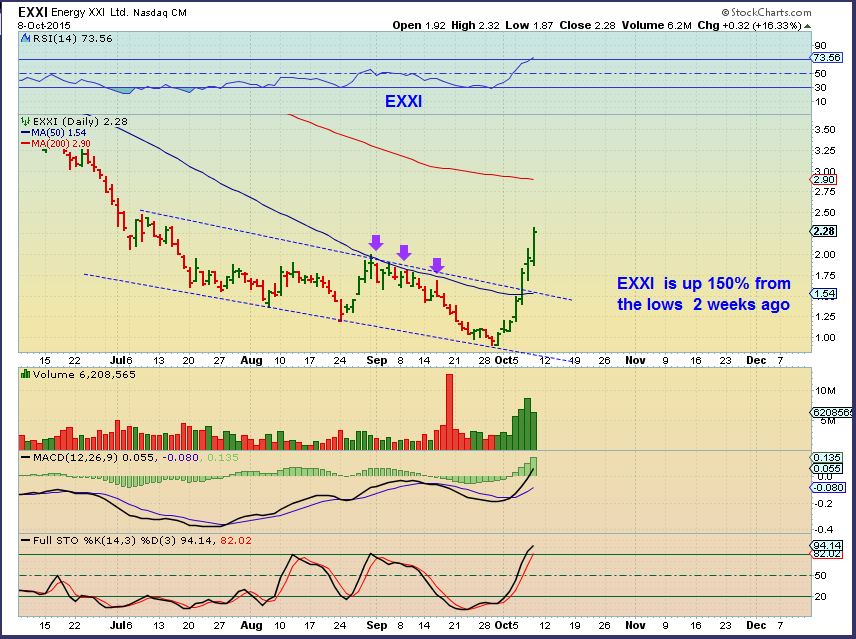
The Oil and Energy Stocks were leading the way with their recent bullish activity. As pointed out yesterday, the XLE broke out from a downtrend and was probably signaling that OIL was about to follow. Quite a few of the stocks were up 20 - 30% in 1 day yesterday! We'll discuss more about the potential here in a moment, but first lets review the rest of the market action.
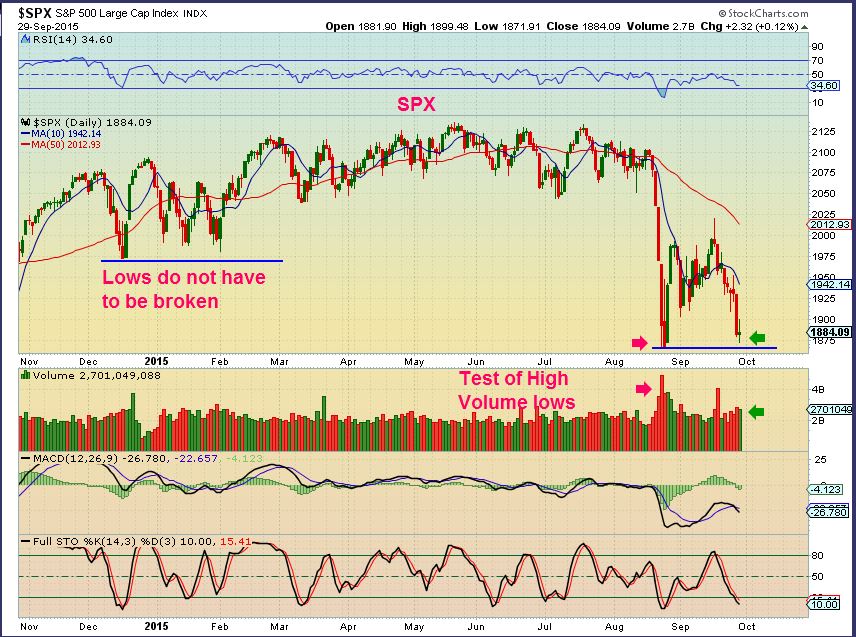
SPX- Resistance is overhead. A pause below the 50 sma may be building energy to break higher, and a break above could see buyers rush in and push it higher.
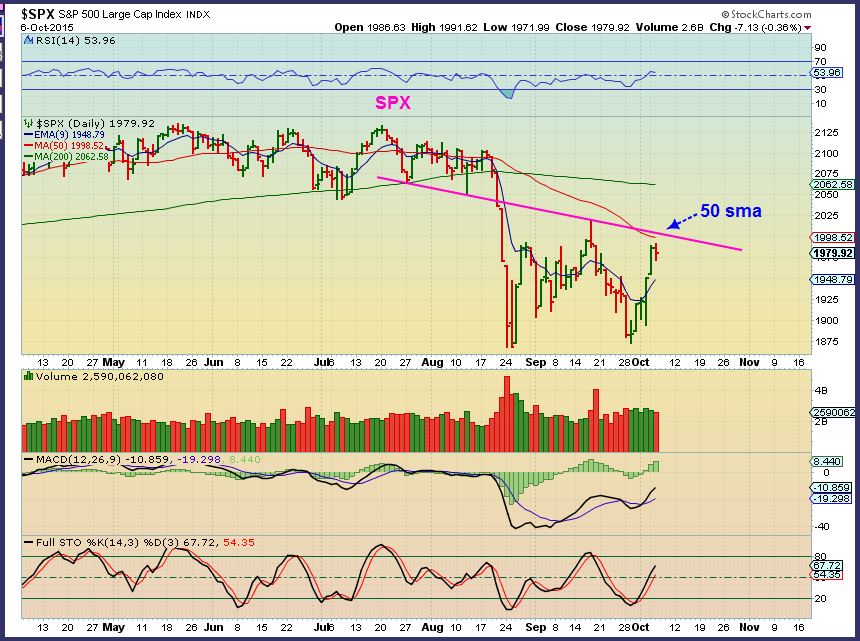
Why is it possible that this resistance wont hold it back?...
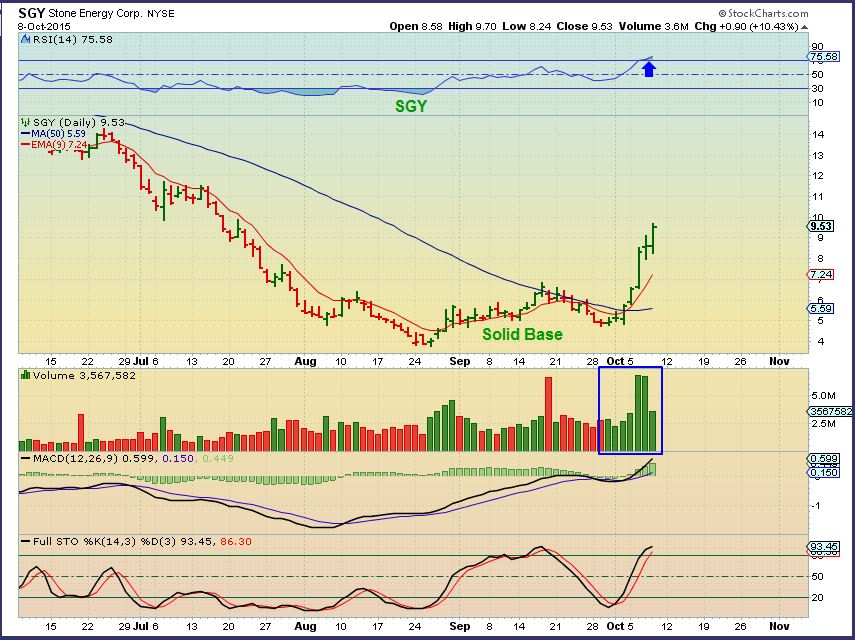
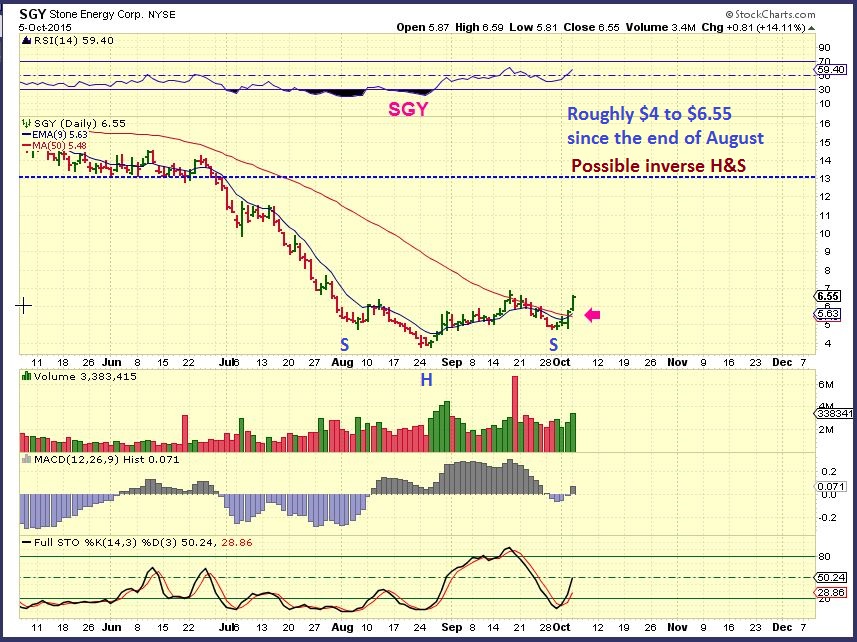
Read MoreYesterday we saw some of the Energy and Mining stocks running swiftly. There are some small bases that have formed in the past few weeks, and now they may be starting a small leg up. Some had Gains of 20 % in one day, which could just be a mix of short covering and a little buying, but they may still continue higher. We'll take a look at some individual stock set ups like the one below.
SGY - A break above the 50sma, we see a possible Inverse H&S forming.
 Read More
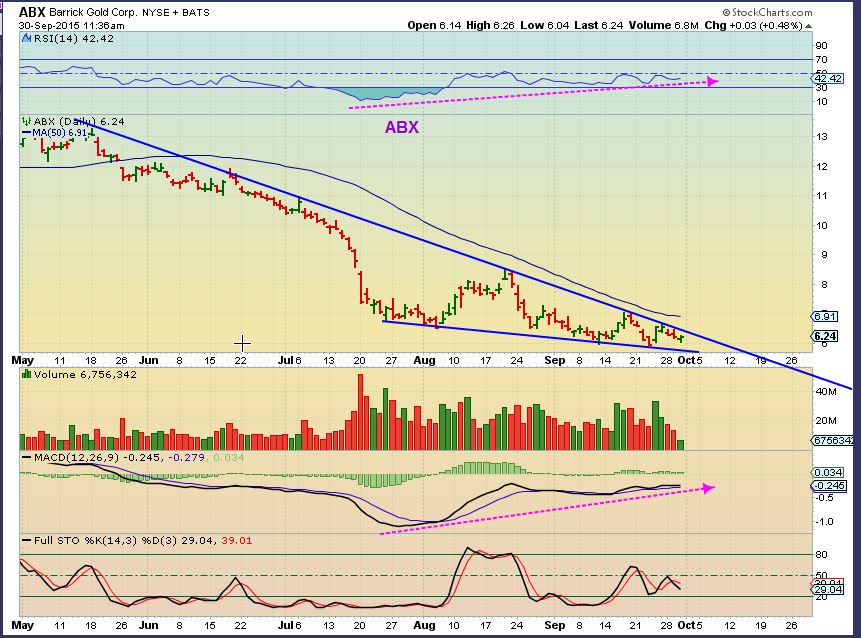
Part 2 of this mornings Gold report. I'll start with 2 charts that I pointed out recently in premium reports and in the public post yesterday, indicating some bullishness in the miners...
Sept 30 - GDX buy above the blue line and confirmation above the green dotted line . We are currently seeing that today ( we need to close that way)
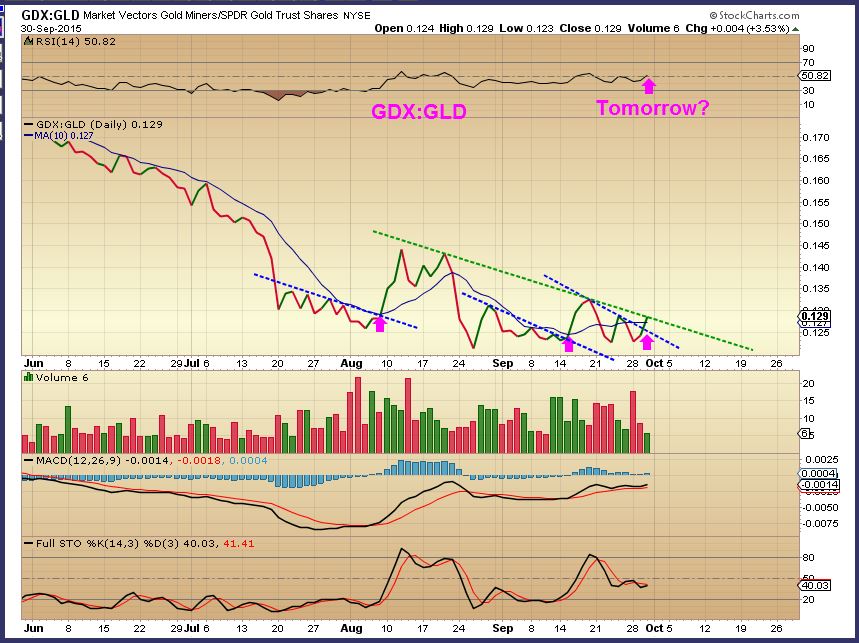
Why was this important? Using only Cycles, the volatile movement in Gold and the Miners was causing concern and looked ready to fail. While using some of the indicators that I have developed to monitor internals at the lows, I was still seeing bullishness in a number of ways and technical analysis was also leaning toward bullishness, as seen above. I dug a little deeper to try to reconcile the differences and came up with this...
Read MoreThis report will only cover Gold, Silver, and Miners
Read More
Scroll to top