You are here: Home1 / Premium
https://chartfreak.com/wp-content/uploads/sites/18/2015/11/bullishly.jpg
500
829
Alex - Chart Freak
https://www.chartfreak.com/wp-content/uploads/sites/18/2019/11/Chart-Freak-site-logo.png
Alex - Chart Freak2015-11-25 13:26:052015-11-25 13:26:05Bullish Changes This is a holiday week in the U.S., so I would expect that the markets may begin to slow down as the holiday approaches. Lets review what took place Monday. There actually were a couple of noteworthy occurrences since the weekend report.
Read MoreWith the release of the Fed Minutes Wednesday, we got a good amount of action in the markets this week. Lets review sector by sector.
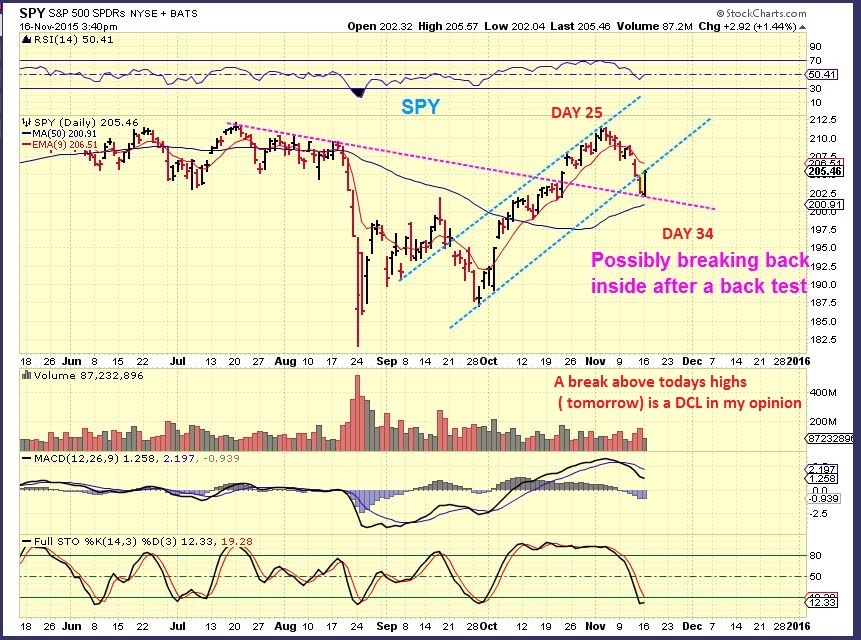
The SPY - On Nov 16, with a day 25 high in place, I expected a bullish break higher and a DCL to be put in place.
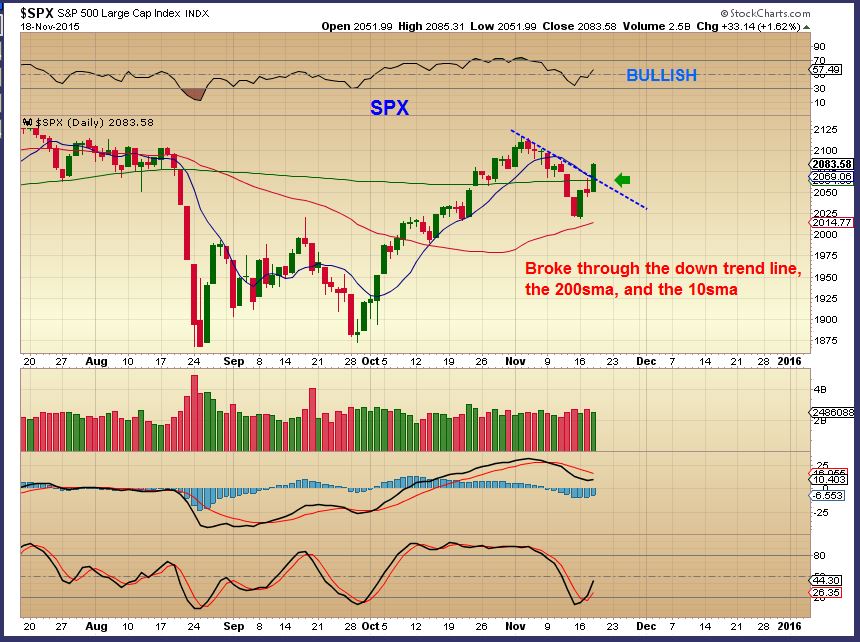
SPX Nov 18 - This was a bullish break out back above the 200sma.
That was follow through after the release of the fed minutes. What can we expect?
Read MoreFriday November 20, 2015
Read MoreThe picture started getting clearer in many sectors of the market after the Fed Minutes were released Wednesday afternoon. Lets take a look.
SPX / SPY - Looking for an overhead follow through and within the timing for a DCL. The 200sma acted as resistance.
Bullish Break through, I expect higher prices and will watch how the follow through plays out.
Read MoreWe saw GOLD break to new yearly lows yesterday and I read in several different places that people were going short for the drop to below $1000 (Again). We will discuss why I do not agree that this is the time to be going short. NATGAS remains interesting and OIL and Energy Stocks continue to have my attention too, so First lets look at a few other charts.
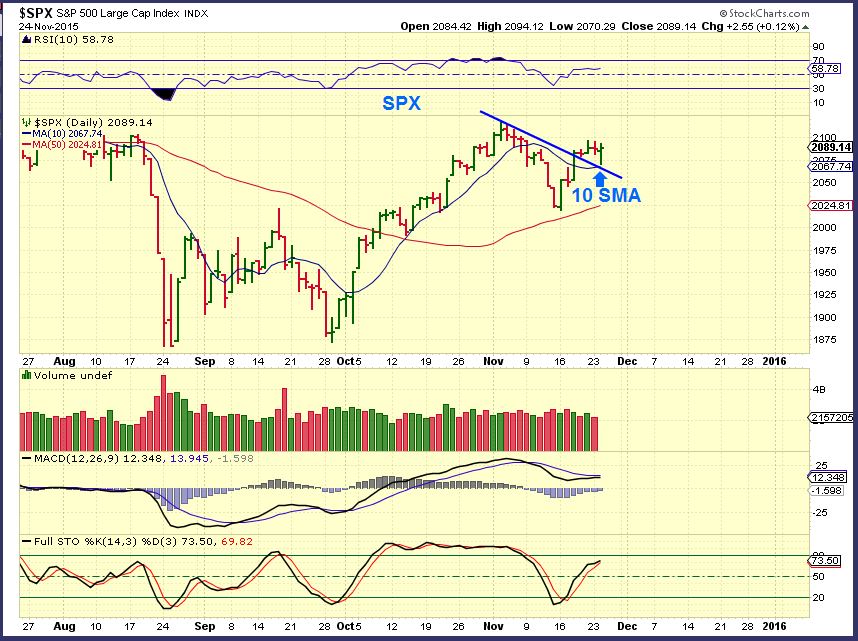
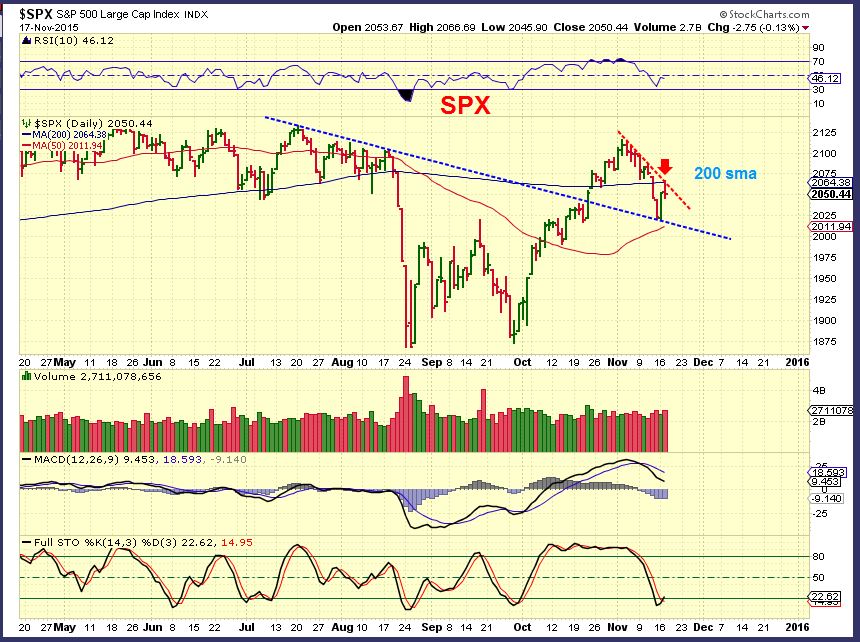
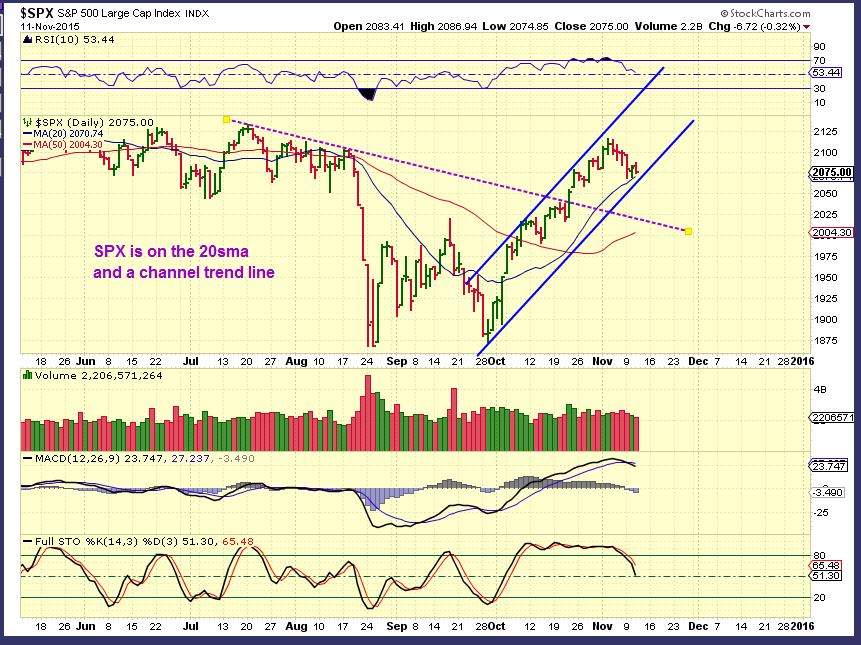
SPX - The markets stalled at the 200sma and a down trend line that I mentioned earlier. We could drop to the 50sma, but timing wise, we are due to go higher soon.This may be a pause before breaking above that 200sma.
The USD has been strong , but it may be due for a rest. Yesterday was a short term topping or reversal candle, but it is not a strongly reliable one. If the dollar is due for a rest, what might that do for the commodities that are now being heavily shorted?
Read MoreThe Markets always have that Ebb and Flow action where they pull back and push forward. We have been in the timing for some change as mentioned in the weekend report, and today we did get those winds of change blowing through. lets take a look...
In the weekend report the SPX chart pointed out possible turning points, seen here.
Here I am pointing out the action in the SPY, the day ended with 117 million. We are in the timing for a DCL (Daily Cycle Low, so I do believe that today was a DCL. If this pop drops ( to the 50sma?), I think support will hold. This is a buy with a stop below the 50 sma.
Read MoreThis week various sectors actually made some moves that could affect the short and longer term outlook. Lets dig right in and review what has happened.
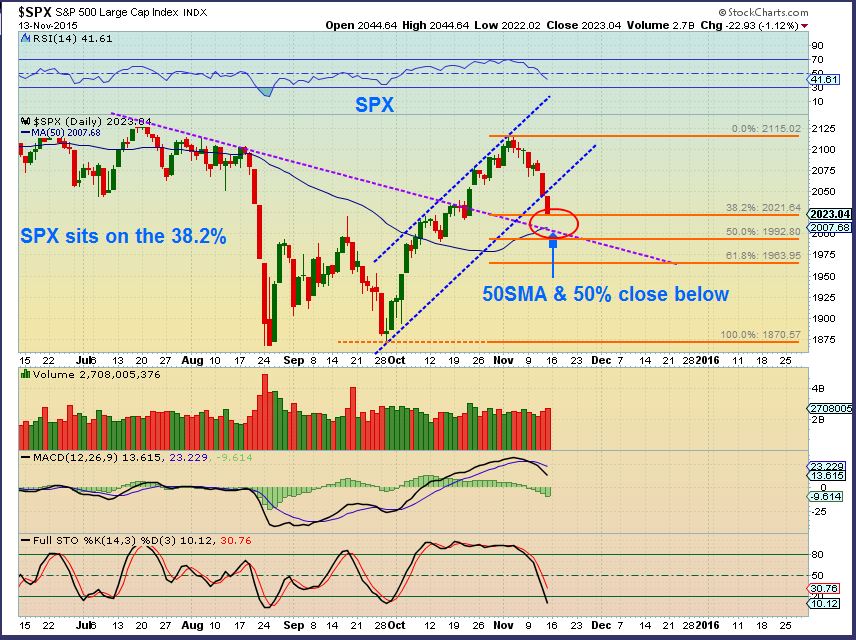
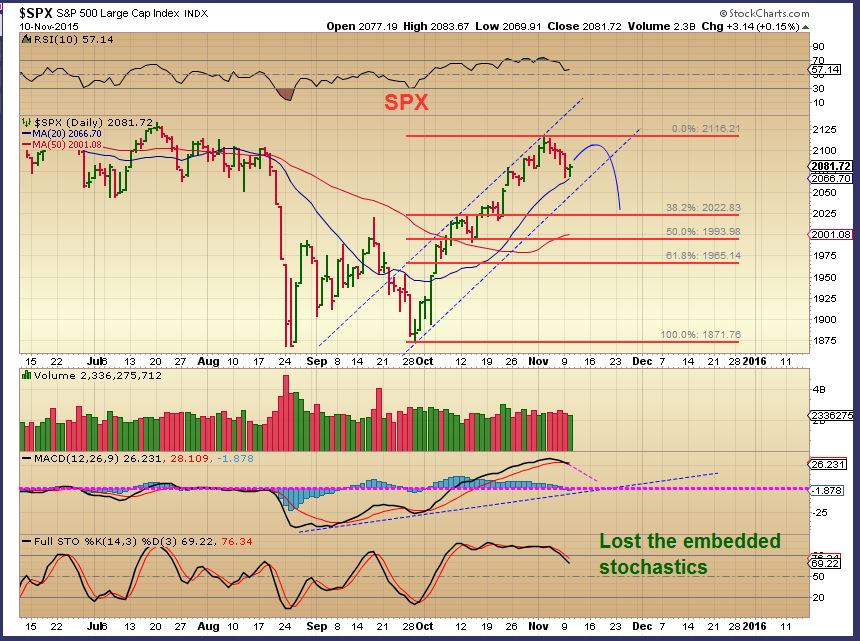
SPX - Expecting a pullback with resistance at former highs, this is wedge was posted and a possible channel could form.
SPX - The channel has been broken, but thats not bearish by itself yet. The SPX tagged the 38% retrace. We could even fall further this week to the purple dotted trend line for a back test. This is also the 50% retrace and the 50sma is there, so good support could be found just below current price. I do expect a bounce soon.
This is not bearish at this point, but let me show you something a little more concerning here...
Read MoreAs I begin writing this report, it looks like OIL may be ready to bounce here. I wanted to take this time to examine the evidence and discuss my recent expectations in the Oil markets.
WTIC - Nov 11 this was our picture of OIL. Please note the $42.58 . Oil was not acting the way that it should early in a 2nd daily cycle and the high volume selling was noteworthy.
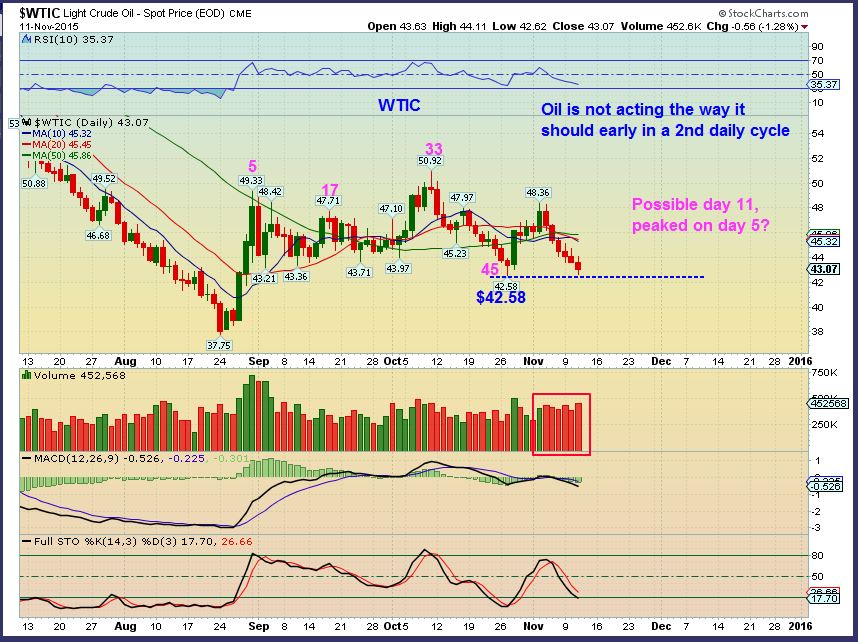
Now lets take a closer look on Nov 12 and discuss the implications.
Read MoreI wanted to discuss OIL a little later in this report this morning, since it is acting a little weaker than expected. We'll start with our market review.
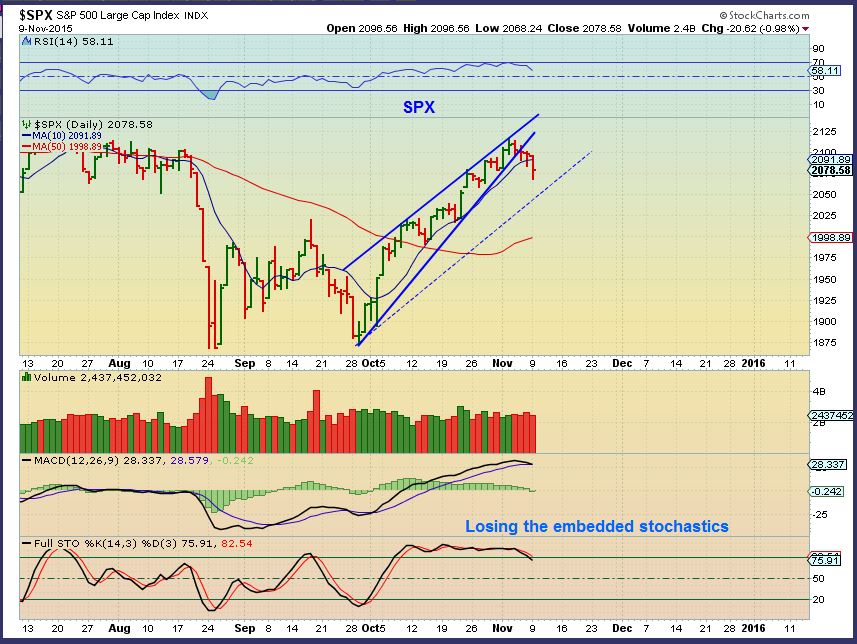
We expected a small pull back in the markets, and this chart showed where the Fib #'s would be. There was also a channel included.
We have reached that lower channel line and the 20sma. That could act as support, but the above chart also has the 38% Fib # at 2022 and we also see the 50sma and the purple break out in that area. That means the selling may not be over yet.
 Read More
Scroll to top