You are here: Home1 / Public Blog I AM OPENING UP THE WEEKEND REPORT TO THE PUBLIC. IT IS A LONG REPORT, SO IT WILL TAKE SOME TIME TO READ, BUT I HIGHLY RECOMMEND IT. IT IS A BIGGER BIG PICTURE VIEW. ENJOY & THANKS FOR CHECKING IT OUT!
This weekends report is going to be a bit different. I often give the Big Picture review, and with that, we have been discussing since last January the possibility of a Blow Off Top / Parabolic move resulting from the general markets' bullishness. Well, this is going to be an even Bigger Picture discussion, with a number of different Markets discussed. It is a long detailed report designed to answer many emails that I have received about the bigger big picture , so grab some coffee or tea and let's begin...
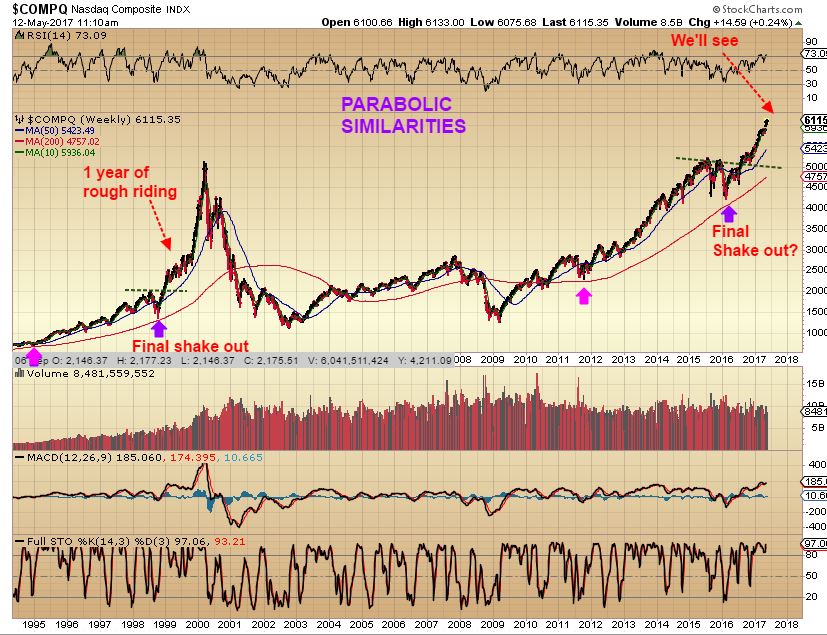
NASDAQ - This chart was from last May. I posted this idea of how the current rally that we were seeing could be becoming parabolic. Parabolic moves seem like they will never end, and you'll hear that "Nothing can kill this market", and it feels so true. Then suddenly, they die a brilliant death as you can see in the year 2000. See the chart below, where we examined similarities of a final shake out consolidation, a ramp up with somewhat choppy trading that would still having higher lows, higher highs, and then the final Ramp higher...
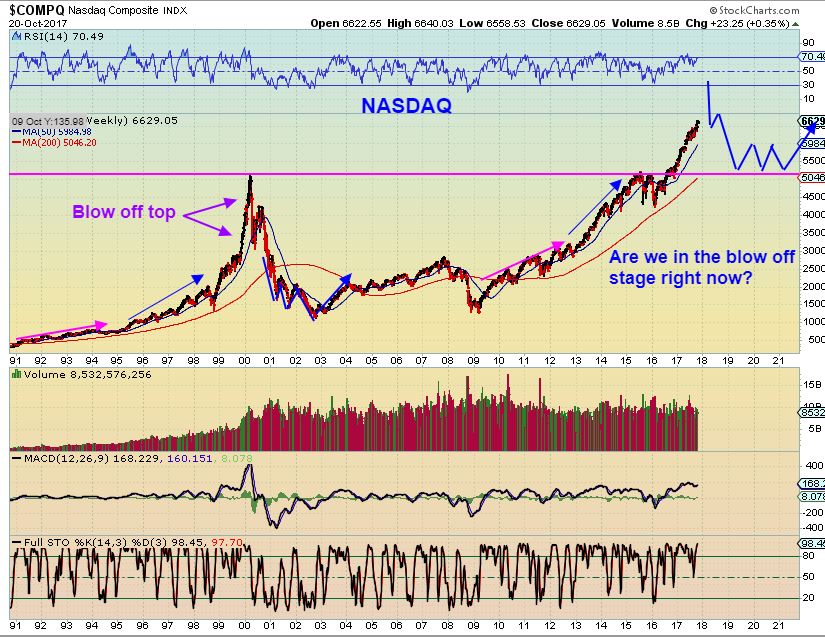
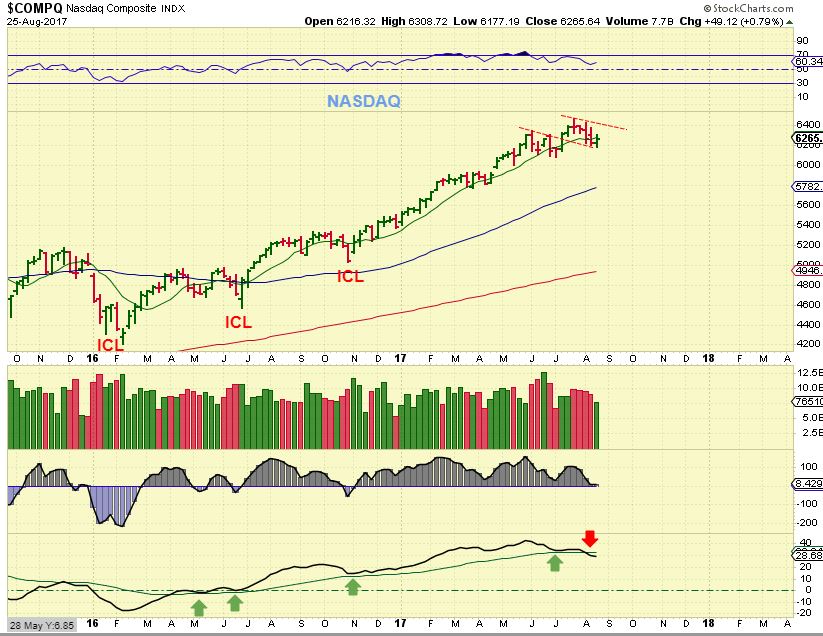
NASDAQ - Here we are now and the choppiness with higher lows and higher highs seems to be playing out now, and a blow off top would follow. OR, is this the blow off top in play as it just continues higher? This move is verticle and could lead to the blow off top. Just ride it long. I have drawn in a post blow off top scenario with a normal 'back test' of the break out. Let's dig in further...
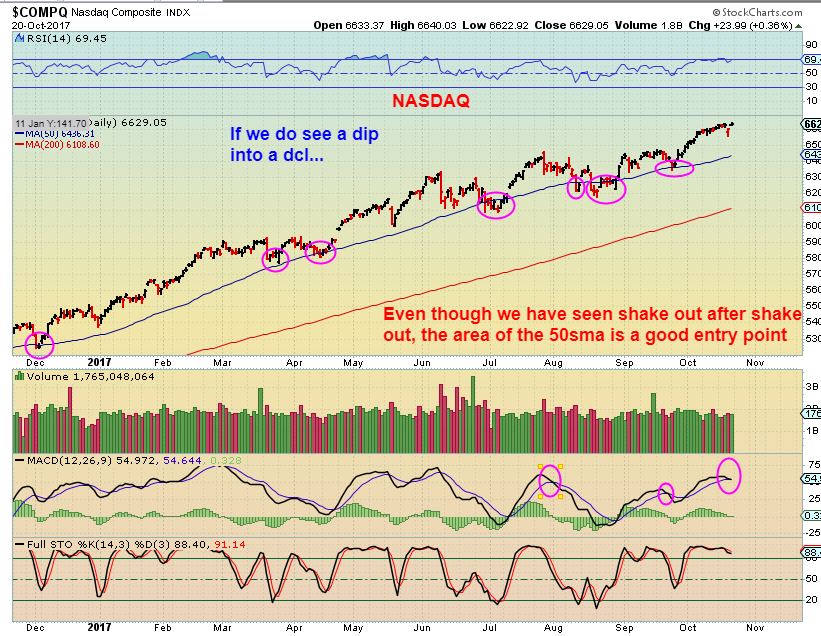
NASDAQ - Currently, the 'choppiness', when examined close up, is normal. I have advised buying with a reasonable trailing stop. Each dip to the 50sma can be bought as a low risk entry. Was that tiny dip the DCL, because we are so late into this current daily cycle? I'll show you why that could be possible later using the RUT AND TRANNIES. If it isn't a dcl, and we get a dip to the 50sma (even with a shake out there), that would obviously be a 'buy'- please read the chart. THis is a healthy strong bull run.
Now let's also look at the BIGGER PICTURE SPX, RUT, TRAN, DJIA
Read MoreI wanted to open up a slightly shortened version of this weekends report to the public. In the weekend report, I usually cover the action that we saw in all of the Sectors that we have been covering lately, and in the daily reports, these are updated and stock picks are also added, if the set ups present themselves. So even though the premium members will have a lot of additional information as things upfold, the Public should be able to get a solid idea of what we have been looking for, and how it has all been playing out. Enjoy this weekends report.
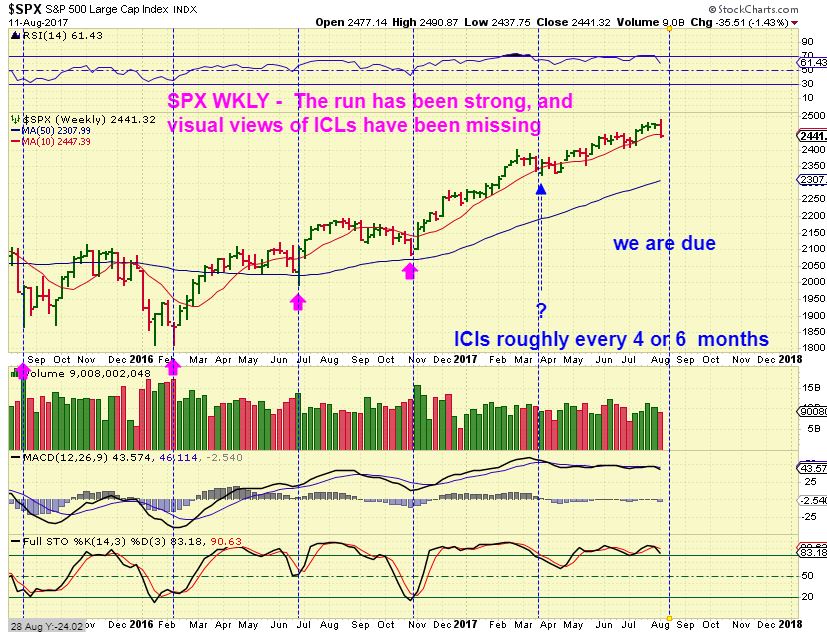
SPX- I will repeat, I never called the recent dip an ICL. It lacks the characteristics of one, but what I did say is that we have been overdue for one for a while. So we have a dcl, and similar to the last couple of dcls, the move higher has been a bit choppy, but we have higher lows and higher highs, so an uptrend continues.
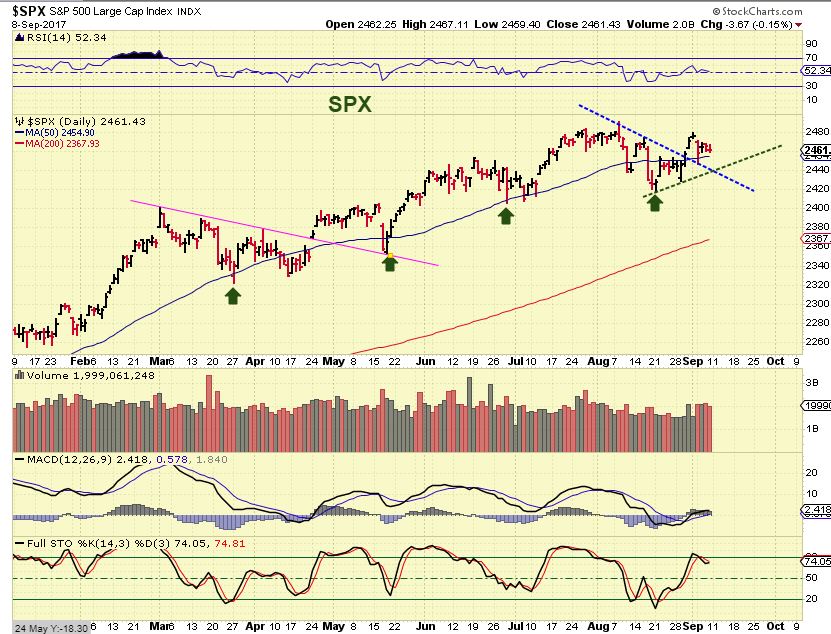
SPX - In August I reminded readers that we were due for an ICL, but visually, I still do not clearly see one.
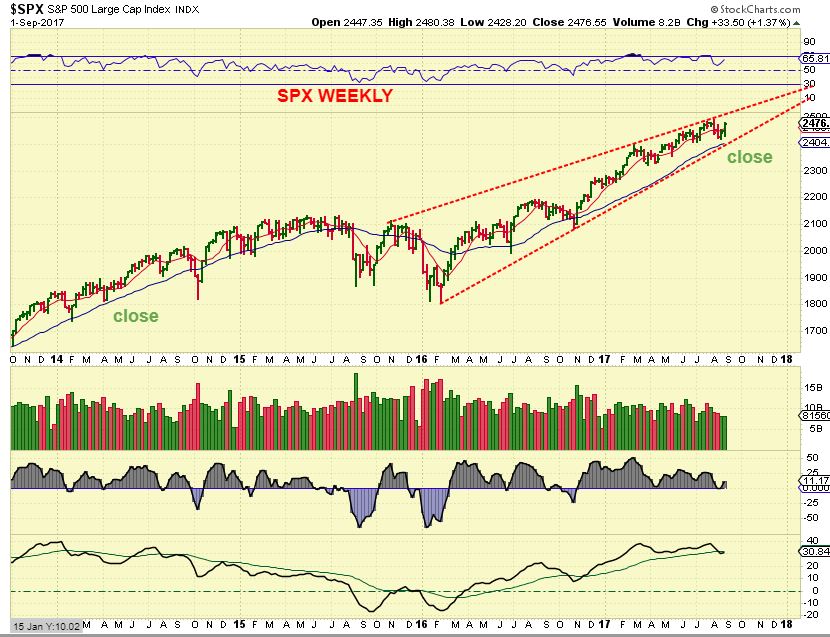
SPX - Then on Sept 1st, I posted this as a cautionary note for the future - a possible rising wedge and mentioned that OCTOBER can be tough for the markets, historically speaking. We have seen some pretty big crashes in October. Will we get the ICL then? We'll have to be alert going forward to any signs of weakness as this unfolds. So some are long from the recent dcl, I am just helping my readers to see a reason to stay alert, and I will monitor it along the way.
 Read More
Were you prepared for this action today? At chartfreak, we have been selectively buying Miners and other commodity stocks for weeks, and discussing the bullishness in this sector, despite many articles expressing concern over it.
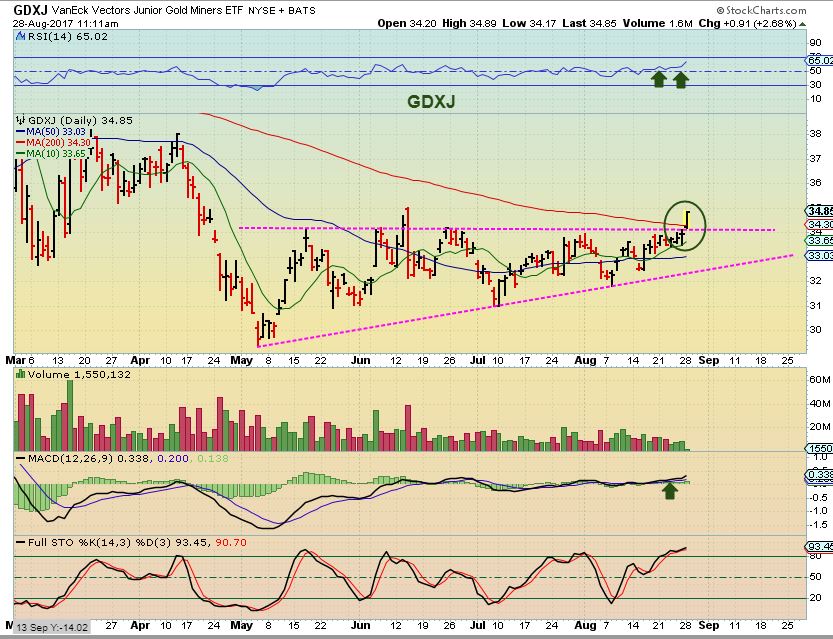
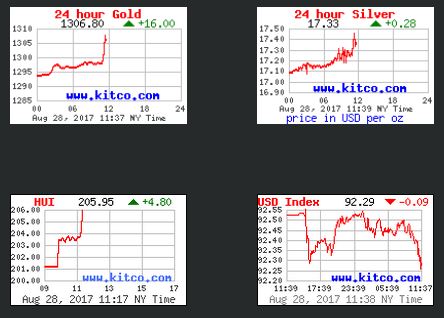
I'm opening up the weekend report, because we have been expecting this break out in Gold for weeks now. I have been posting various Miners chart set ups to show which ones were good low risk buys over the past few weeks, and my reports have been very focused on the bullish side of GOLD, SILVER , & The Miners. In addition to that, We also have been buying and trading commodity stocks like HBM, IPI, TGB, X, FCX, etc over the summer, and pretty much avoiding the General Markets as they topped out and consolidated for a bit. I was able to call THE lows in Oil in July, but the Energy sector using XLE & OIH was tricky, so I didn't enter a trade there. Set ups kept breaking down and even though the XLE did break out in late July and looked promising, it lacked strength and follow through after that break out . This was this weekends report is posted below in it's entirety, and follows up on all of those areas. IF you think that all the prior daily reports directing you to the Commodity stocks and Miners may have helped you with your trading, why not sign up for a month and try it out now? I will be closely watching this sector after todays break out. Enjoy!
NASDAQ -We still haven't dropped into our ICL, but you can see that the NASDAQ has basically gone sideways all summer. Price is where it was in May. Is this reversal ready to move price higher out of this consolidation?
Well, we are within the timing for a DCL on the daily charts, but look at that lower indicator on the above NASDAQ chart. This sideways move has internal weakness, so the next daily cycle could roll over too, if you buy the reversal here, use a stop.
Read More
Scroll to top