Can We Go Shopping?
A quick look at the markets and a brief discussion on shopping
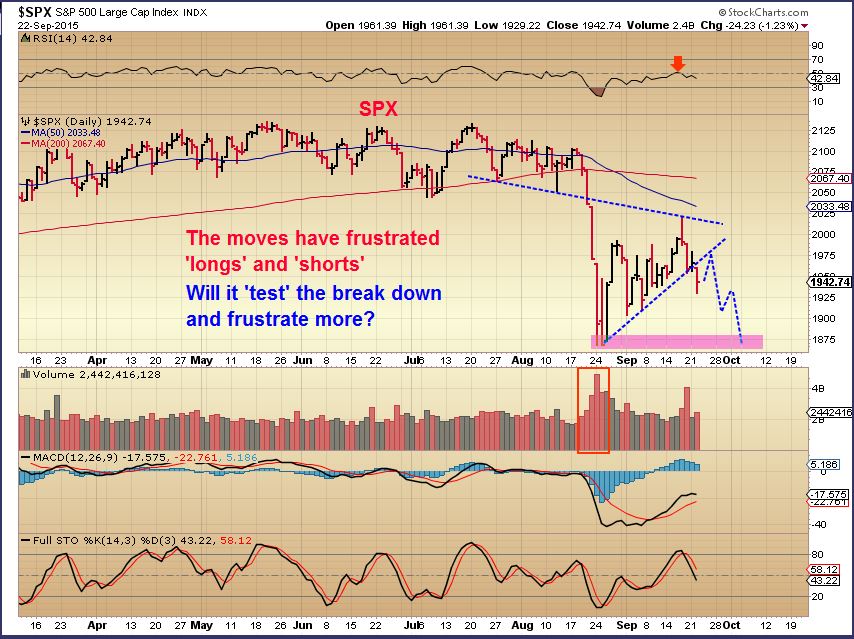
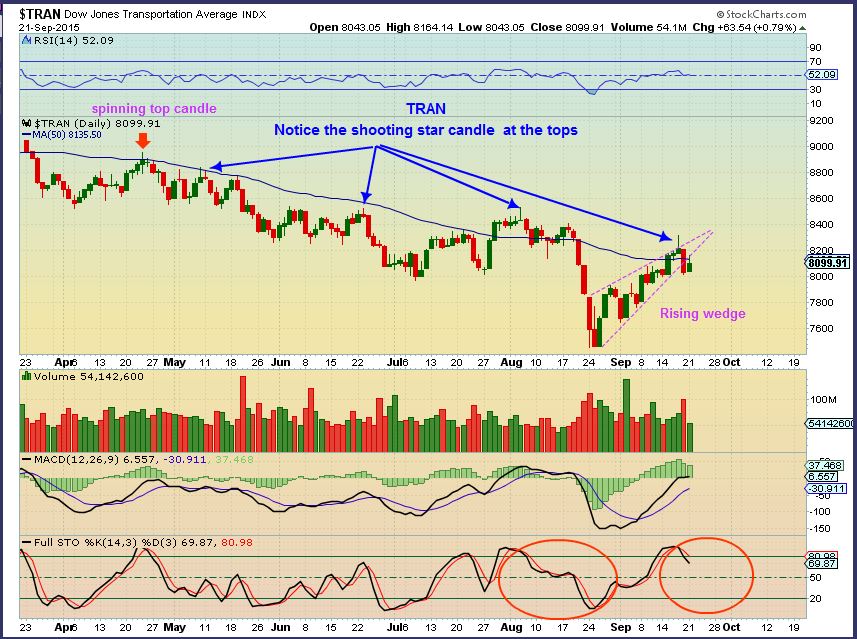
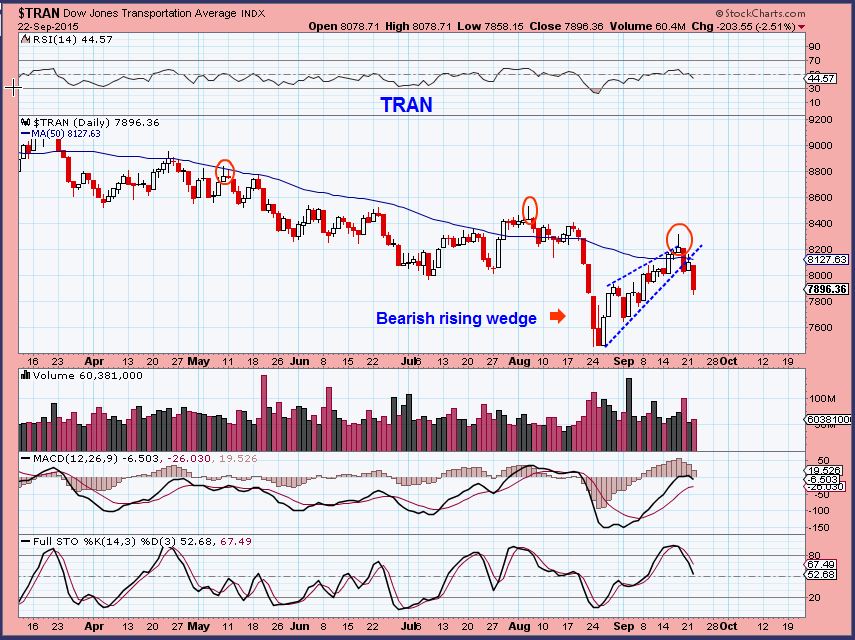
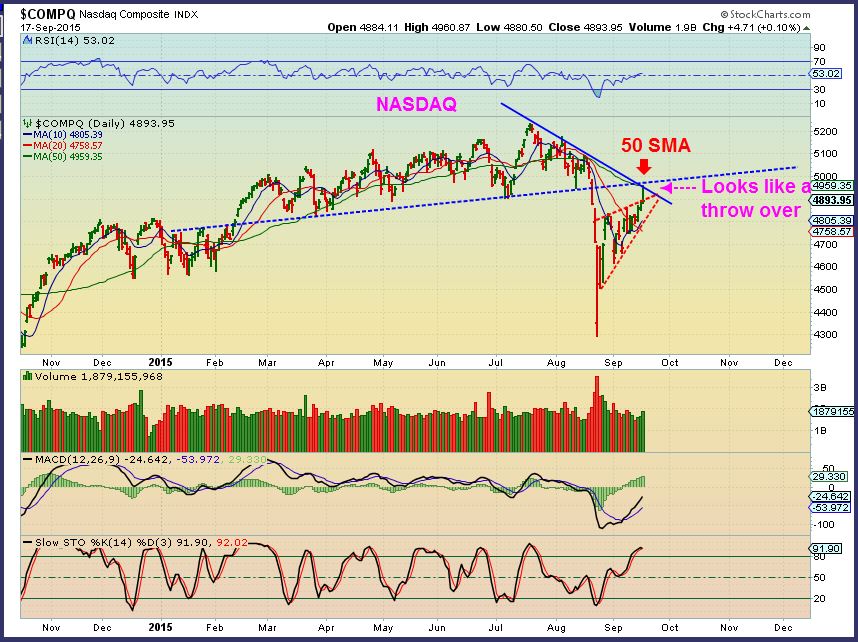
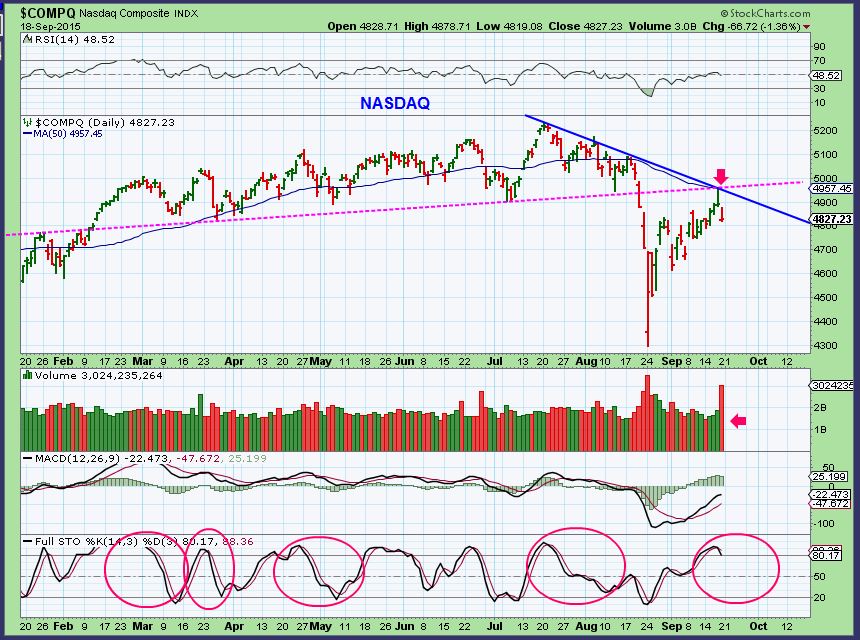
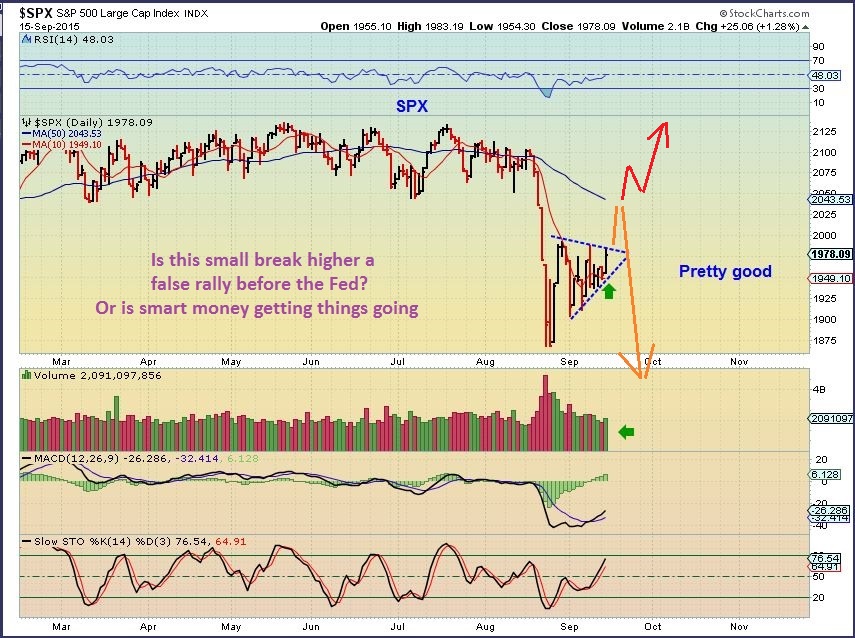
On Sept 22 - I said that I was looking for a possible 'Test' of the break down and then a drop.
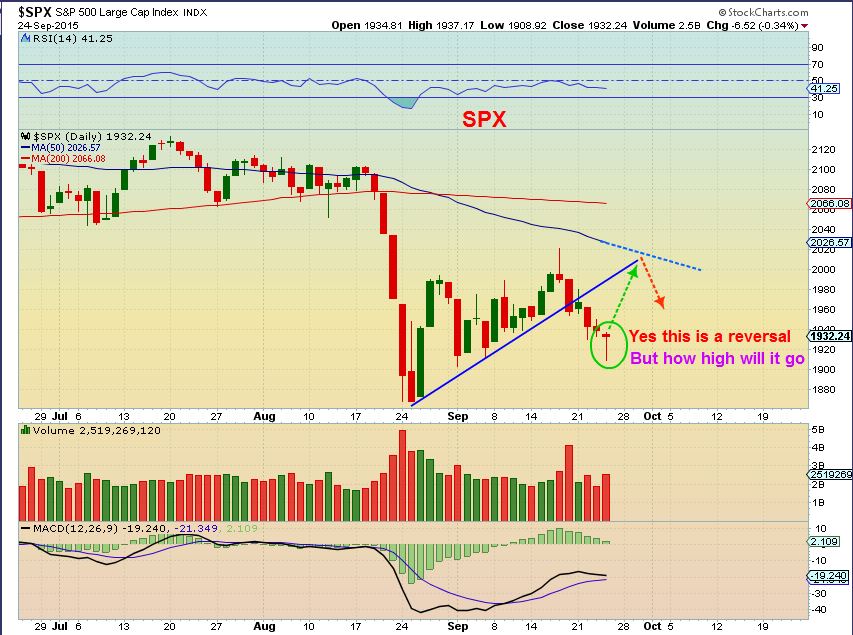
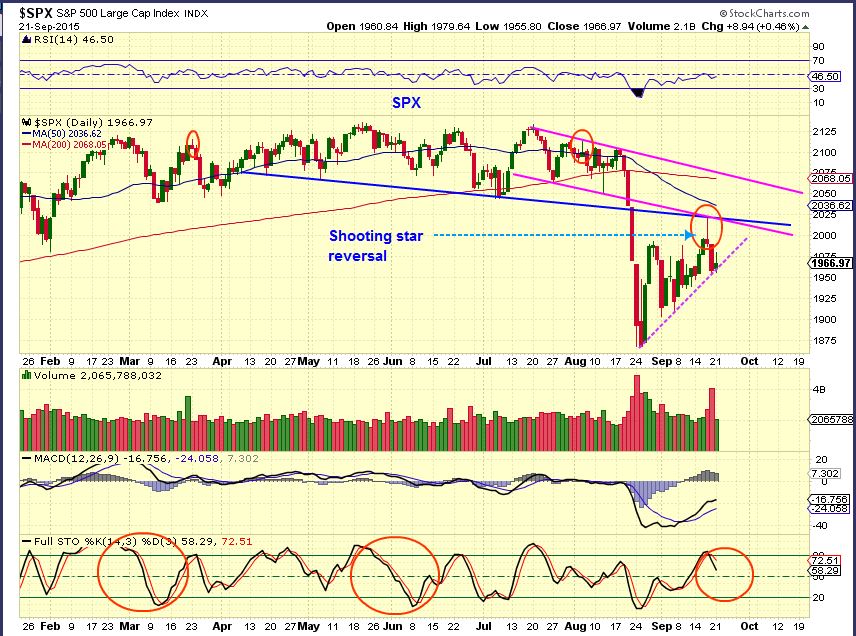
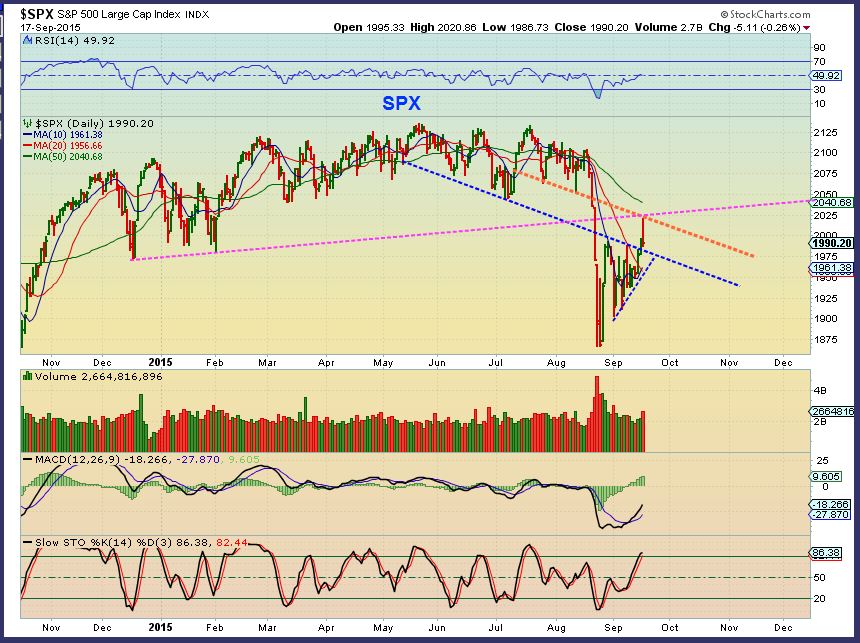
SPX - Reversal candle. Maybe that 'Test' comes now.
Yes, Gold is jumping, but we’ve seen that before, right? The question is , ” Will it make it to it’s intended target, or land flat and flounder around like a (gold) Fish out of water?” Here at Chartfreak, we have been waiting for this next leg higher. Lets review some of the charts […]
.