I want to show you how I follow individual stocks over the course of a month. In this post, I’ll show you how I have been covering NBEV.
[The following is a sample of Alex’s work over the past few weeks]
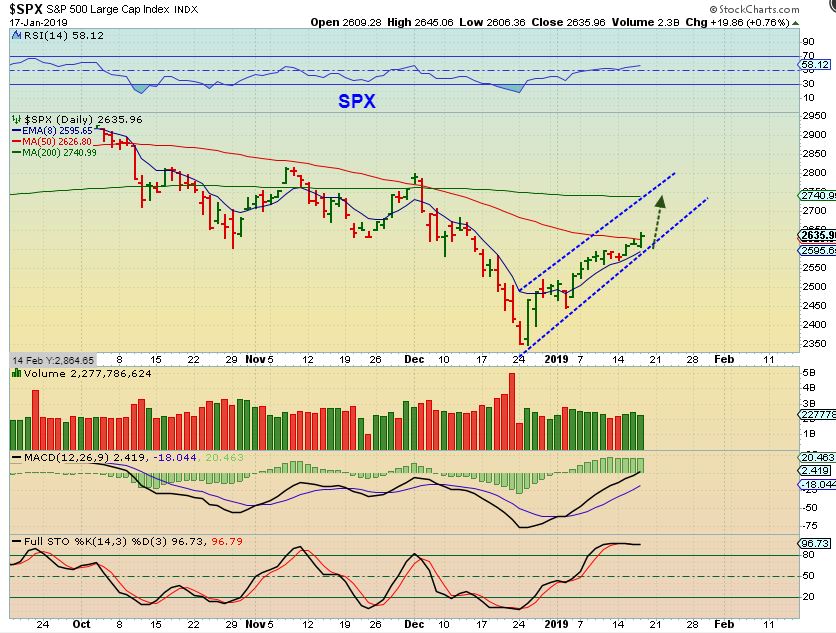
(1/10/19)
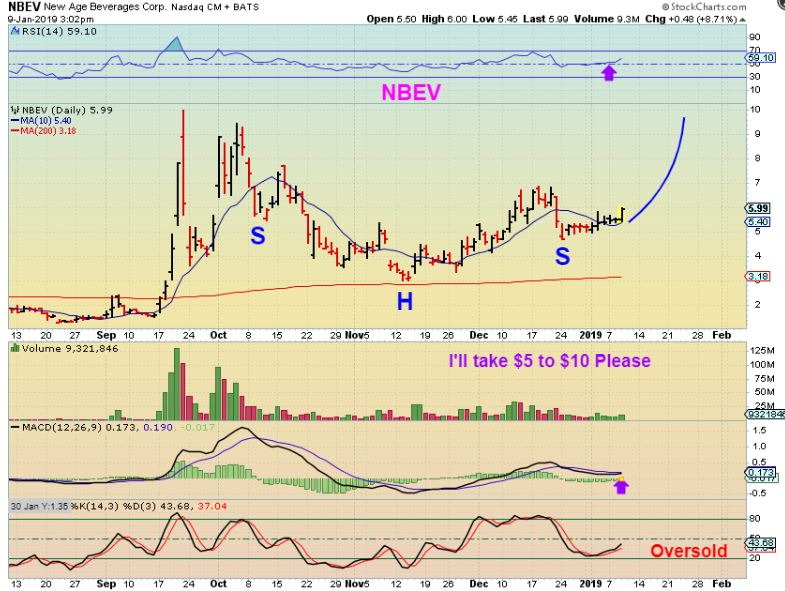
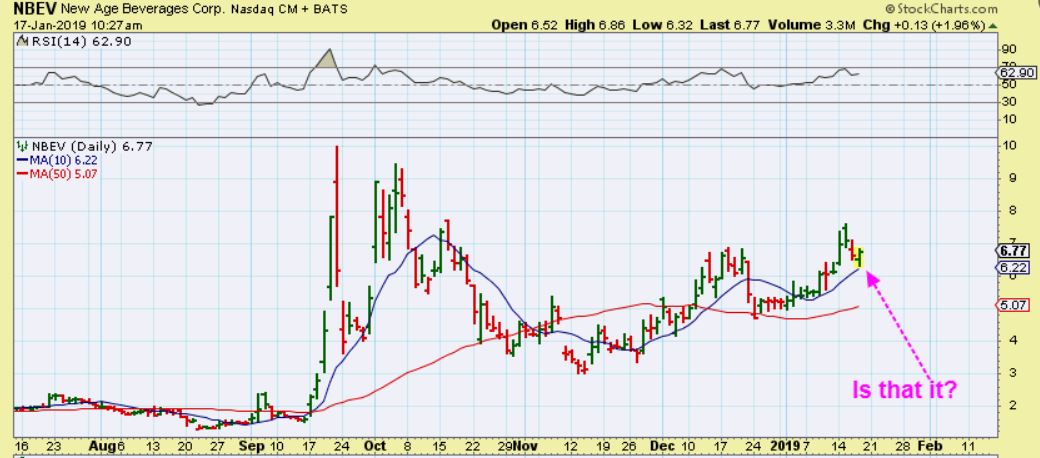
NBEV DECEMBER 21 – Back on Dec 21, NBEB broke down through an uptrend and notice that it was Overbought . I mentioned that it is possible that the 50sma would support it, it could go sideways, and form an INVERSE H&S as drawn here. If so I would re-buy it, because this too ran swiftly. Well guess what?
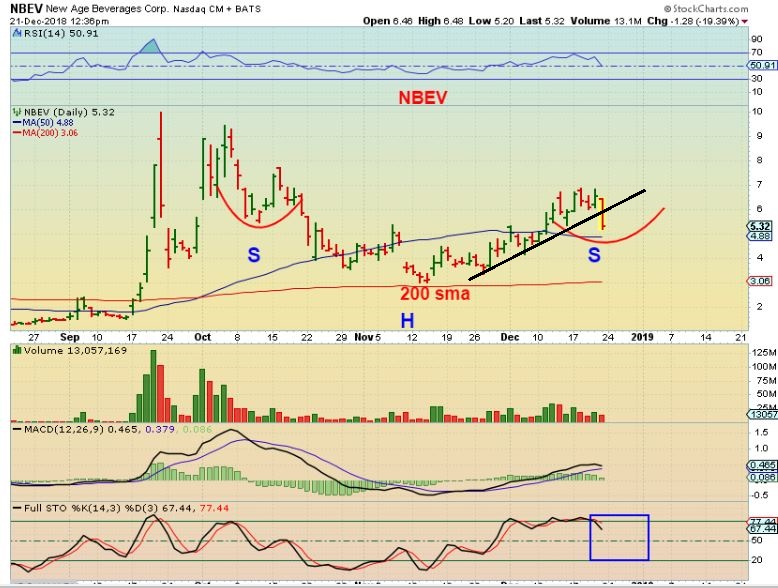
NBEV – no longer overbought, it is oversold and did form an inverse H&S, so I have been watching it daily as it rode along the 10 sma, and …
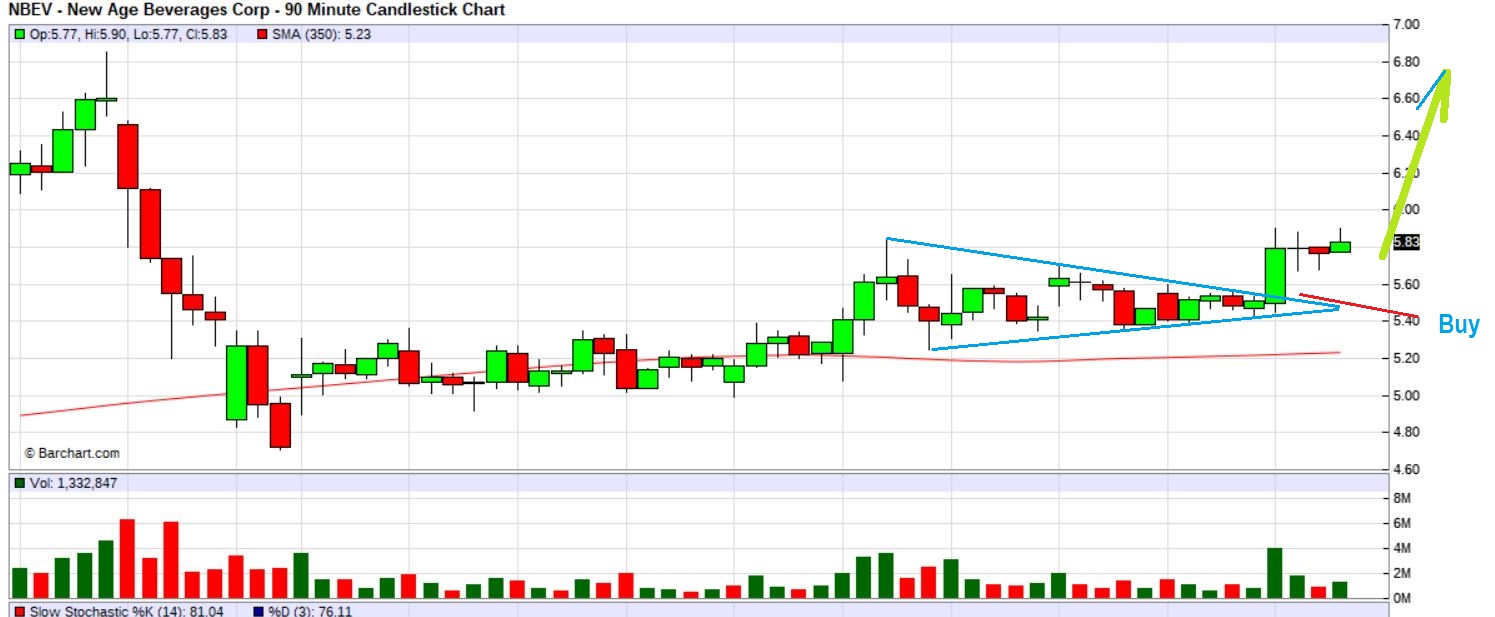
NBEV – INTRADAY I watched a triangle form along a support line . It was at he APEX at the open yesterday and as it broke out I jumped in. I posted this to show that I would also like to ‘add’ on a possible back test, but…
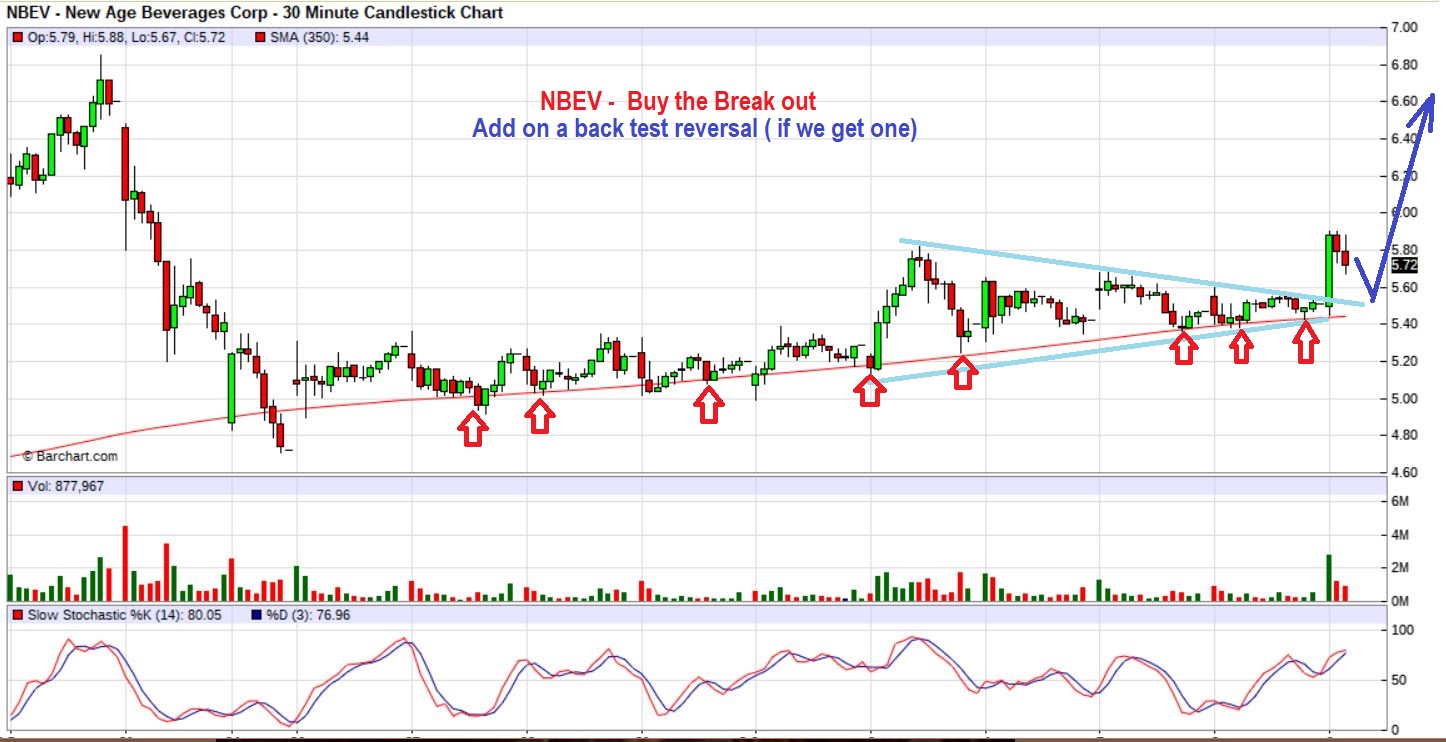
NBEV – It flagged sideways by midday, so I just ‘added’ again and mentioned it in the comments. This too then broke even higher…
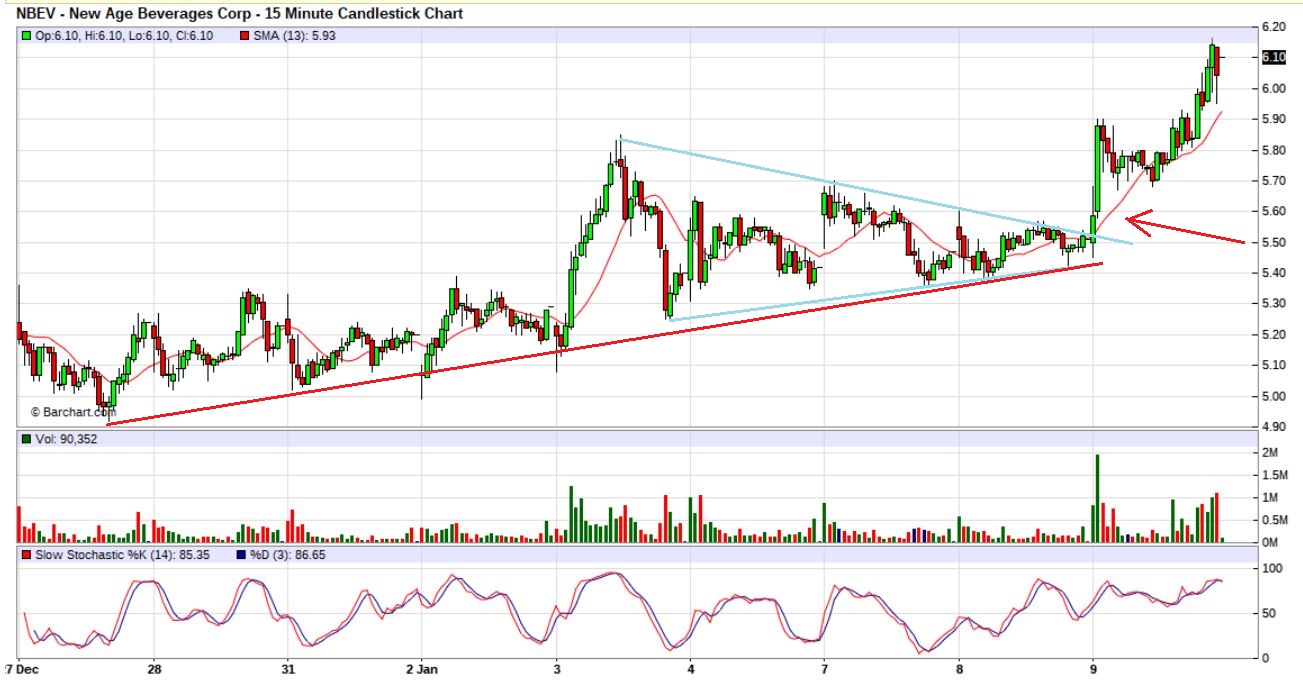
Finally, By the end of the day NBEV had run up 11% and closed at $6.10. The sector is acting correctly.
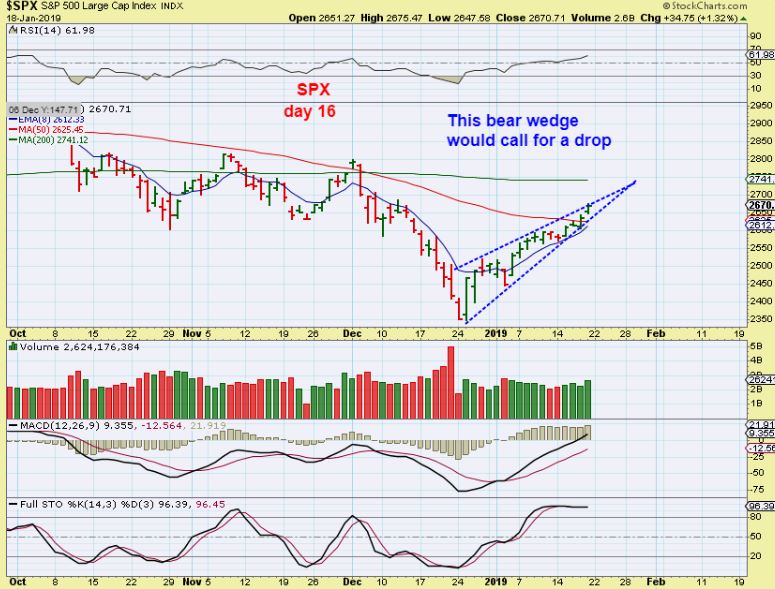
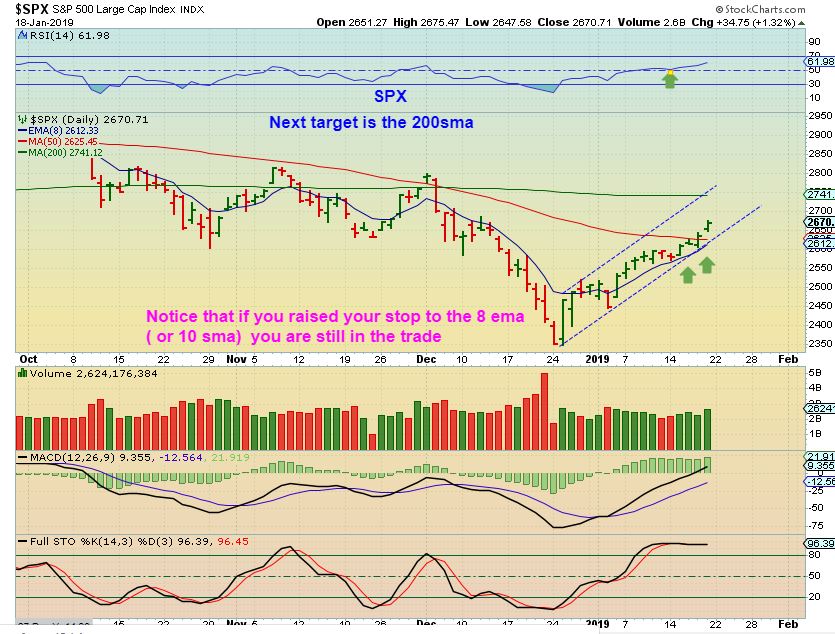
(1/18/19)
NBEV – I posted this in the morning, and NBEV traded all over the place yesterday. THIS may be support that now holds going forward, I will look for follow through. I own NBEV.
(1/24/19)
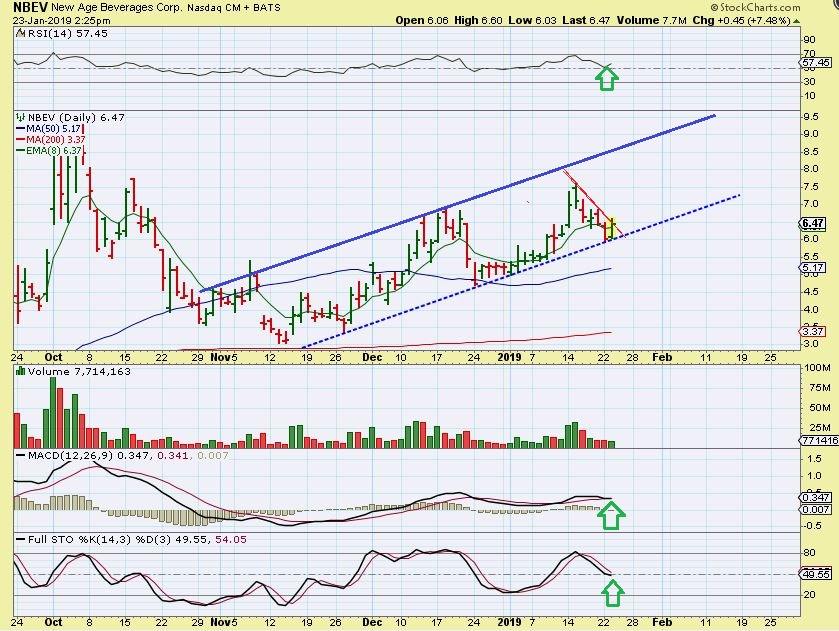
NBEV Daily – New Age Beverage has entered the CBD infused Beverage business, and has been drawing in buyers, but it DOES move quickly in both directions. The daily chart of NBEV seems to have price climbing along a trend line or channel rather nicely, so this would be a good place to add or even start a trade. We got a nice reversal Wednesday, and I would expect that it continues higher from here. If it breaks above the RED TREND LINE Thursday, that is bullish. Let’s look at the weekly.
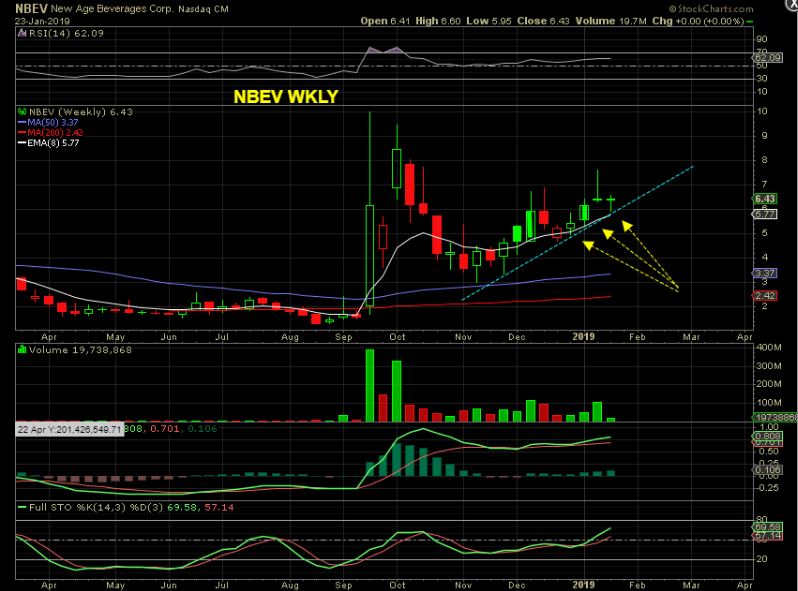
NBEV WEEKLY – We have a weekly reversal off of the weekly 8 ema and that uptrend line too. You could put a stop under the weekly low, which is about $5.90.
As a bonus, the $MJ etf from 1/25/19
MJ ETF – As mentioned in prior reports, I expect a second leg higher here soon. Crawling along the 200sma is bullish and can be bought with a stop ( loose) .
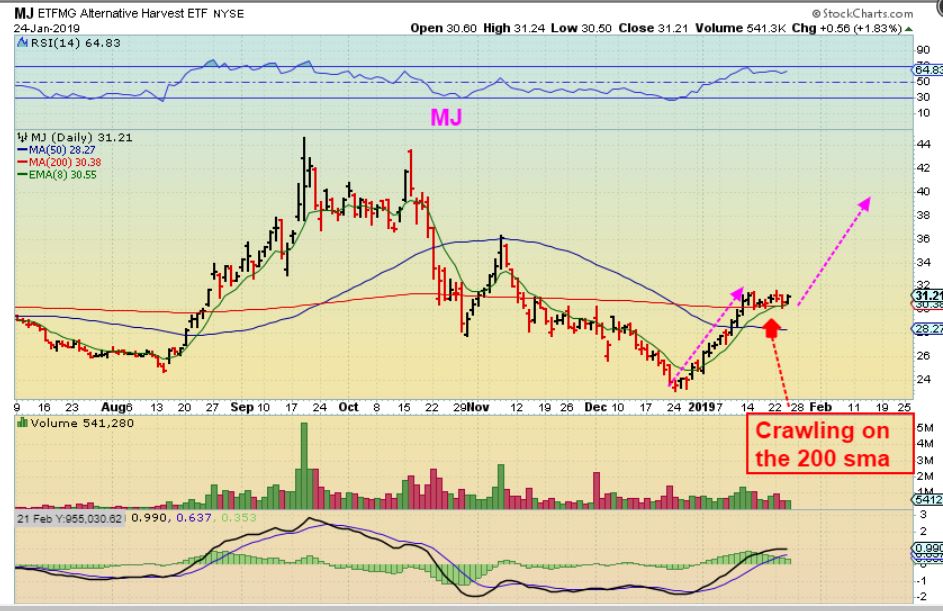
Chart Freak Membership
Alex has been successfully writing a daily newsletter service for nearly four years now and is considered one of the best traders of precious metals miners, energy/uranium stocks, and biotechs. This is your opportunity to join his service as a member and follow along as we enter the next bullish gold Cycle higher.
If you would like to find out more about the service or sign up, please click the buy option for more details.


 Read More