Friday Jan 18 – Options Expiration

Today is Friday, the last trading day of the week.   It is also "Options Expiration,' and that can affect pricing and volumes a bit, but so far things continue to play out pretty much as expected,  so lets just get into our Friday report...

. Read More

Jan 17th – Thursday Markets Await


SPX - We still have a wedge that has formed. These usually break down, so with the SPX at the 50sma and a wedge, I would think that we may pull back for a few days.


That could be a 1/2 cycle low and it is not uncommon...

Read More

WEDNESDAY – Bouncing Along


SPX 1 of 3  -  After the pause that we expected under the 50sma, the equity markets actually look ready to break higher already, so


I want to show you these 2 charts ...

Read More

Tuesday Jan 15th – No Big Changes

Monday s market action did not change the expectations mentioned in the  weekend Big Picture Review,  but the trading has been very good and most of the recent buy opportunities continue to play out.  Lets do a  Tuesday review...

.  

QQQ   -  We expected this pause and...

    Read More

Jan 12th Weekend Review

This is the weekend report, where we can monitor the progress that the various sectors of the market have made, and what we may expect going forward.   Since I give a more detailed day to day update in the daily reports,  I often focus  mainly on the Big Picture in the weekend reports by using the weekly or Monthly charts. This week , however,  I will start with the daily charts in a couple of the sectors, to  include a  close up of where we are now, and then we'll get into our Big Picture Outlook.

.

QQQ Daily - We are pausing at the  50 sma, as expected.   Will we go sideways or pull back?  It really shouldn't matter, at day 12, I think that we should still break above the 50sma in the first daily cycle and maybe back test it on the dcl later...


QQQ WEEKLY - This is an area that POSSIBLY may eventually become an important topping point.  We are watching this s things unfold. If the FED stops raising rates in early 2019, I wouldn't rule out that the markets can hang in there a bit longer.  FED PROPPED.  I still lean toward a H&S top though, with highs in place. 

  Read More

Let me tell you a story about gold.

Gold has been on a run during this market correction.  There is more to the story and I’d like to show you.


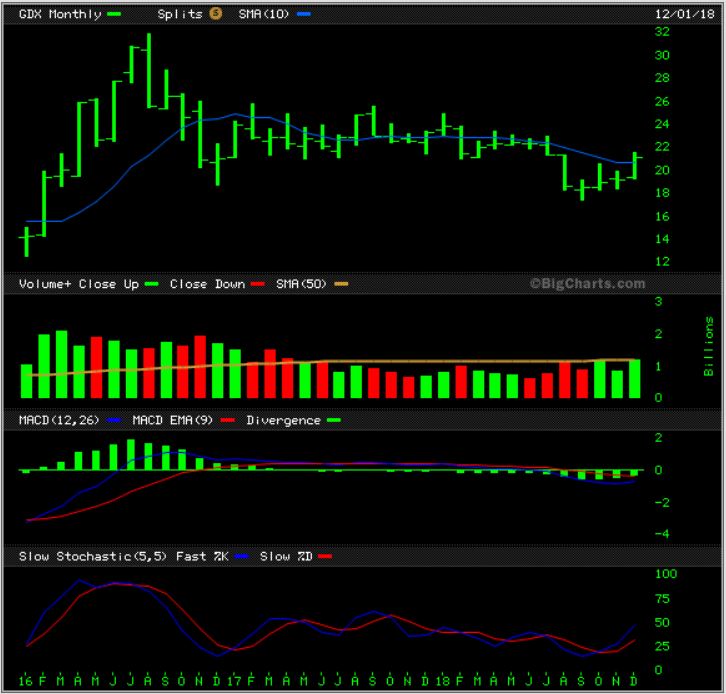
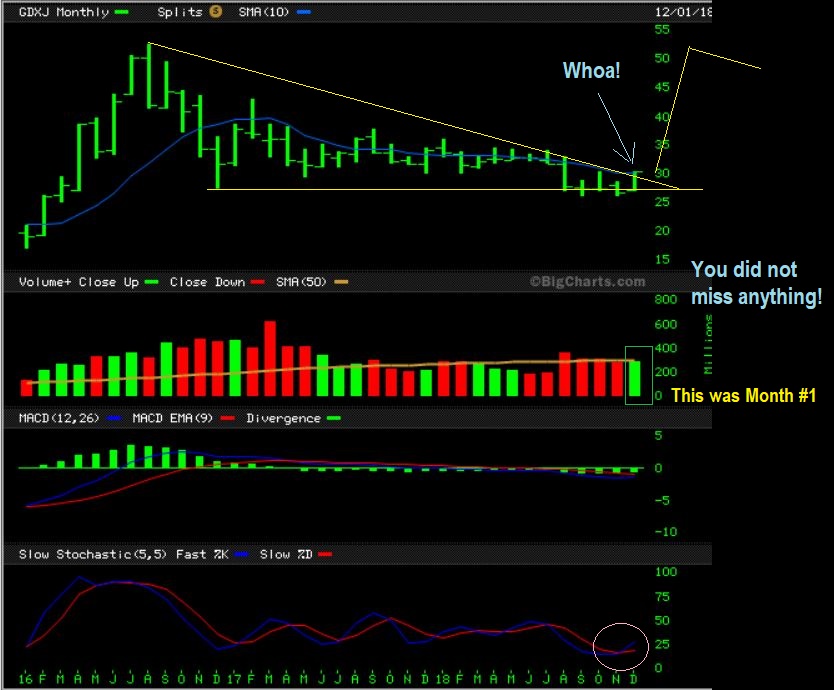
Before we get started, lets look back at $GDX and $GDXJ how they closed out 2018…

THE MONTH OF DECEMBER HAS NOW CLOSED,  AND THERE IS NOTHING BEARISH ABOUT THIS MONTHLY CHART.  THIS IS A VERY BULLISH LOOKING CHART!  THIS LOOKS VERY BULLISH FOR 2019!


GDXJ MONTHLY –  December has ended and this is the first Positive Month since MAY!   I pointed out that down trend line last weekend,  and it has been broken!   Again, I see NOTHING BEARISH about this chart.  2019 Could be a very profitable year !

(The following is a sample of Alex’s work from the past week)

(1/9/19)

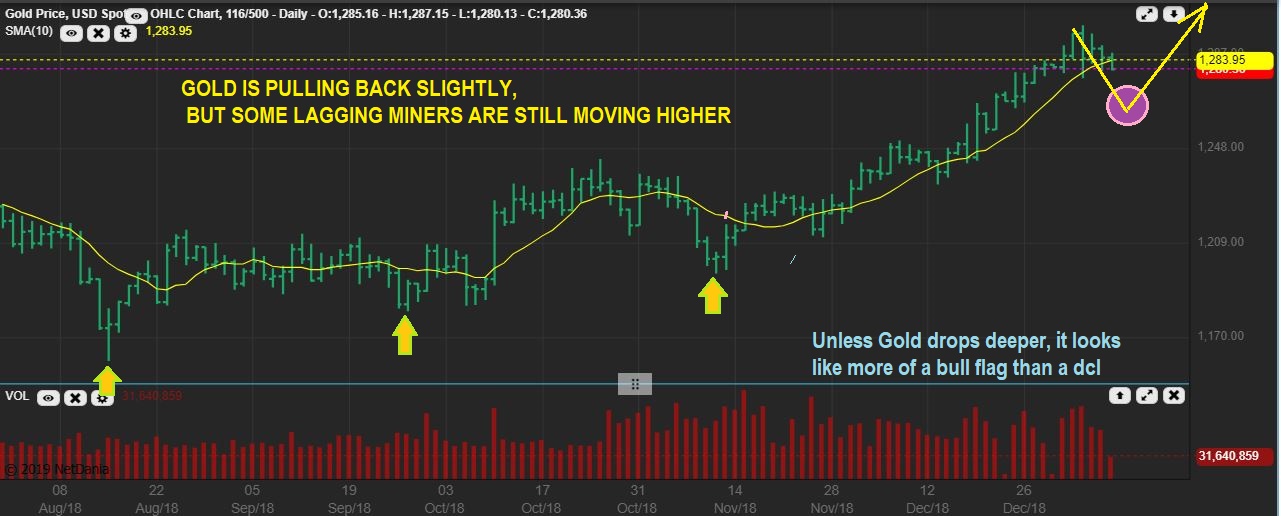
GOLD LIVE WEDNESDAY JAN 9th-  Gold has been dropping, but it is mild at this point.  I’d like to see more of a drop.

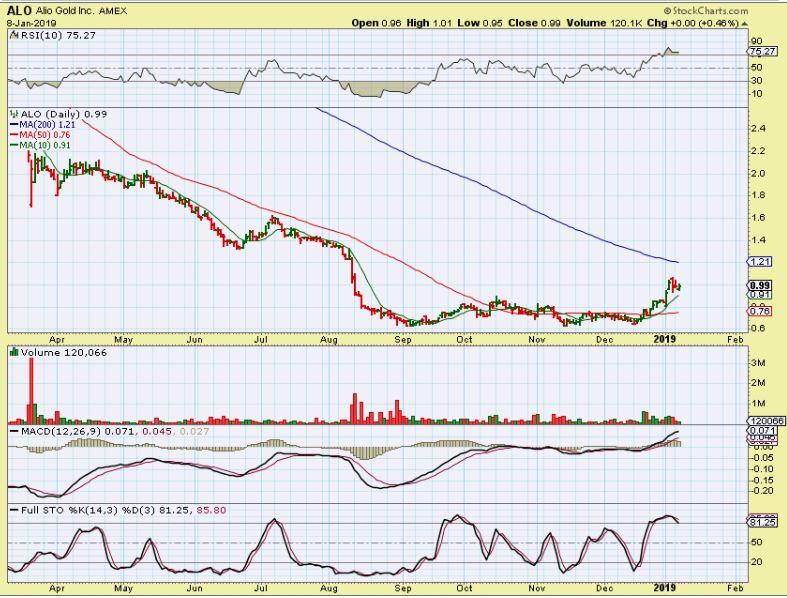
ALO –  In December I pointed this out as a lagger that Popped and was a buy. I pointed out that these bases can actually produce a nice run . 
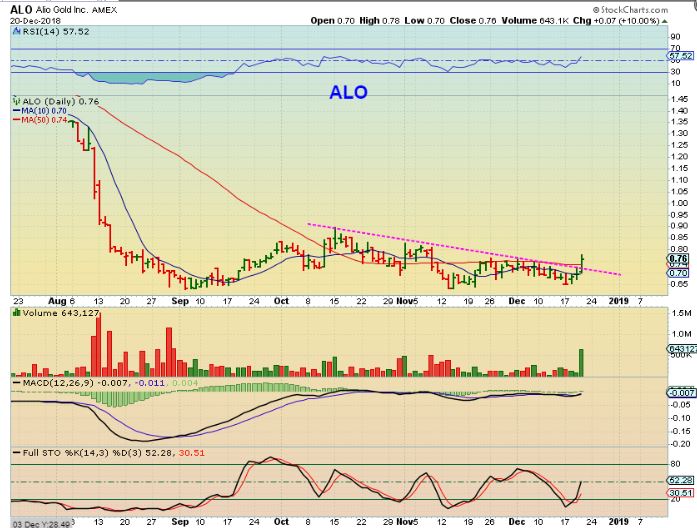
ALOIt ran and is now Bull Flagging.   I then pointed out other stocks that resemble this set up, and mentioned that they could be bought as those ‘lagging stocks trying to play catch up’  ( Advice:  a small basket to avoid individual risk, and  you can also use a small position size).  
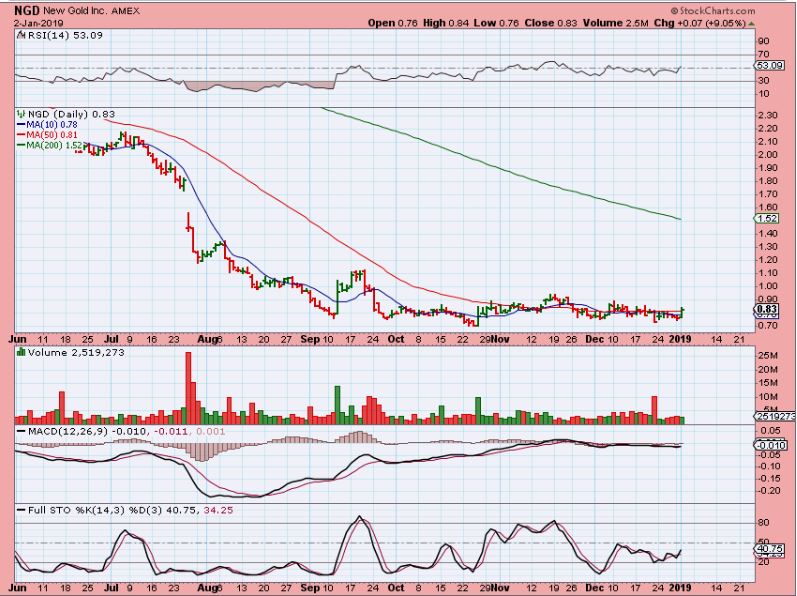


NGDHere we go,  JAN 3rd, a similar base as ALO  was pointed out here and looking ready to go.  It popped 10 % here and I was looking for a nice run to the 200 sma as possible over time.  

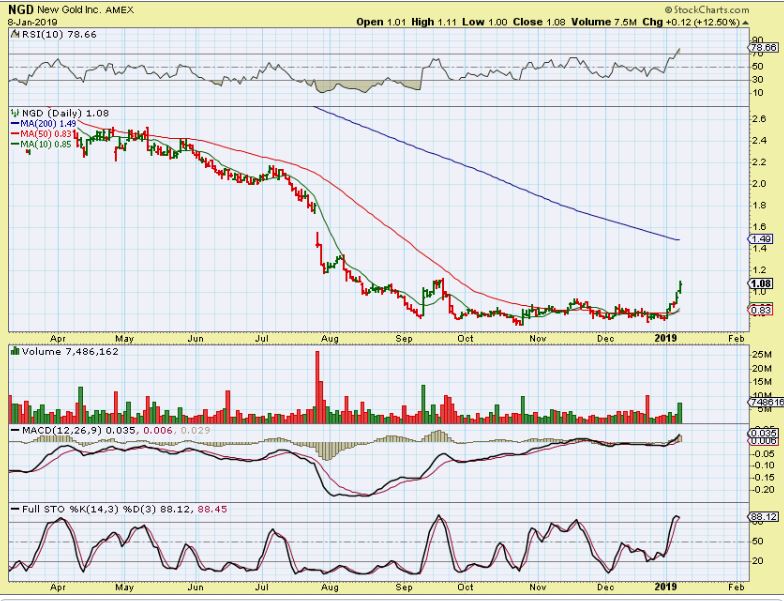
NGD –  Boom Boom Boom-  it is playing catch up, even on days when GDX & GDXJ were down.  So I see that as an indication that some of these will act on their own,  as buyers step in to accumulate. 

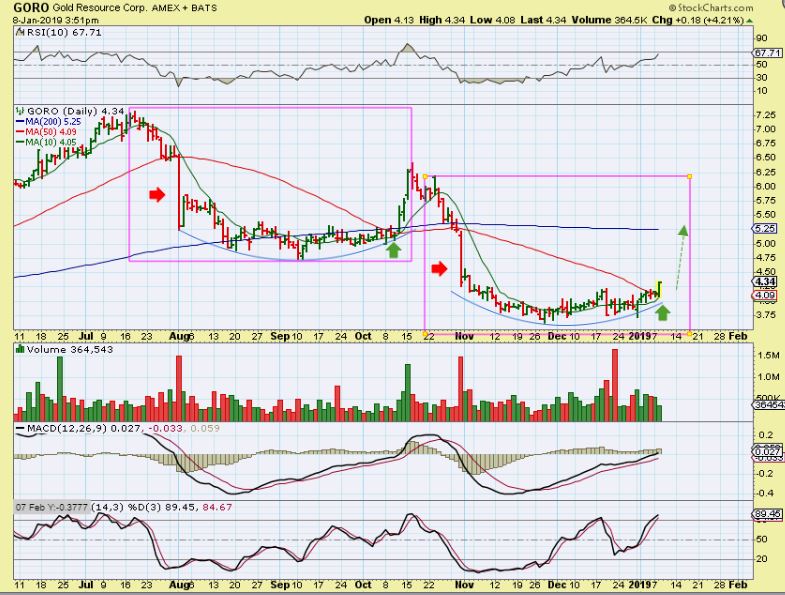
GORO DEC 31  – So I used this chart and said that it looks similar to ALO and NGD, but it needs a bit more sign of strength. I wouldn’t just buy a 1 day reversal, but…

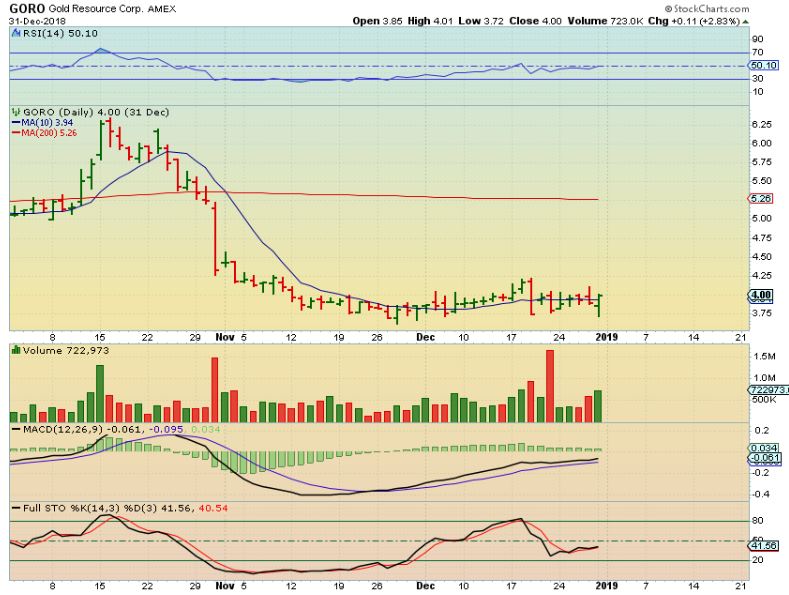
GORO  – It started pushing on that 50sma, and Tuesday it POPPED above it. THAT IS A BUY.  GDX & GDXJ were down at the time,  they were pulling back, but GORO was being bought up.  This  is a buy, but I did notice the DEEP RED CRASH DAY every 3 months before the base (red arrow).  That MIGHT be earnings, so be aware of the earnings date. 


HL –  HL was a BUY on JAN 3 too.  It has lagged, and it was a Silver stock still at the very lows, MACD rising.  Low risk, with a stop at the lows.   $2.47

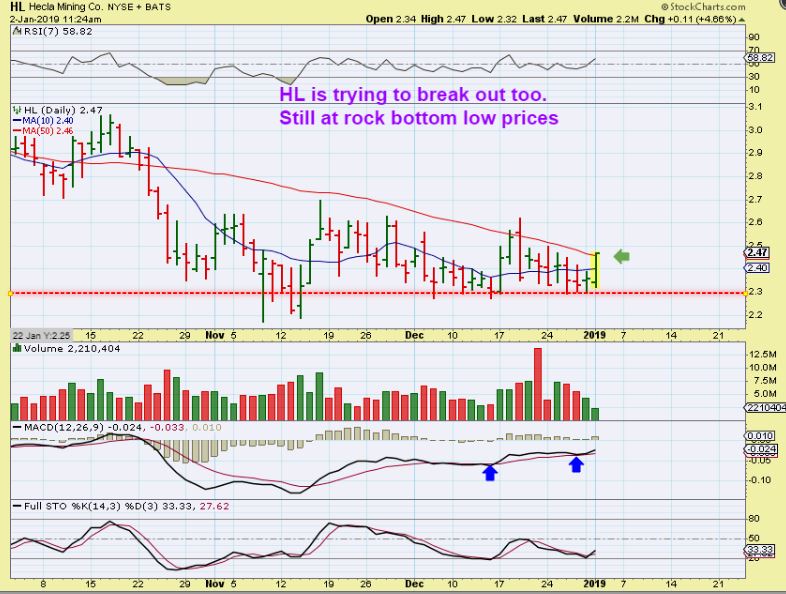
HL –   It started flagging sideways and Tuesday HL has a 10 % POP.  Again,  this happened while GOLD, GDX, and GDXJ were down.  SO IF CYCLES SAY GOLD & GDX Need  a pull back,  maybe some of these that didn’t join in on the run higher in December  (laggers or Base building) will still just do  their own thing in January?   


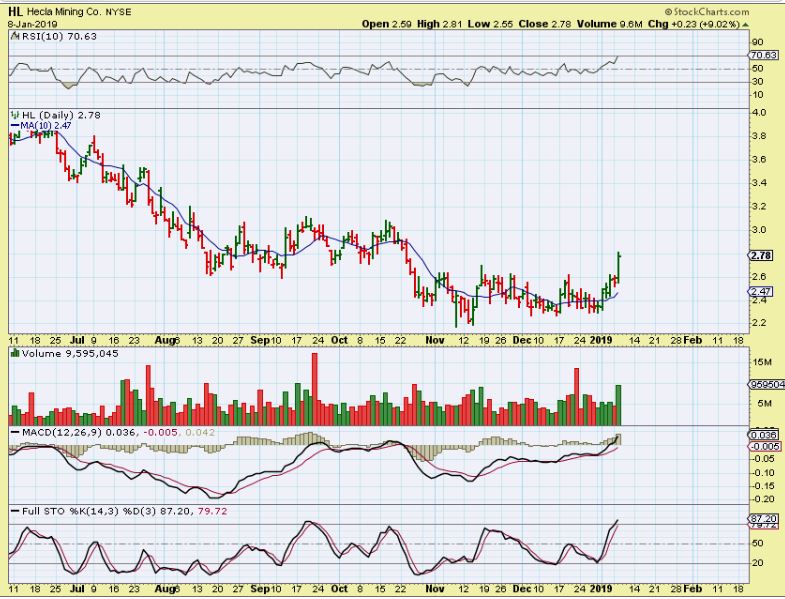
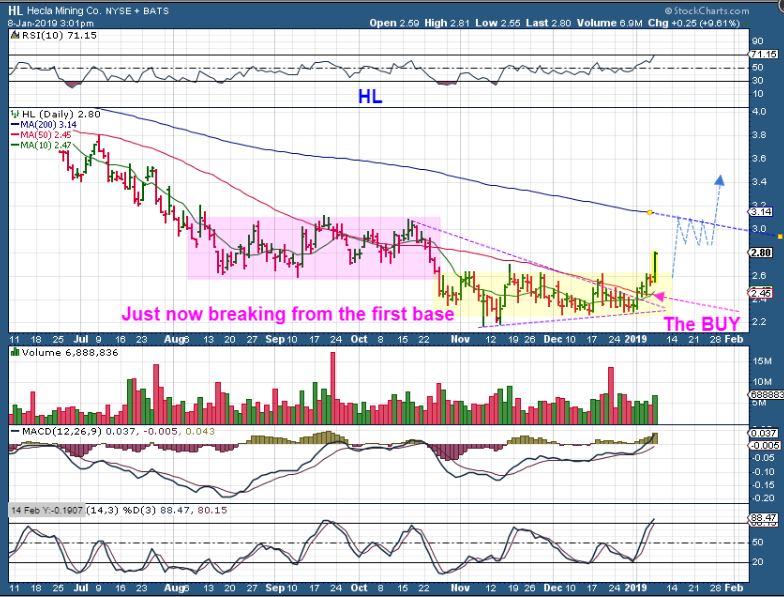
HL – It could easily run, crawl along the 50sma, and break out as shown here. 


(1/11/19)

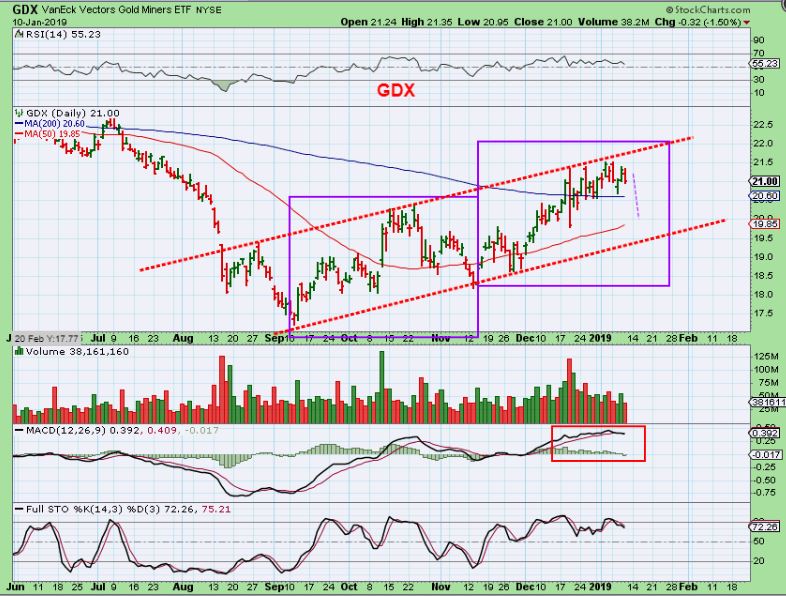
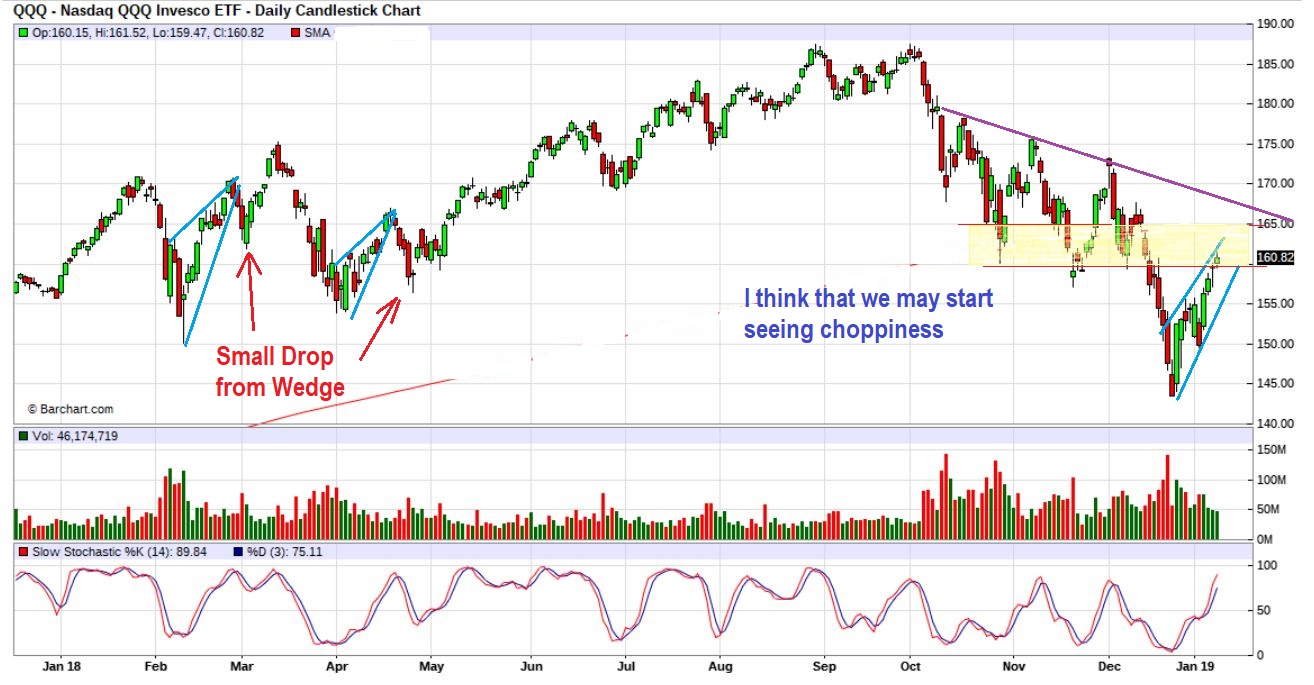
GDX  – If we can get a drop,  it might only look like this,  but so far GDX got choppy again.   Believe it or not,  this is 3 weeks sideways. It is simply going sideways along the 200 sma now, and that can be a Bullish Crawl.  IF GOLD BREAKS OUT HIGHER, THIS CRAWL ALONG THE 200 SMA MAY BE THE ONLY PULL BACK THAT WE SEE ALSO. 

CDE  –  So some Miners do look like they could pull back for a buy opportunity.  CDE could tag that 50sma unless it just breaks this apex higher. 


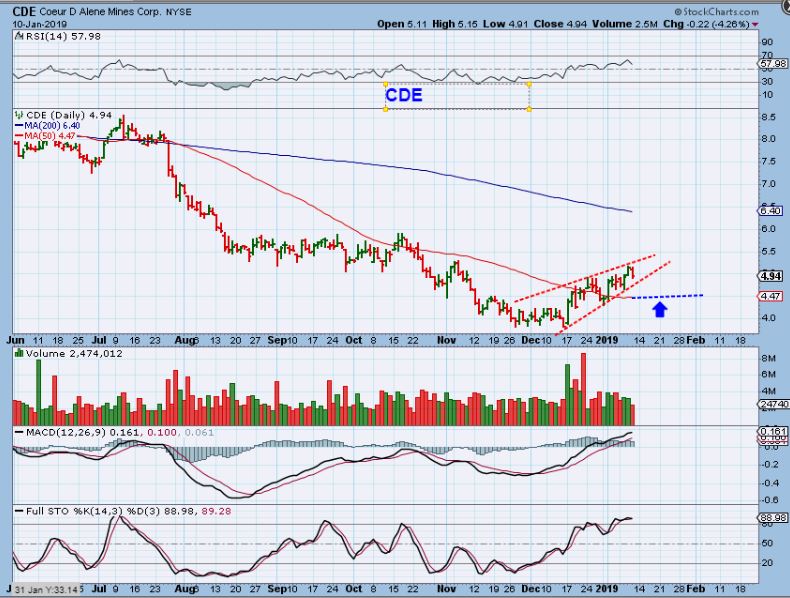
Chart Freak Membership

Alex has been successfully writing a daily newsletter service for nearly four years now and is considered one of the best traders of precious metals miners, energy/uranium stocks, and biotechs.   This is your opportunity to join his service as a member and follow along as we enter the next bullish gold Cycle higher.

If you would like to find out more about the service or sign up, please click the buy option for more details.

Friday Jan 11th

Today is Friday, the last day of trading for the week.  It really has been a great couple of weeks of trading , so let's discuss a few things...

 
.

This was in yesterdays report...

.  

QQQ –  I am also starting to see what look like rising wedges in The Nasdaq.  This can push higher, but keep an eye on it.  These can be short term bearish, and often break down, an example of this was seen last  February and April.


QQQ - The QQQ tagged the 50ssma and the wedge remains  in view.  Read the chart.

Read More

Thursday – Decisions And Risk Reward

As was mentioned in yesterdays report, a variety of  the markets sectors have been climbing higher and trading has been excellent. Let's examine our current markets...

,

This was in yesterdays report-

SPX #1 – If this is an ICL, we should have a month or two off of the lows, but we are seeing price enter ‘resistance’ areas.  It CAN push higher, but we are nearing an area that may offer resistance and stall price too.  The markets have been straight up, but going forward they may get choppy.

Read More

Wednesday Jan 9th- The Climbing Wall

As the various sectors bounce out of their recent lows, they continue to do pretty good on the Climbing Wall.  Some may be climbing the so called 'Wall of worry'.  Let's take a look at the progress...

.

SPX #1 - If this is an ICL, we should have a month or two off of the lows, but we are seeing price enter 'resistance' areas.  It CAN push higher, but we are nearing an area that may offer resistance and stall price too.

Read More

January 8th – Mondays Pops

In The last quarter of 2018, various areas of the markets began drying up and going stale.  We saw the equity markets & Oil crashing down and  many good set ups that would form would quickly fall apart.   Trades in Miners and some of the Medical Marijuana companies were playing out ok, but there was definitely a choppy vibe in the GDX & GDXJ area too, into December.

.  

 Suddenly, we have seen  bottoms develop  (temporary or longer term bottom remains to be seen), and along with these bottoms are set ups  that are finally working out, and many are working out very well.  Let's take a look at Mondays action...

.

REMINDER:  At the end of December,  IN MY REPORT, I mentioned that this reversal candle on day 39,  was a buy in technical analysis, with a stop under that days lows.  If an ICL is in place (Day 1) , those lows will not be broken for weeks.   So far,  this is playing out well.  You can see that I said that " This is a BUY" in that December report.

  Read More