The Fed Minutes are scheduled to be released today. At times like this, we sometimes get a glimpse of what was behind the recent decision on interest rates. Is inflation starting to creep in? Just how divided or united were the Fed members when it came to timing for rate hikes, etc. Lets take a look at the charts and cycles and see if we can glean some idea of what could happen after the Fed Minutes are released.
.
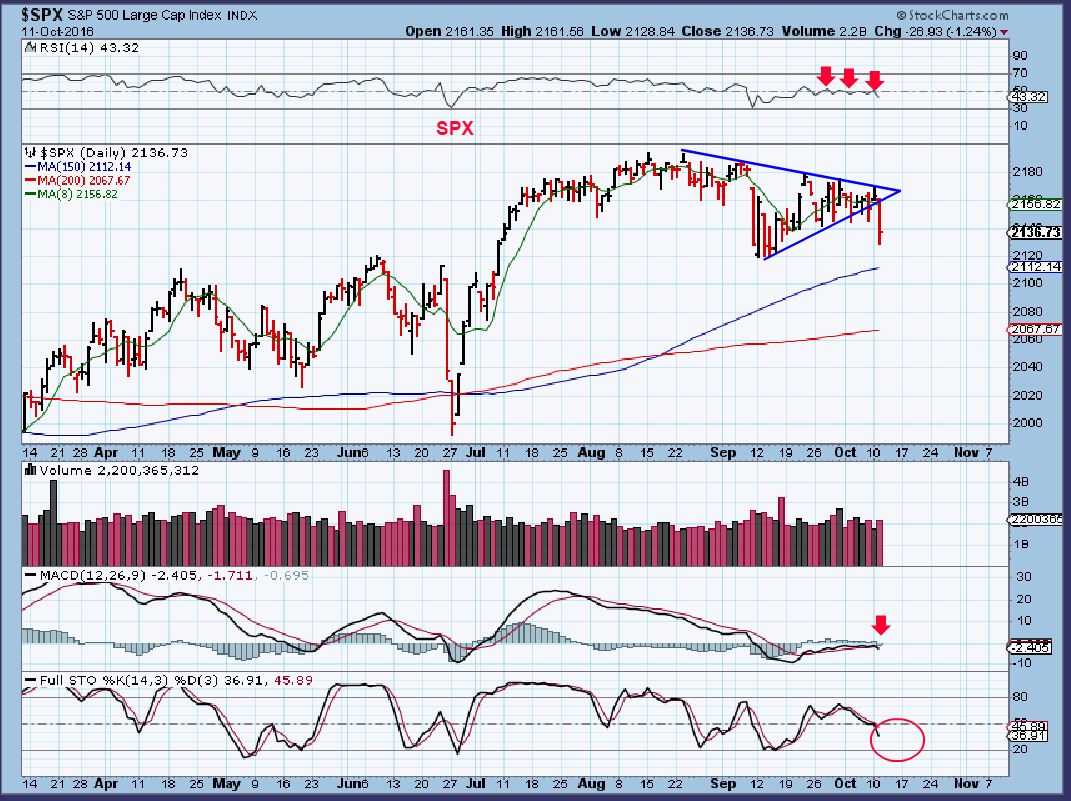
SPX – HMMM, This daily cycle peaked very early (day 8), and today is day 21. There are false break downs and shake outs in life, but this should be viewed as a warning sign. Why? I see a left translated daily cycle breaking down with maybe 10 more days to go. I see more room to drop on the stochastics, and a weak RSI. The Fed minutes could sink this ship or perform a miracle ‘shake out’ type move and a recovery, but this is a bearish set up the way I see it at this point.
Read more
If you have been investing and trading for years, no doubt there are times that you find it is best to wait for that ‘Fat Pitch’, but not always so easy. Well the good news is, I can see that a real low risk buying opportunity is fast approaching, so lets discuss that again in todays report after a quick review of the markets…
Read more
Another week of choppy trading, but there is a lot to talk about this weekend. It may be time to start gathering the goods, so lets get right to the charts.
.
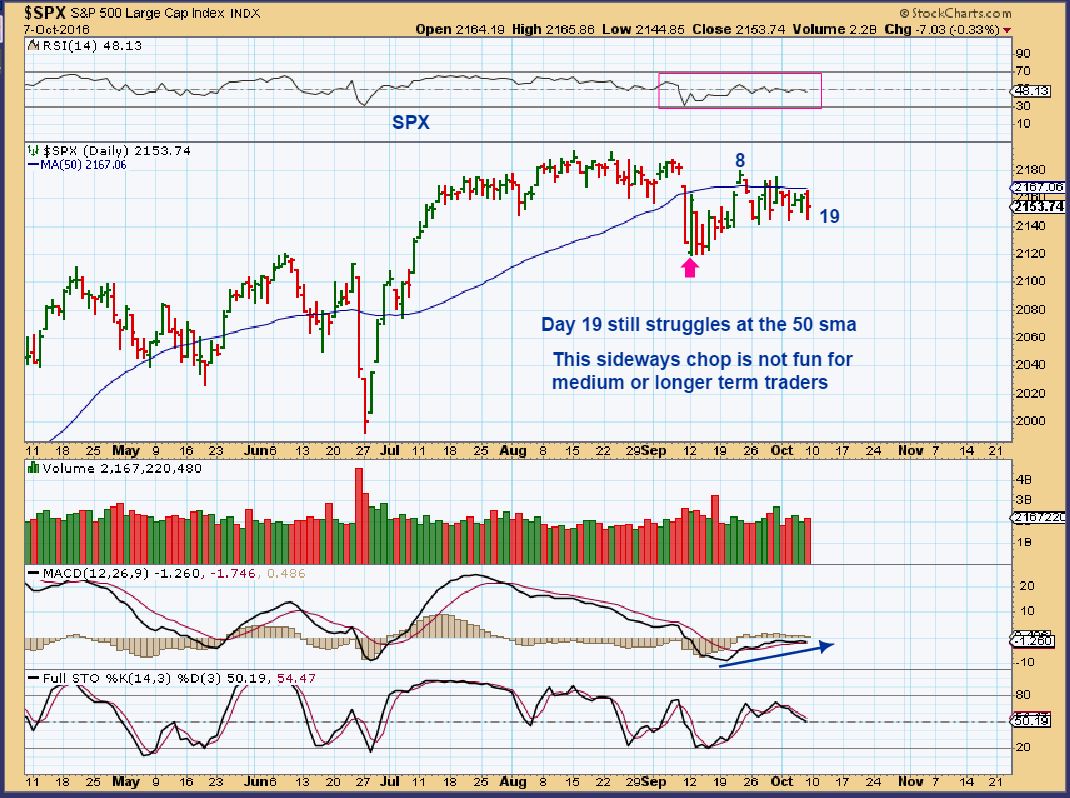
SPX – More of the same, Capped at the 50sma and L.T. ( left Translated) so far, it still needs to break one way or the other. Markets do not like indecision, and maybe this is what we get until after the elections. Please read the chart.
Read more
We are still waiting and maybe, just maybe, the Jobs report FRIDAY before the bell will act as a catalyst. Lets discuss why it would be great to see the futures in Gold higher before the market opens.
.
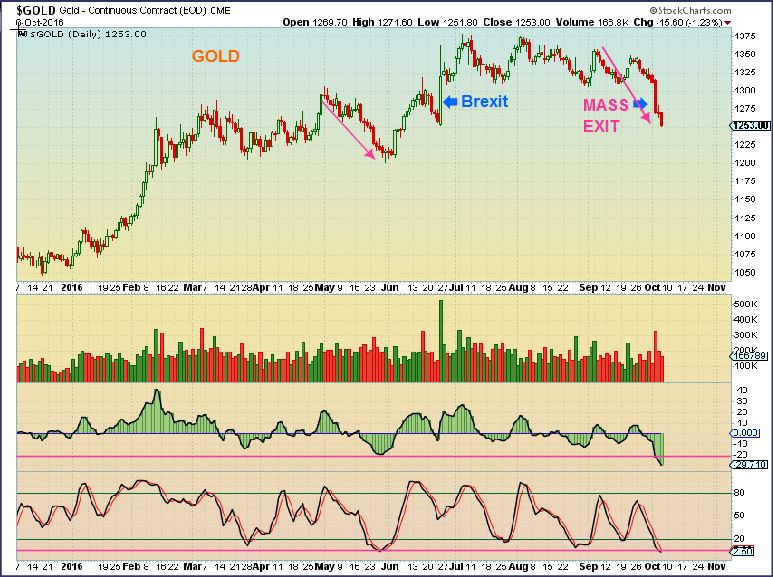
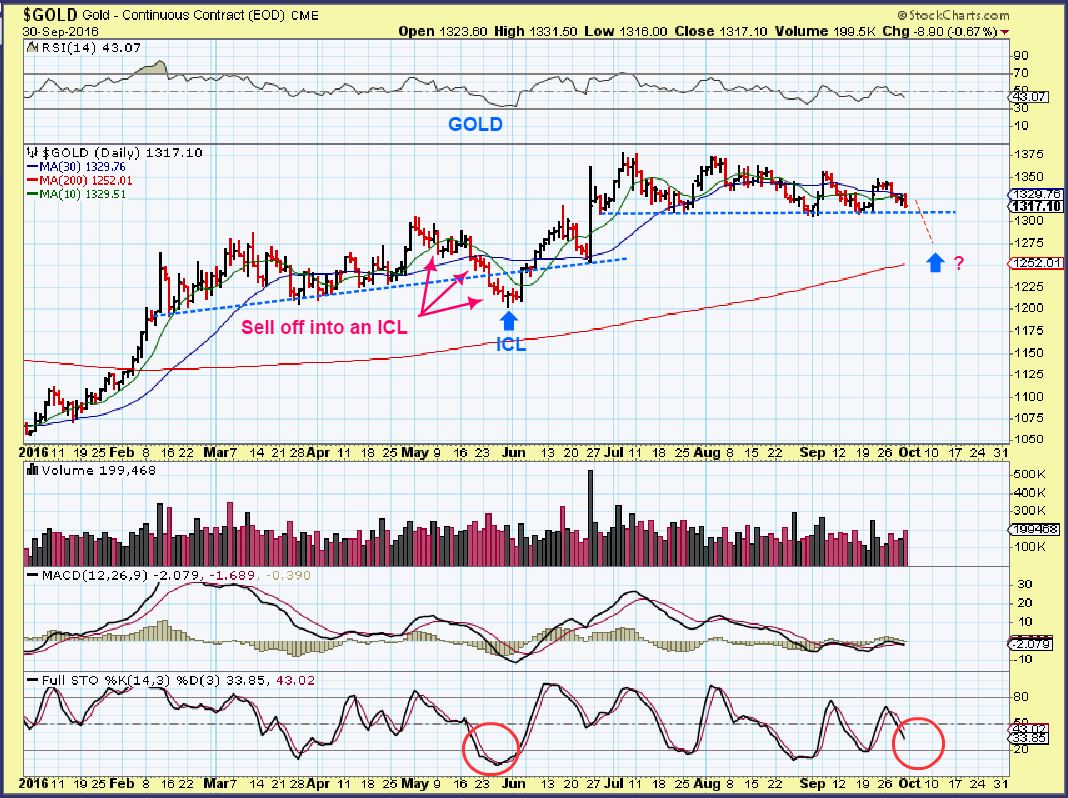
$GOLD – To start with, we have been expecting this type of a deep sell off since the summer. This is becoming deeply oversold, from the Brexit buying to this recent steady exit.
This is what I wanted to point out for Friday…
Read more
Today I want to take a closer look at Oil and Gold.
If you have been here for a few months, then you know that this is what we have been waiting for. Lets review.
.
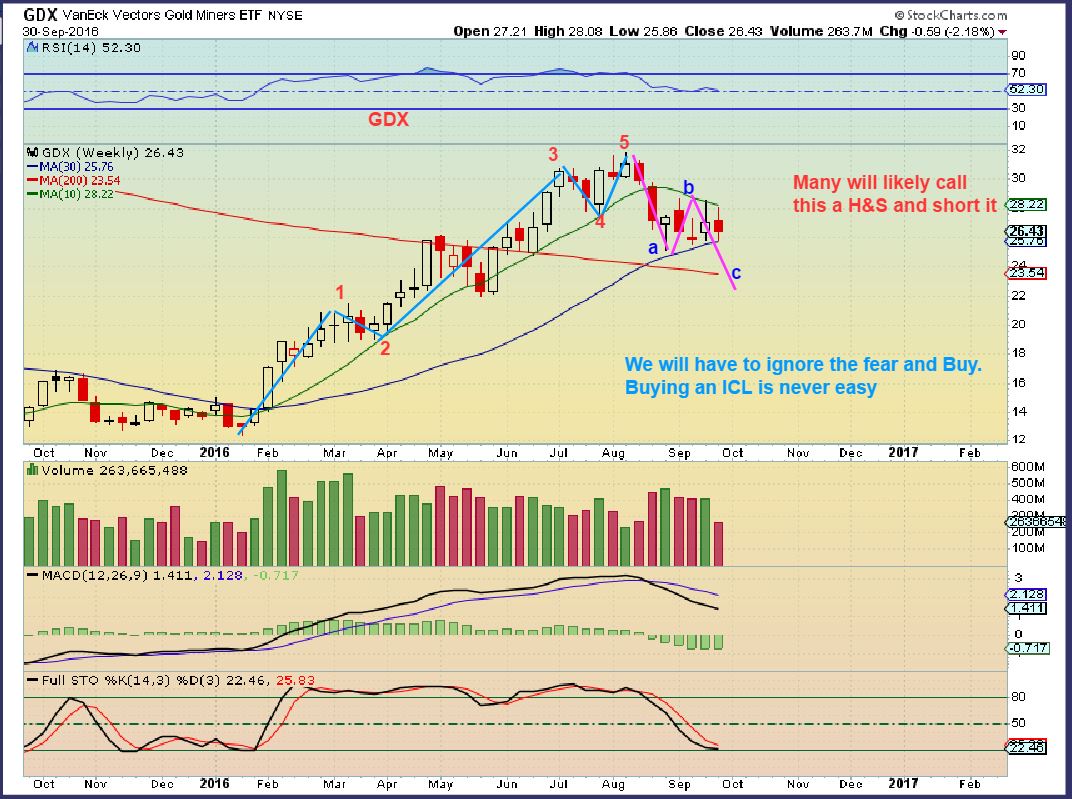
GDX – Way back in August I started to ready us for a deeper pull back than many at that time would think is likely. You may recall that I kept saying that a solid target was $22-$24 and I said to look for that steep drop at the end of September or beginning of October.
This chart from Aug 22 is an example of me preparing us for a coming buying opportunity. I expected a bounce first, then a steep drop.
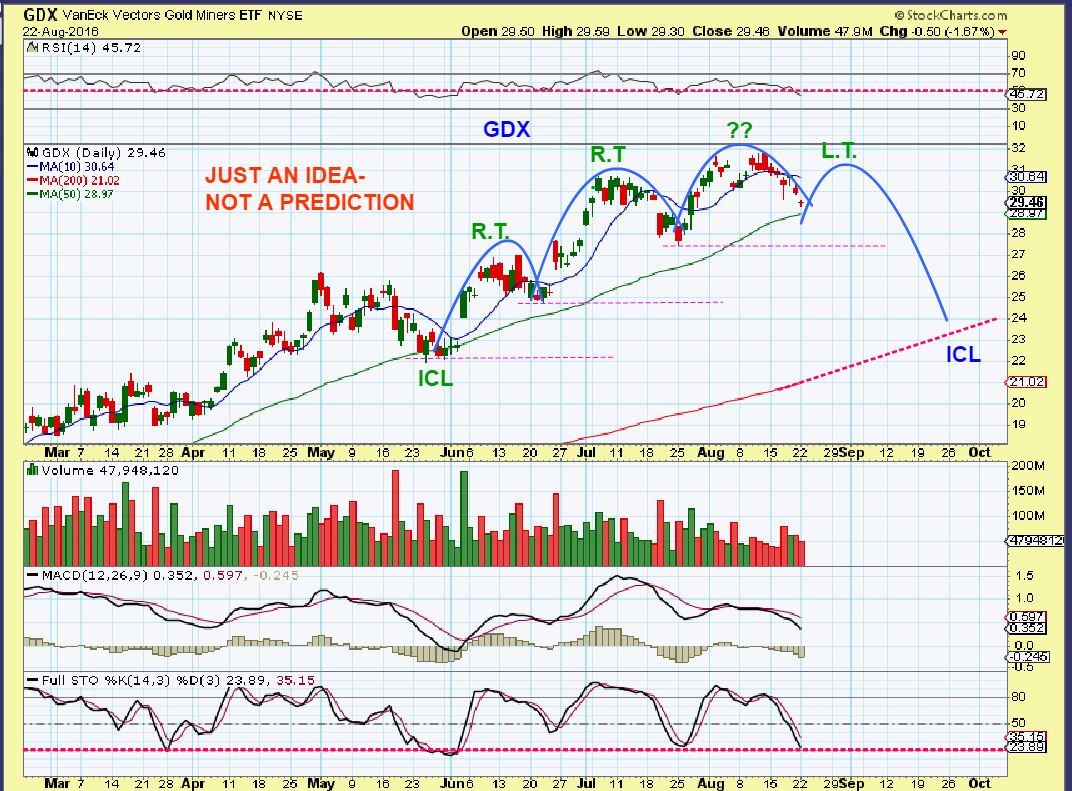
My Weekly chart showed GDX broke the weekly uptrend line. A wkly trend line break for an 8 month trend is ‘ugly’, and indicates that a yearly cycle low is coming. That magenta box became the likely target after that bounce at $22-$24 shown in Sept/ Oct. We would monitor things a little closer when we got there.
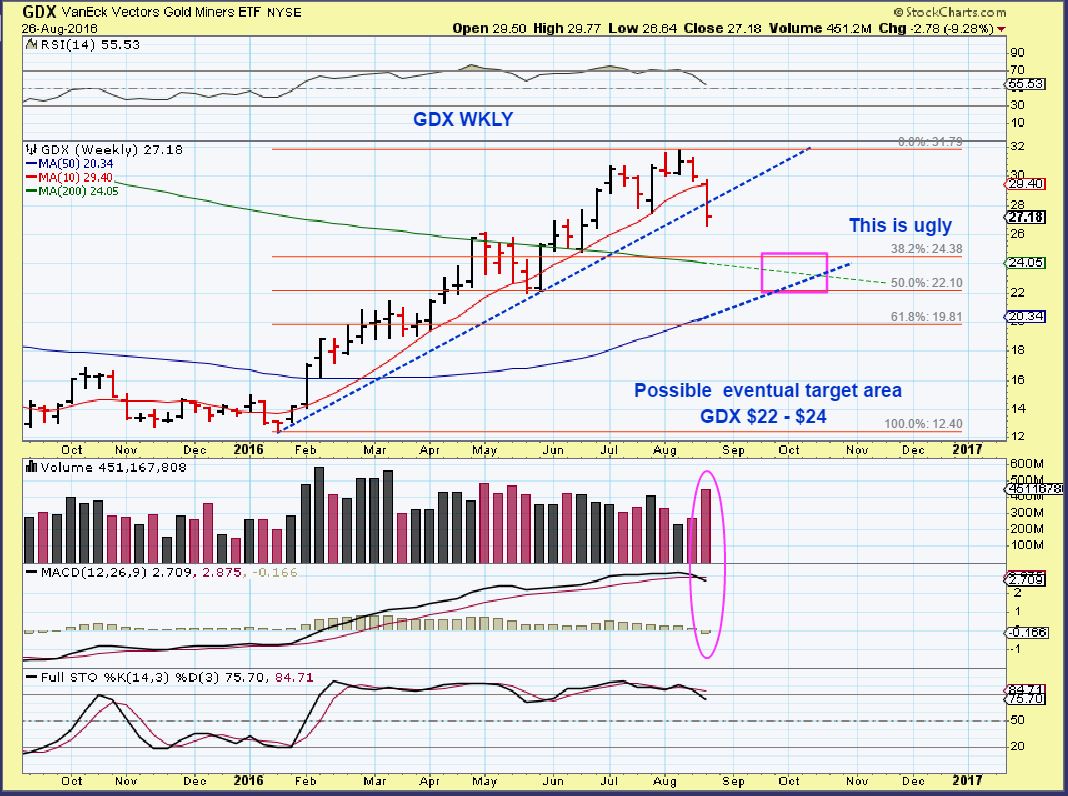
We are there, time to monitor things a bit more closely. 🙂
Read more
Our recent weeks of trading have had a lot of choppy sideways action, and this gets frustrating to both the longs and the shorts. My premium reports discussed how that choppiness was ending in Oil, and we began looking at buy set ups forming in the energy markets. I wanted to share my thoughts on ENERGY & PRECIOUS METALS from the weekend report here with the public. I Am expecting a sell off in Gold, Silver, and Miners, but it could be the next best buy of 2016. Lets take a look.
.
Below is a partial of the weekend report.
.
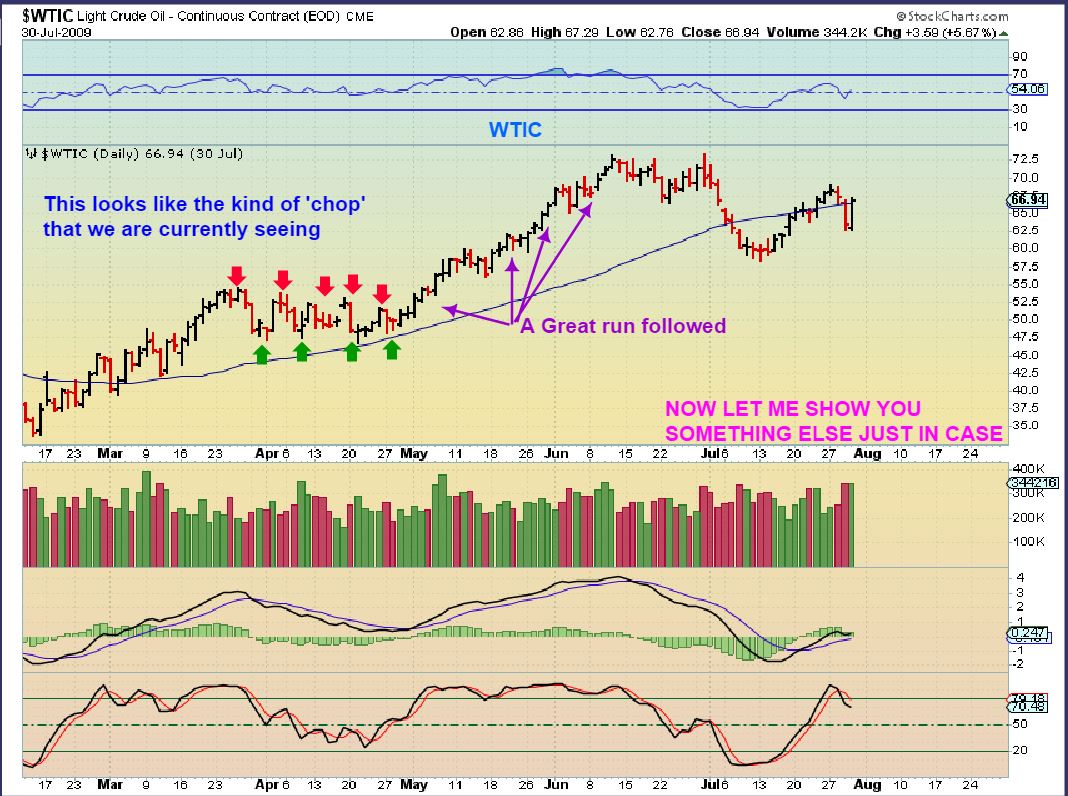
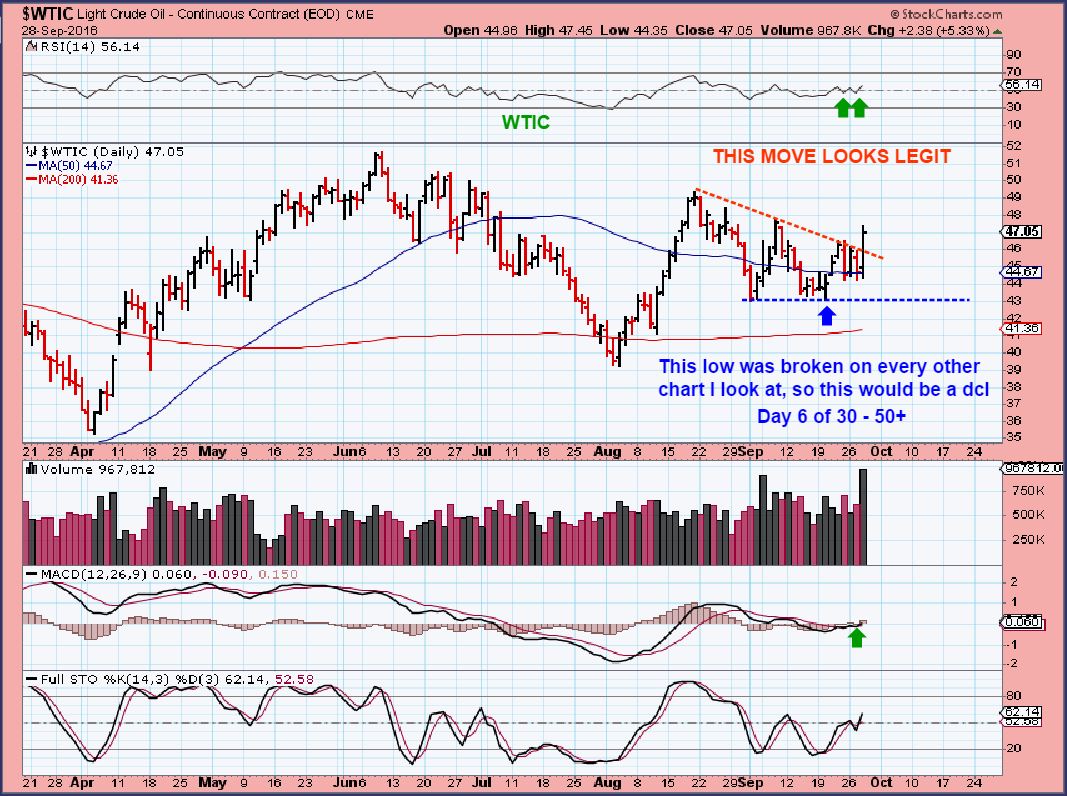
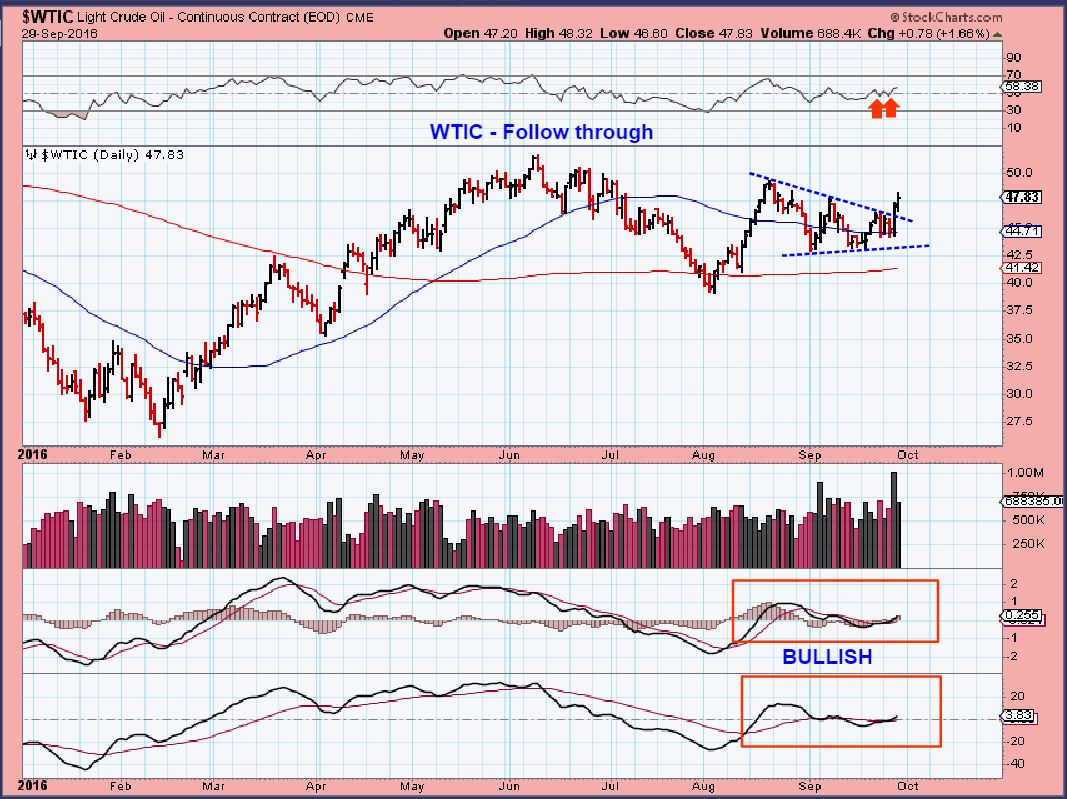
WTIC – Break out and follow through as expected. Please read the chart.
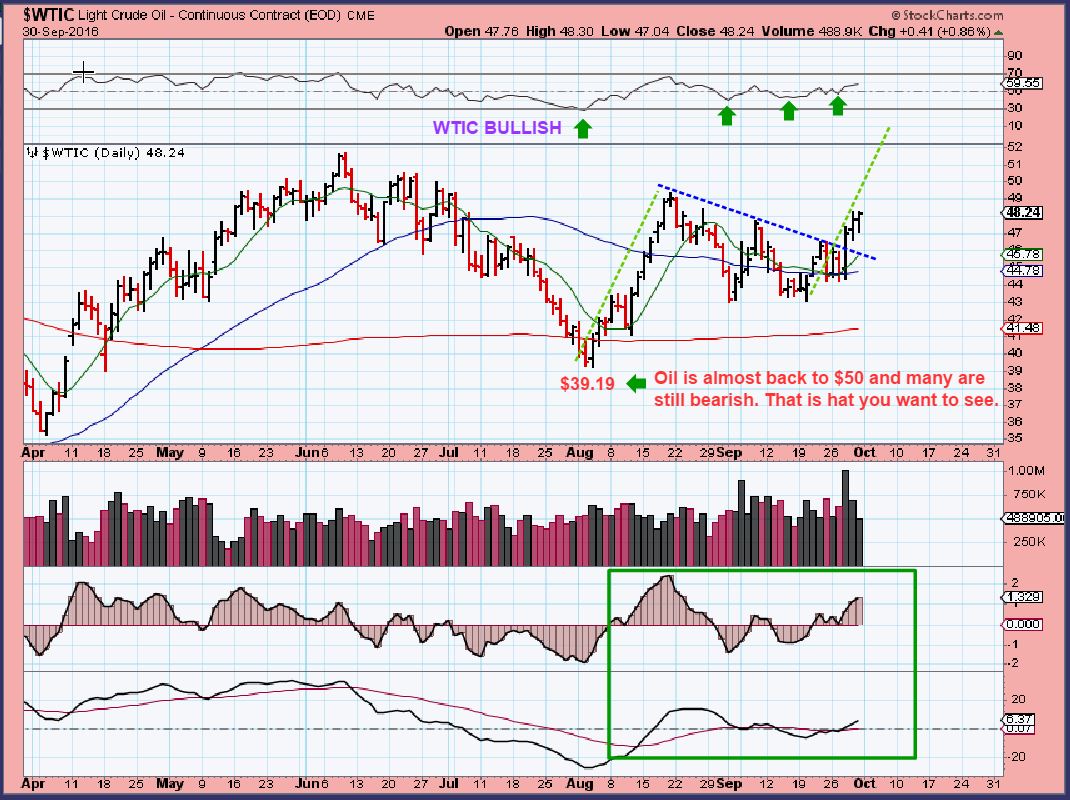
Please notice that when OIL bottomed in 2008-2009, it also had a sideways choppy period for weeks like we just experienced and then it ran strongly.
We had been looking at and discussing a variety of Energy stocks throughout 2016 since February like CWEI, RICE, WPX, AREX, SDRL, AXAS, MRO, CHK, and many more.
.
GOLD , SILVER, and MINERS
.
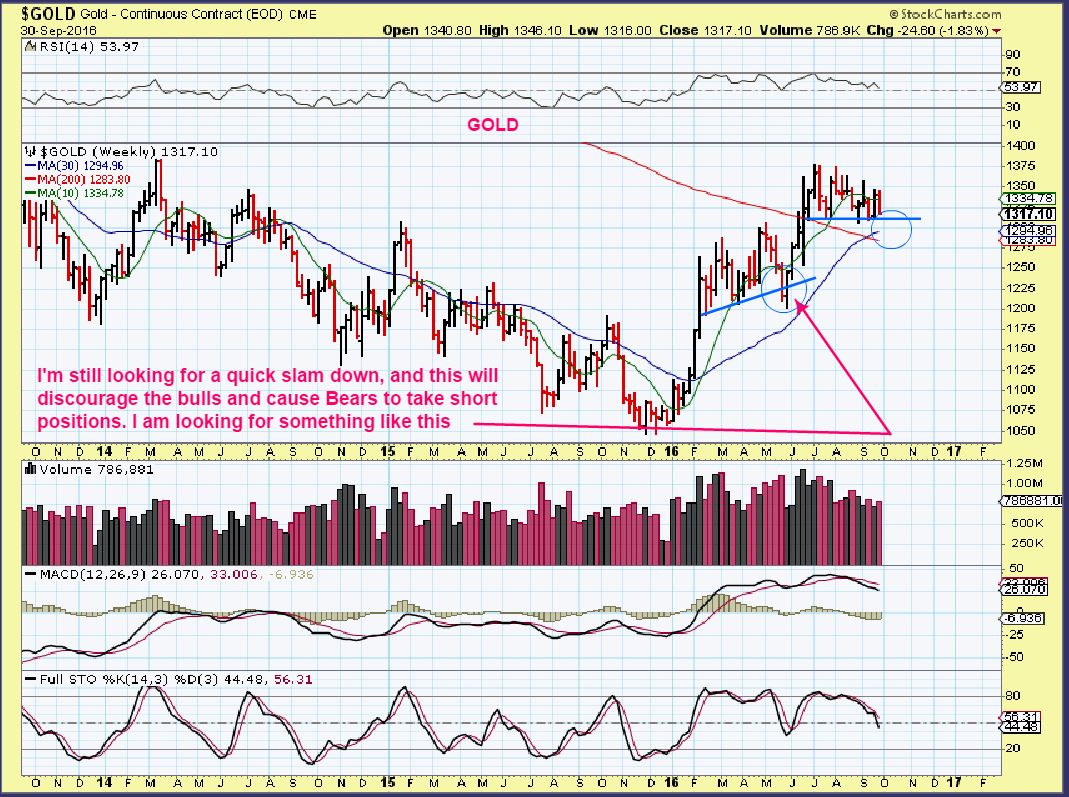
GOLD– I am expecting the dip into an ICL. A great buying opportunity should be coming soon, but this drop may cause some Gold Bulls to sell and not re-enter. We will be ready to buy. See the chart.
GOLD WKLY– Read the chart please.
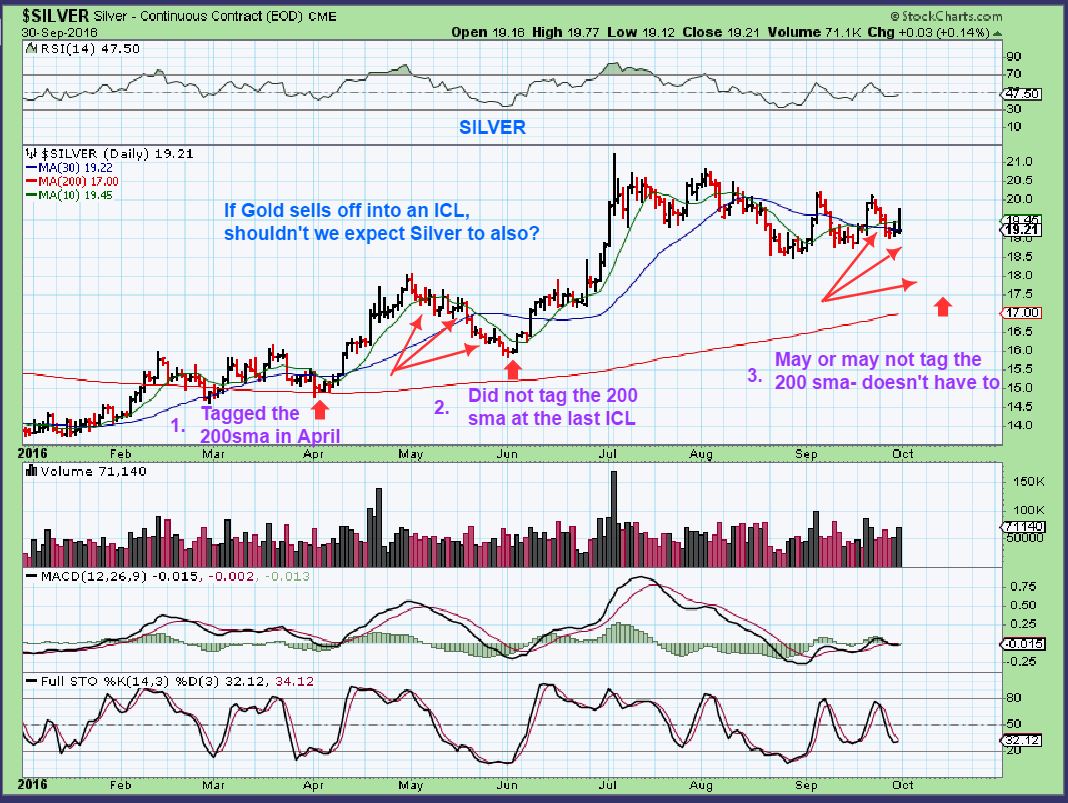
SILVER – Read the chart please.
LETS LOOK AT MINERS
GDX– In Bull markets, Miners consolidations can lead to very profitable moves higher.
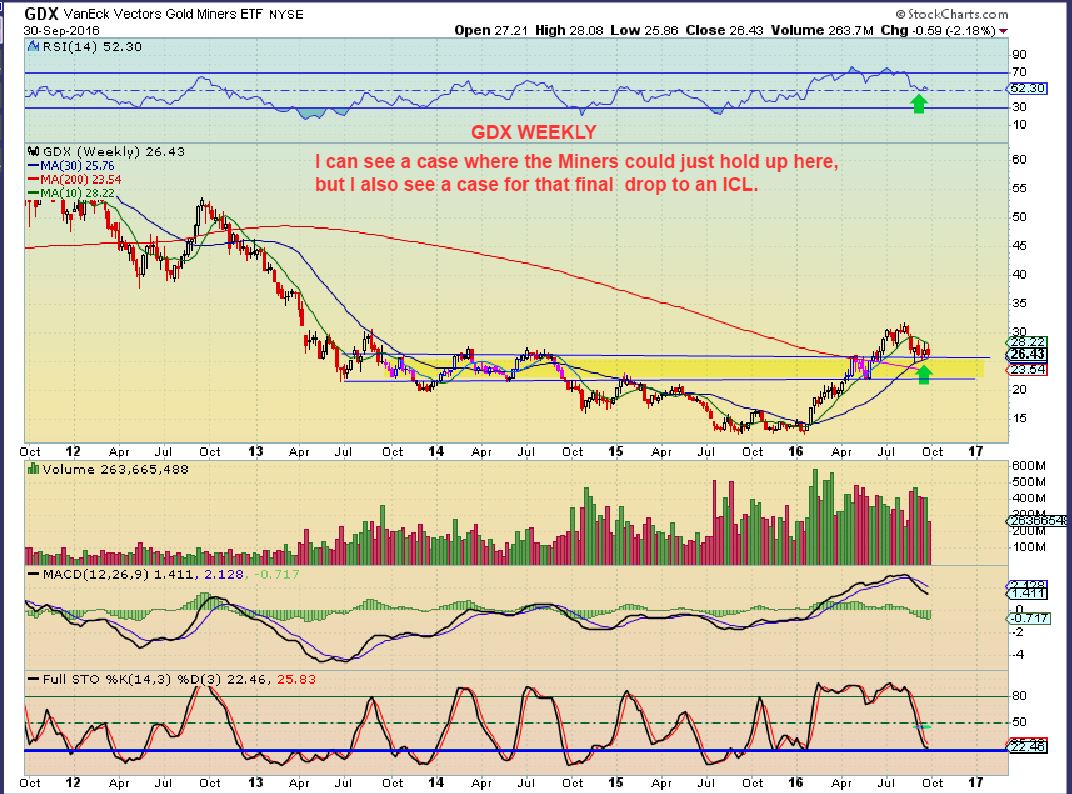
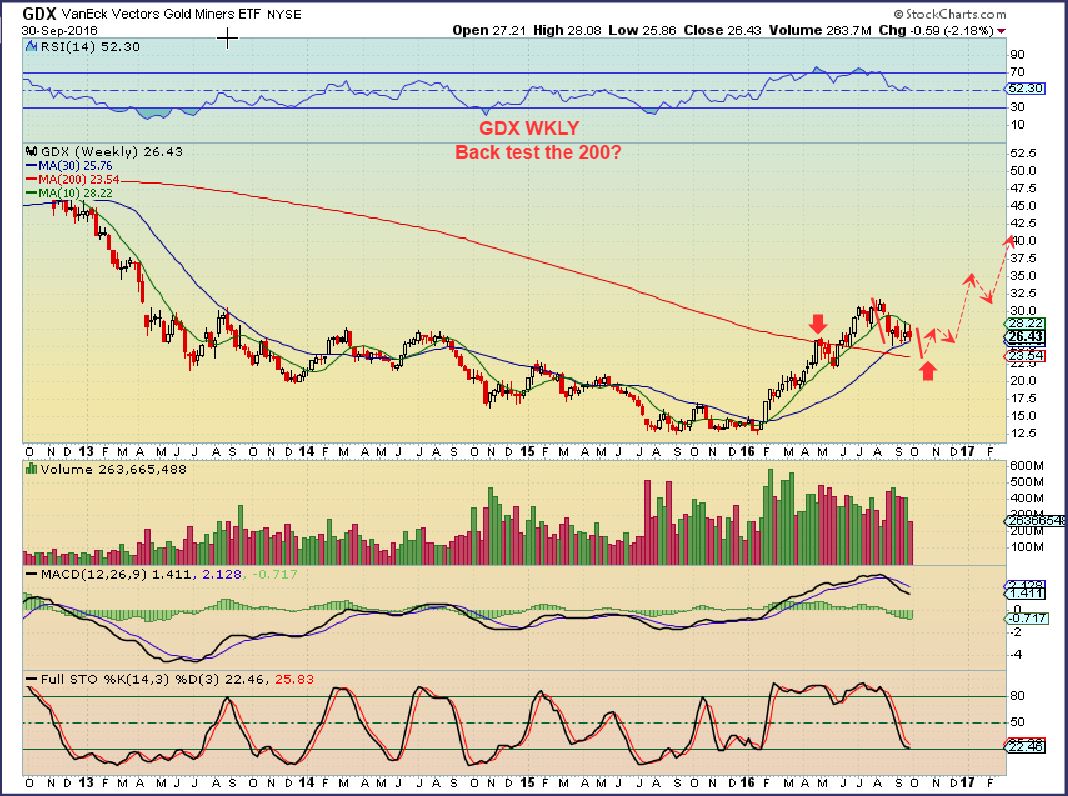
GDX – A back test of the 200MA would be a drop into an ICL, IF it happened. This weekly chart is getting oversold, that is good news.
GDX WKLY with a drop into an ICL , Elliot Wave style. please read the chart.
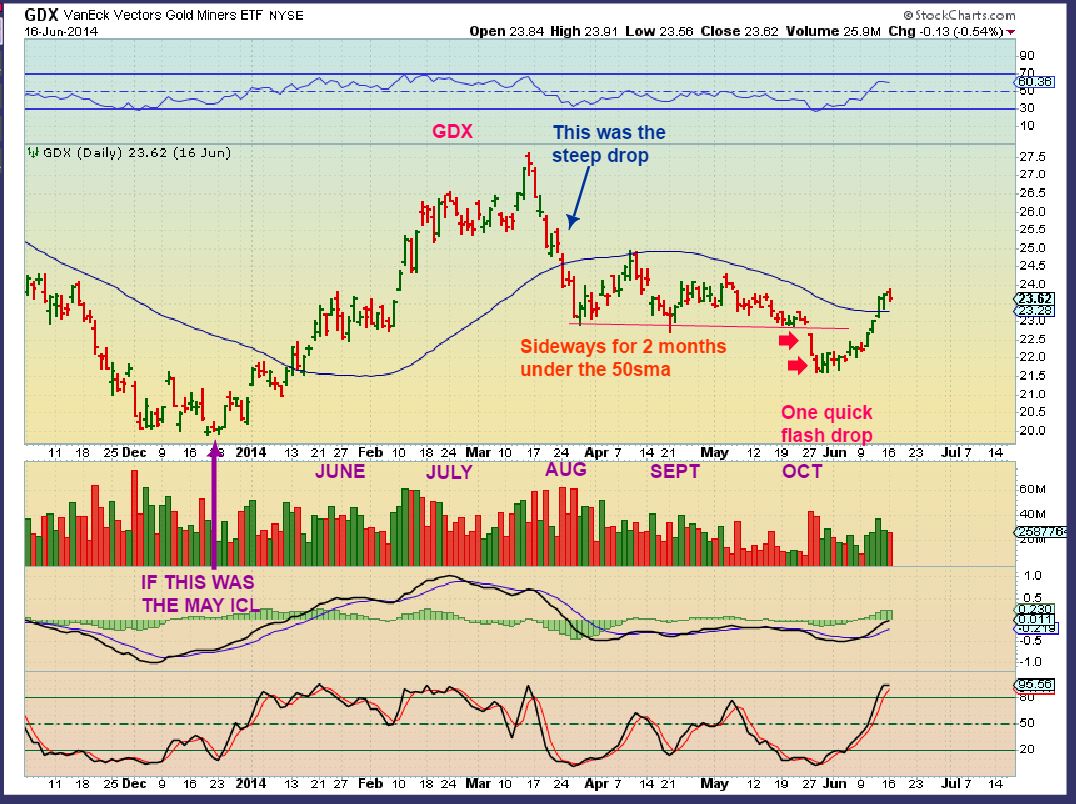
DO YOU RECALL IN A RECENT REPORT I was pointing out that this sideways action has happened before, and yes it is frustrating, but it always ends eventually. Here I was pointing out a sideways chop in 2014 that had a final quick plunge into an ICL. Unexpected to many that didn’t know cycle counts.
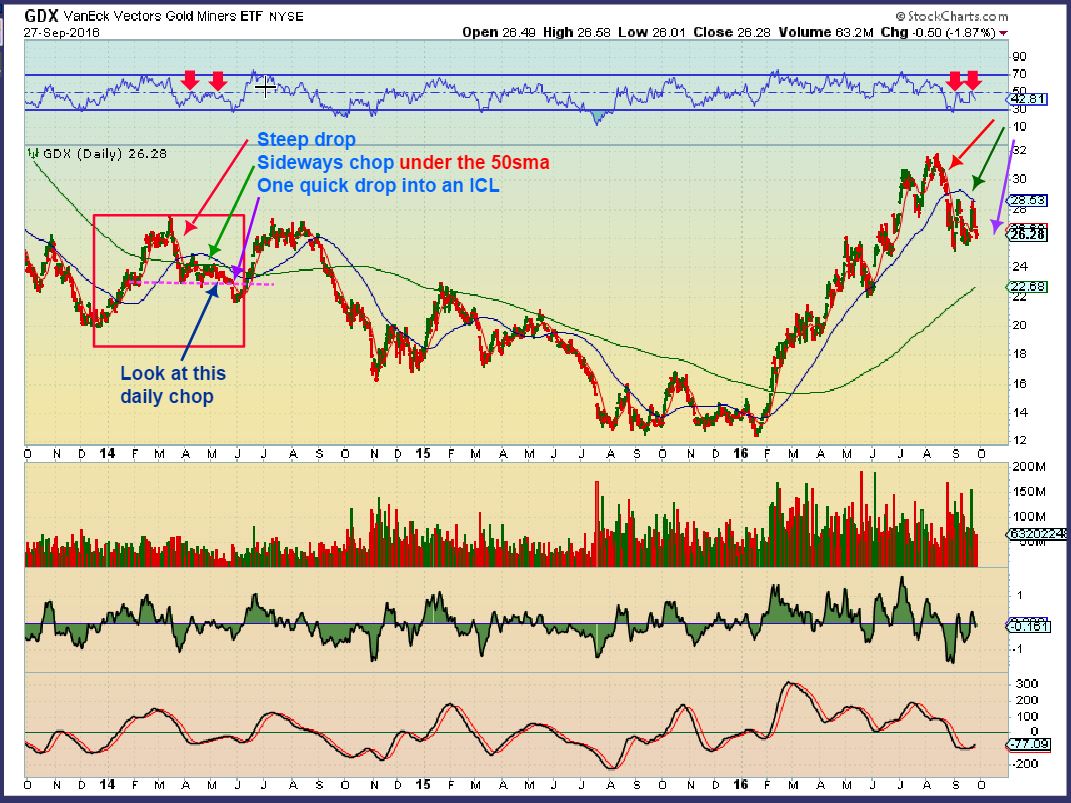
I wanted to zoom in on that Quick plunge into an ICL, since we are likely near one now.
-
That break down was very scary to buy, it was just a 2 day plunge.
-
I wrote in the Purple dates under the actual dates that this occurred. Those are our current cycle count, and please notice how that lines up 🙂
-
In 2016, the Miners last ICL was the end of May, and look where that leads us this for that plunge.
.
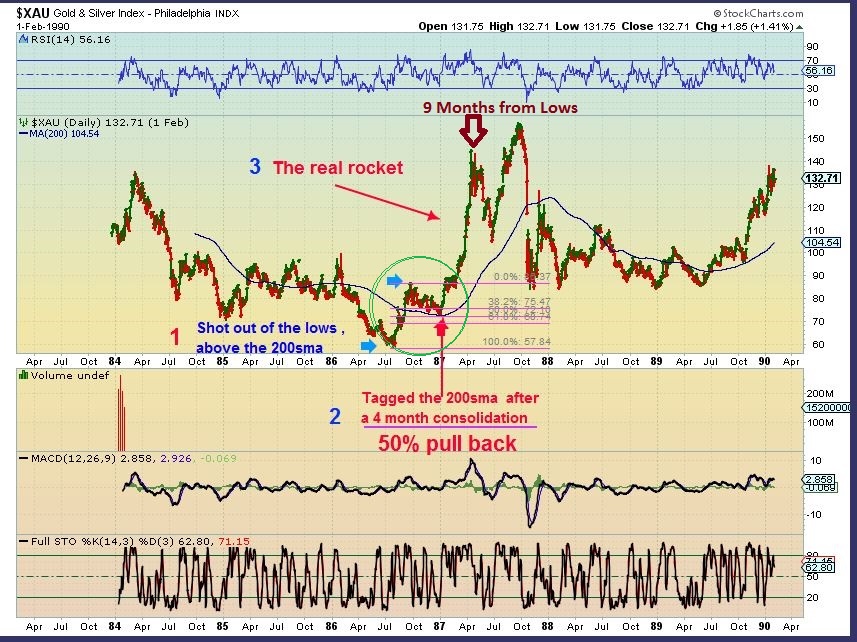
Since the sideways chop and consolidations can be frustrating to many, causing them to want to sell and give up, I want to re-post this chart.
.
This was an XAU consolidation in the Green circle. Again, some are getting frustrated and tired of waiting in this current sideways action. This was a chart that I posted a while ago, so you can ignore what I wrote on the chart then, and just focus on GREEN CIRCLE. You see 3 months of just sideways chop &consolidation. NO MONEY TO BE MADE TRADING THEN. CHOP CHOP CHOP and if you kept jumping in and getting stopped out, it was frustrating. Now look at that run up after the 4 month chopping action labelled ‘the real rocket’. BOOM!
SO basically I am expecting that a pullback will end this choppy sideways action. I am pointing all of these reminder out ( And will keep doing so) so that my readers dont get frustrated with the current price action in Miners and say, ” This rots, I hate Miners. I’m not buying this weak sector anymore!” Not that you would, but some do, and I think GOOD TRADES are fast approaching.
.
So – look at the following 2 charts of GORO and GSV and you see some bullish action even now while Most Miners are chopping sideways and pulling back. This is making me think that when Gold, Silver, and the Miners finally take off upside, Miners may really spring into action as buyers step back in ( And some shorts cover).
GORO

.
This was part of my weekend wrap up for the end of September 2016 Oil & Energy trades may make us some extra money while we are waiting for Miners to finally get moving upside, or maybe holding CASH is a position that serves you best. My experience has proven to me that patience during these consolidation periods and buying the dip pays off very well. Thanks for being here, have a great weekend!
.
Chart Freak Premium
Chart Freak members receive up to 5 premium reports per week covering a wide array of markets, as this public post illustrates. Come and join the ChartFreak community as we trade the new Gold Bull Market and various trending sectors.

~ALEX
Lets take a look at what appears to be some good energy.
.
WTIC –
As expected, Oil is following through to the upside. Sitting near the August highs, it could form a handle on this mini cup , or it may just power higher to the June highs.
Read more
Our recent weeks of trading have had a lot of sideways chopping action. My last report discussed how that was ending in Oil, and I think that the choppy action is about to end in the general markets too. Lets go to the charts.
.
SPX – As price approaches an Apex we should see a nice break out and run. There is a lot of pressure built up in this consolidation. A break down could get ugly fast, but this leans bullishly at this point.
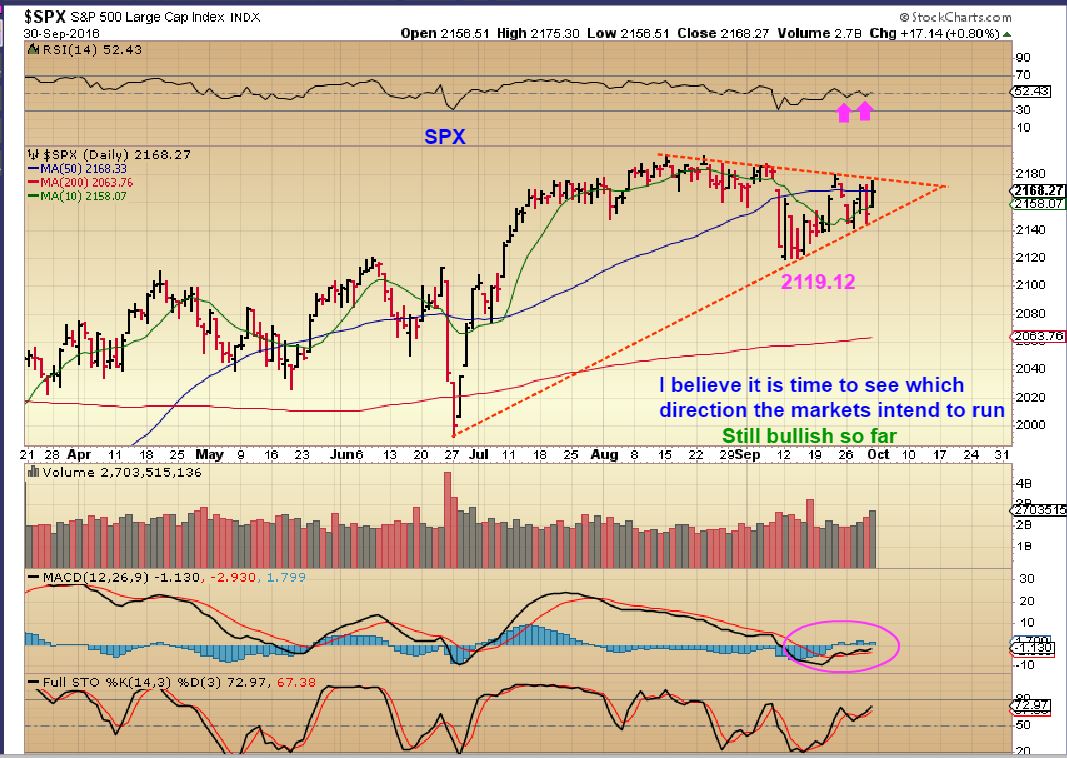
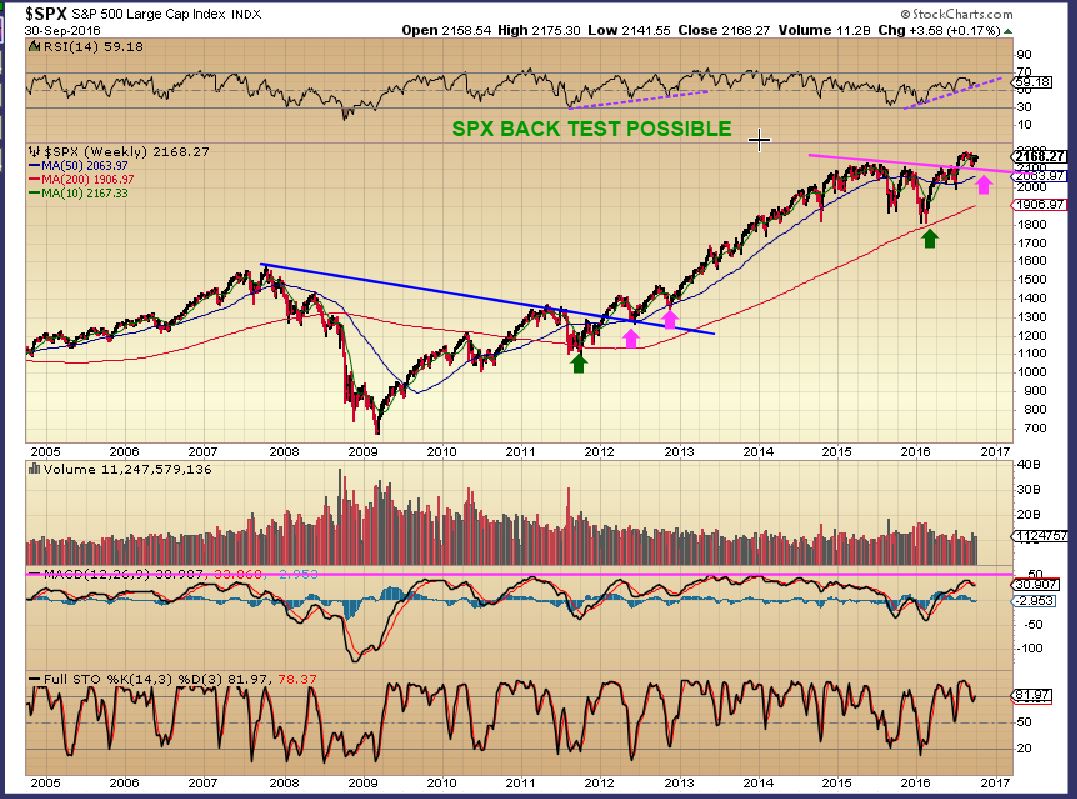
SPX WKLY – This looks similar to the 2011 sell off, break out and back test in 2012.
Read more
Lets talk about the current window of opportunity
.
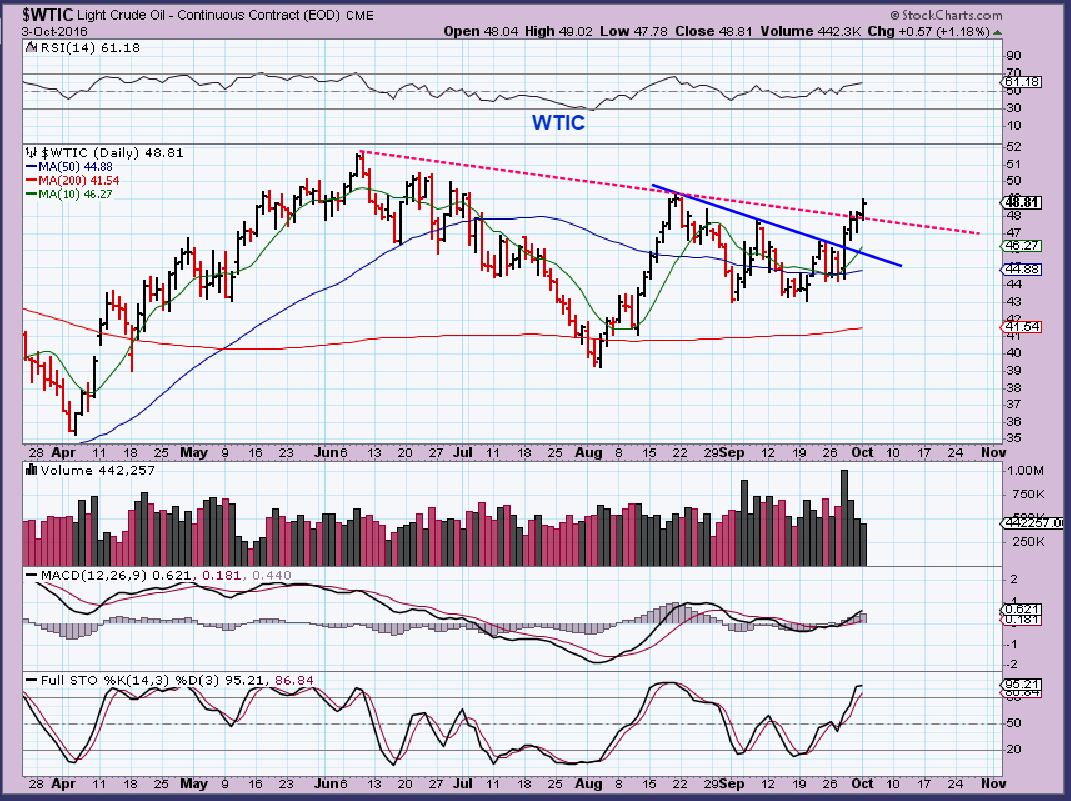
WTIC – Wednesday I said that this break out looked legit.
WTIC – And Thursday we saw follow through, but…
This is what I really want you to see …
Read more
Scroll to top