When I drew this chart in December, I was pointing out that I expected the Markets to be topping and Precious metals to possibly be bottoming. Notice how the 2000 top in the SPX coincided with Miners bottoming. Also notice how much that 2000 top looked like the markets in December.
.
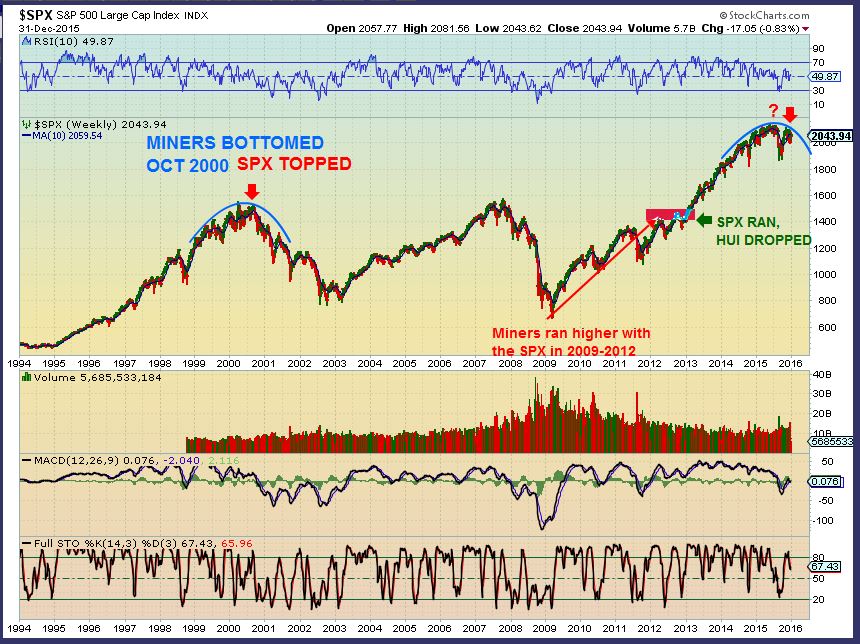
Well, we certainly did see the markets drop though out almost all of January.
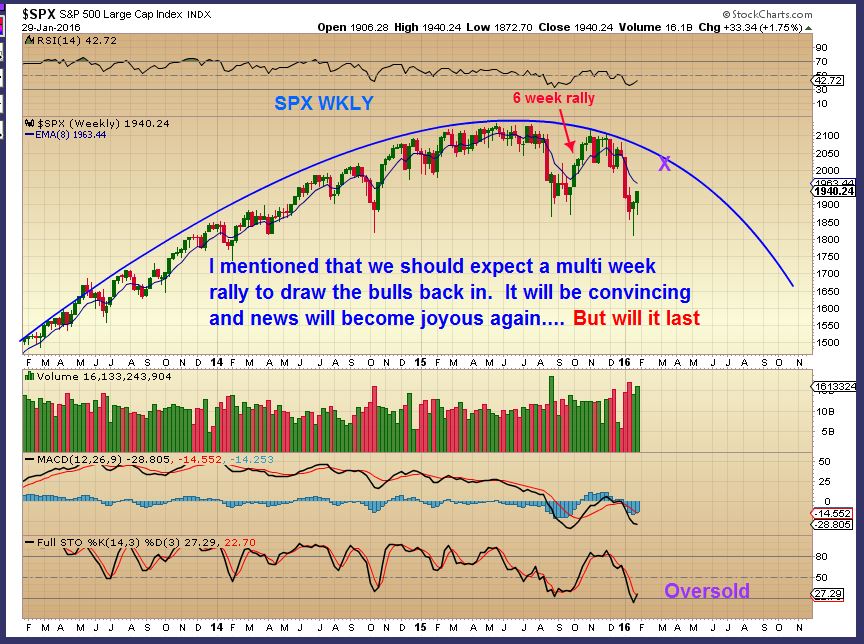
We had a 6 week believable rally out of the summer crash that got the Bulls long again. I expect that we may something similar now. But can we say that Miners bottomed, at least temporarily?
Lets look at Precious Metals
Read more
Over the past few weeks , there have been a lot of buying opportunities. Long precious Metals, ETFs that allow you to Short the markets, etc. I have about about 50 more charts (in addition to Part 1 of this weekend report) to further discuss the buying opportunities currently forming. To the charts …
.
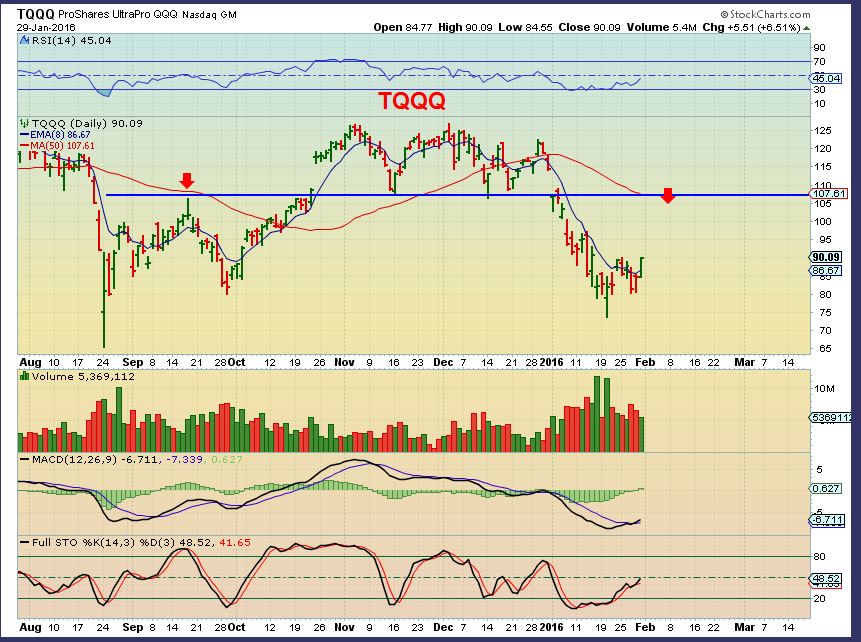
When The NASDAQ back tested that break…
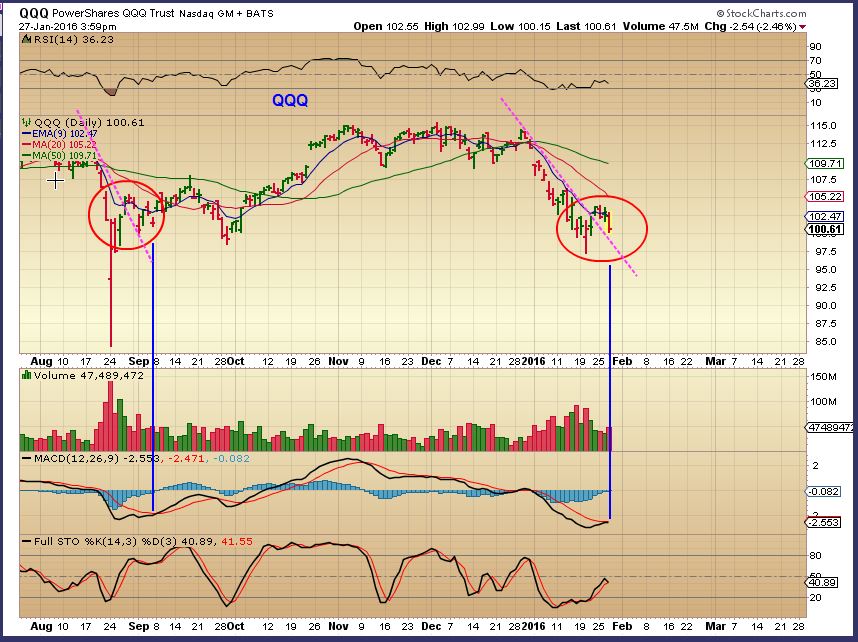
You could have bought TQQQ low risk at $80 with a stop right below the lows. Since I think there is more upside, it is still a buy if you ask me. Especially if we get a dip in the markets. See also ETFs like UPRO, SOX, AND TNA
There is much more…
Read more
We are getting the follow through that we expected in many different areas of the Market. The small pieces of the big picture continue to add up. Will it continue? Lets check the charts! 🙂
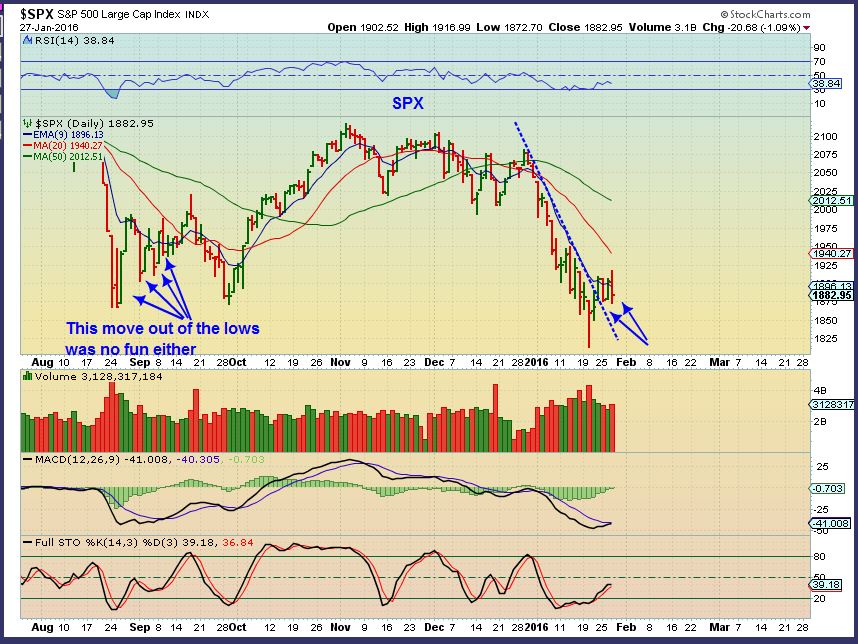
SPX Jan 27 – I pointed out that the drop mid week was normal, the same thing happened coming out of the August lows. I still expected a run higher.
SPX Jan 29 – Friday we got our follow through.
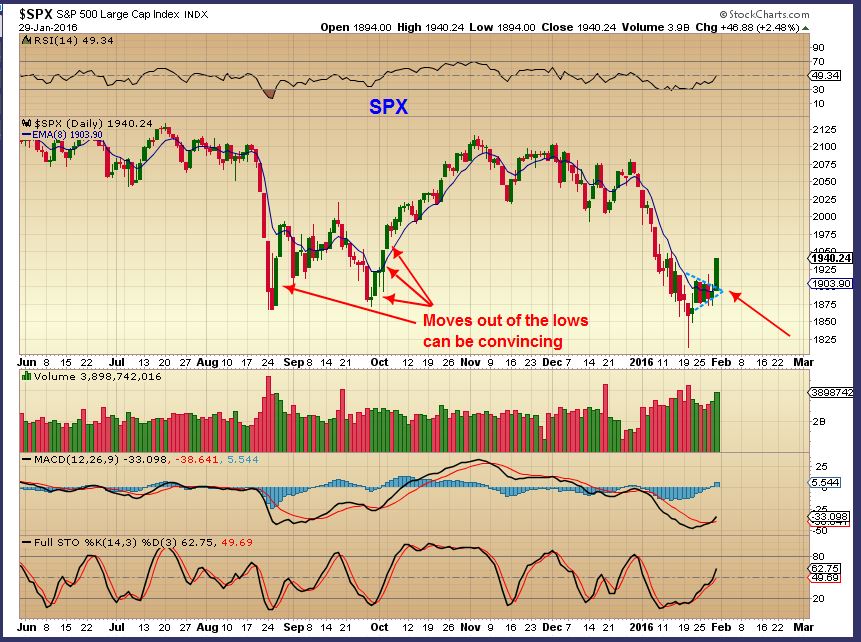
Moves higher out of the lows can be convincing, but will it lead to a break to new highs in a bull market, or a bounce?
Read more
Lets review the movement in various areas of the market that we at Chartfreak have been charting. We will look for Progress in what we have expected.
.
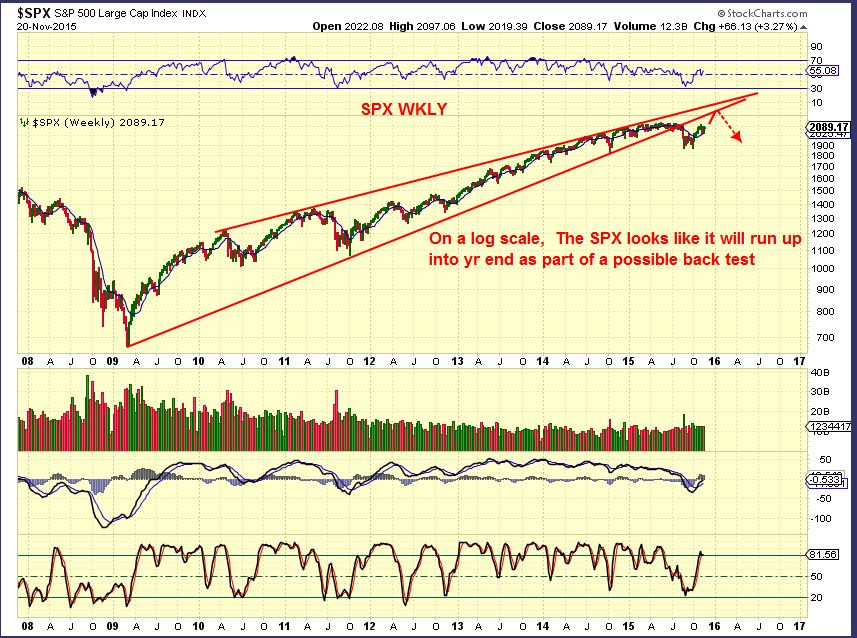
SPX Nov 20- We expected a back test and drop months ago when it seemed like EVERYONE was uber bullish
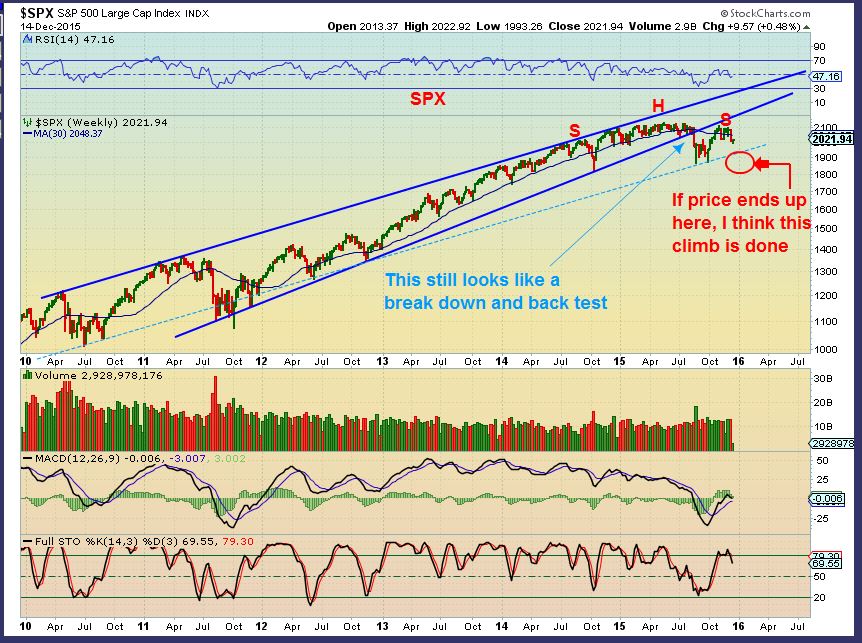
DECEMBER – H&S
Obviously we all know that January has been brutal for “longs’, great for those “shorting”. Is it over? Well I do expect a good size bounce soon ( multi week even) , but when everyone becomes bullish again, I’ll be watching the downside …
What about THE DOLLAR…
Read more
I wasn’t planning on a Friday report, but Thursdays action in several areas was important enough that I wanted to share a few charts. Also a reader ( we shall call him D.F.), pointed out an area of interest that I will touch on here too.
.
Lets start with the USD. I saw weakness and have been saying that I expect it to drop. I posted these charts last week.
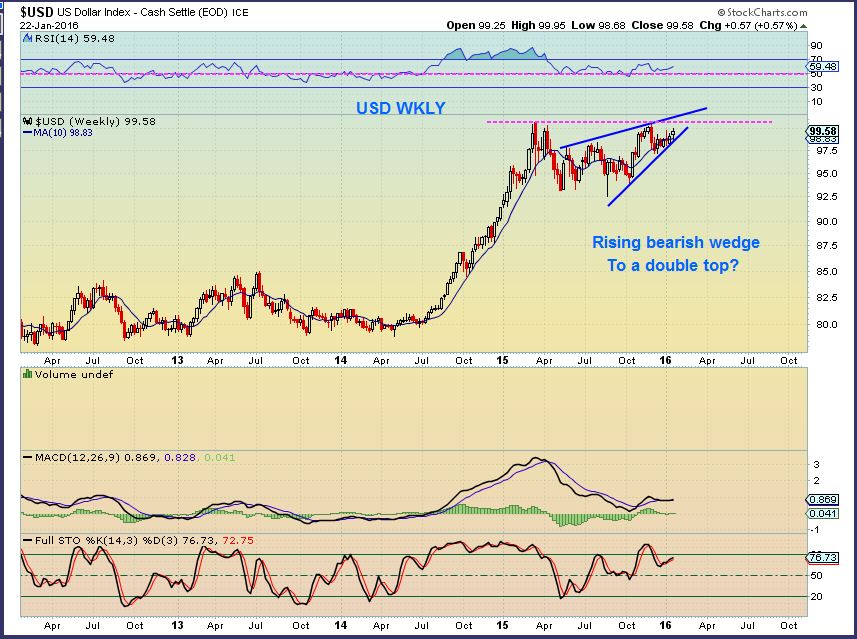
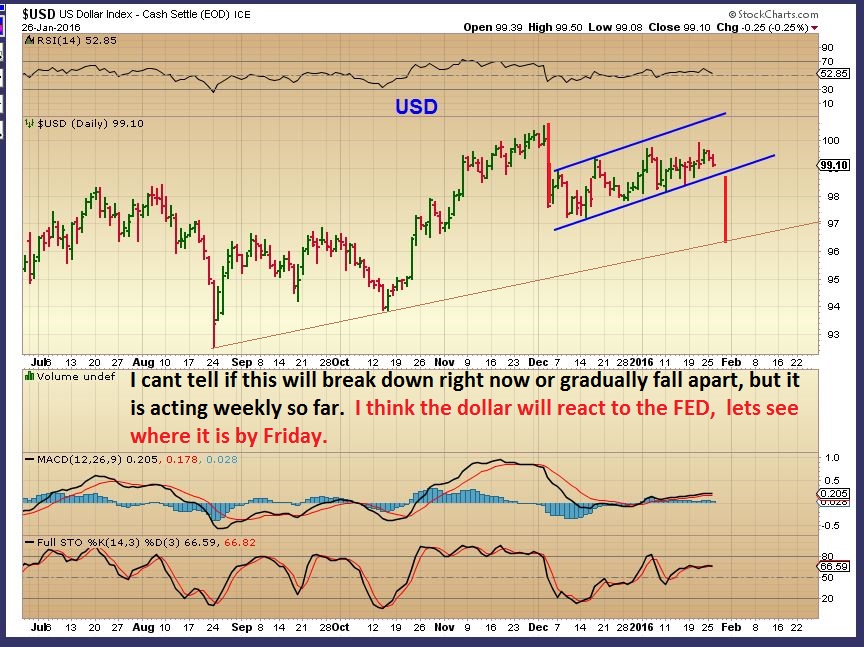
We have been in Gold & Miners for a while now, but a weak dollar could help Precious Metals and Commodities further. I will cover this more in the weekend report , but for now, what did the Dollar do Thursday?
Read more
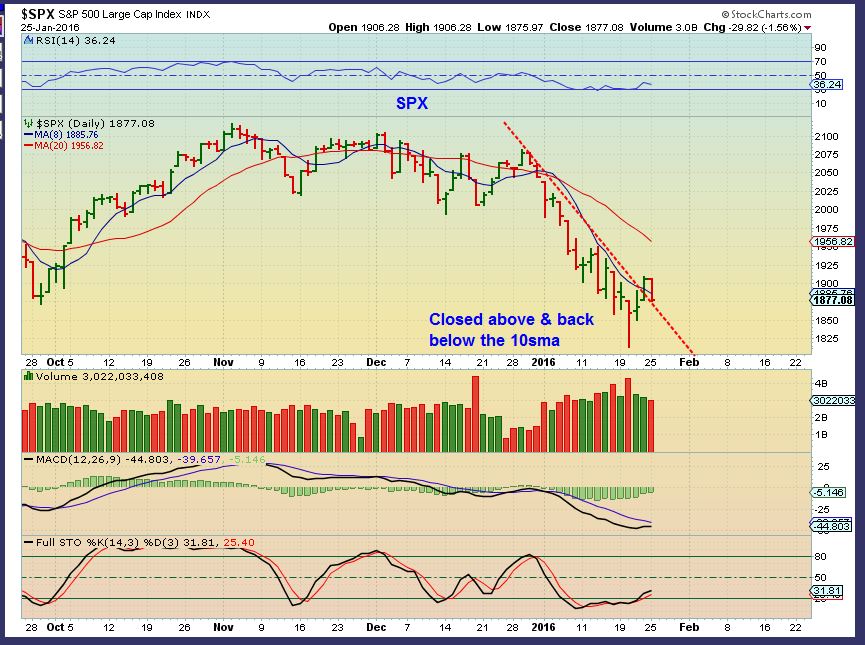
The markets are always dancing around on a Fed Wednesday, and often the volatility spills over into Thursday. Lets take a look at the charts and see what we can see.
SPX – The markets sold off after the Fed Decision. I called for lows recently and I still expect higher prices to develop from a bounce. You can see that this is how the markets moved coming out of the lows in August too. I do not expect the recent lows to be broken, but a little more downside is not out of the question. Please notice how difficult it would have been to trade the Lows in August/ September.
That being said, the RUT / IWM looks like a bear flag, so lets look at a few other areas.
Lets look at the NASDAQ…
Read more
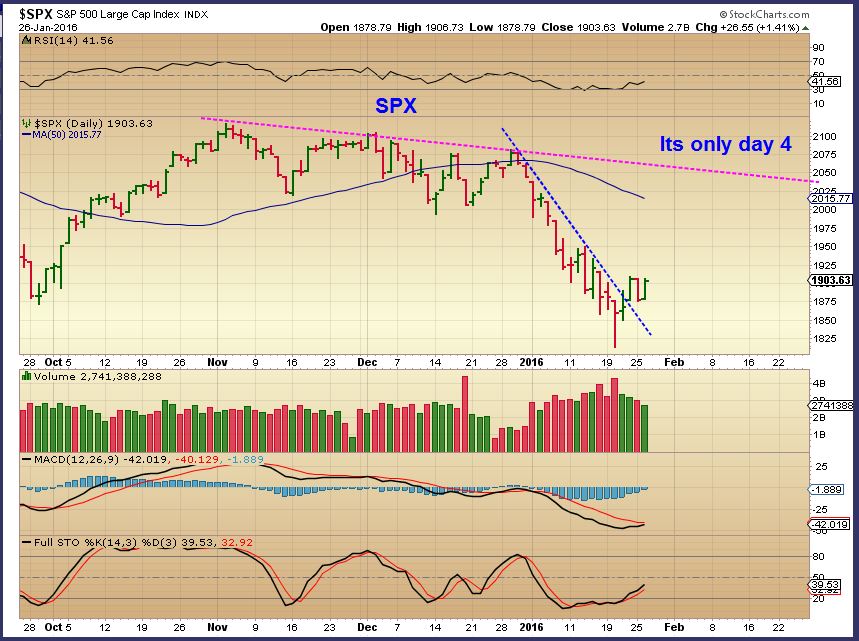
So lets just pretend that today is just a Wednesday like any other Wednesday. Things are playing out exactly as expected. To the charts!
.
SPX Monday – I called the reversal last week a trade-able low, and the Quick sell off Monday just a back test of the trend line.
SPX TUESDAY – It’s only day 4 , so I expect this run higher to continue.
Read more
Monday saw a little drag on various sectors of the market, but I still expect a bounce before another wave of strong selling resumes. WEDNESDAY is a FED day, so anything can happen, but Cycle timing is right for bounce.
The old saying is that a picture is worth 1000 words, and sometimes I see a chart that’s worth a thousand words too. The Banking index, for example , says a lot.
.
This is the Banking Index
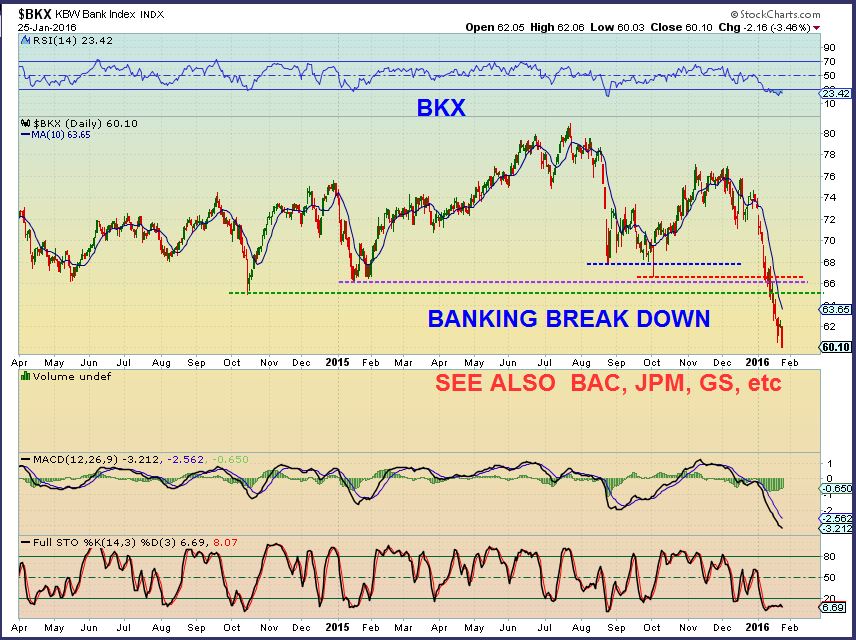
The above chart is quite oversold, but it is also quite unhealthy looking…
Read more
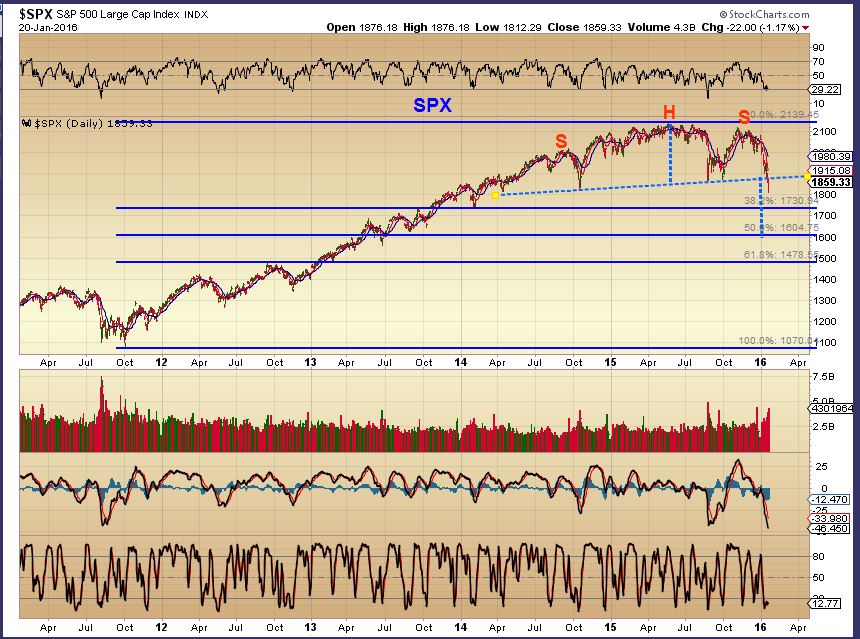
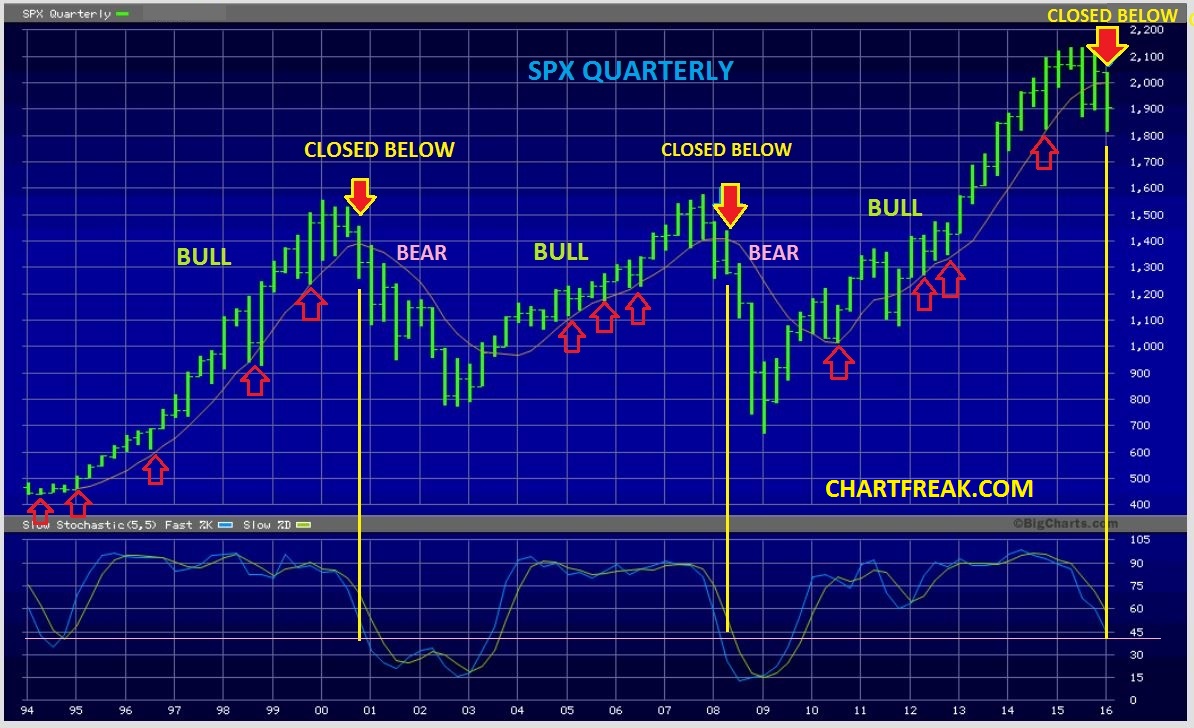
Here at Chartfreak , we’ve been looking at the short term moves for traders that are likely to occur as well as The Big Picture that may be changing. I expected changes, and that is what we have seen developing already in 2016. The weekend report had over 30 charts, so I thought that I would share a couple here with the public readers.
.
SPX QUARTERLY – They say that a picture is worth 1000 words. This speaks volumes if things dont change in a big way.
Lets look at a few other areas…
Read more
The weekend report will discuss the changes that we have expected for months, and how we now see those changes taking place. Also, as mentioned in the last report, the recent sell off is now changing into a Long position, but for how long? To the charts! 🙂
.
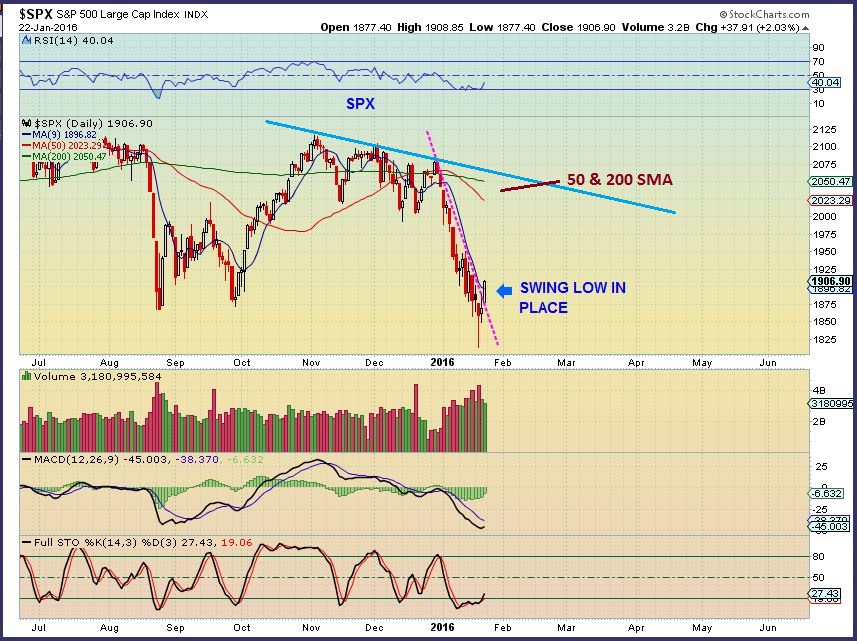
SPX – On Thursday, Jan 21st I mentioned that a swing low was in place ( Bullish for going long). It is safer to wait for follow through with a confirmation break above the 9 sma.
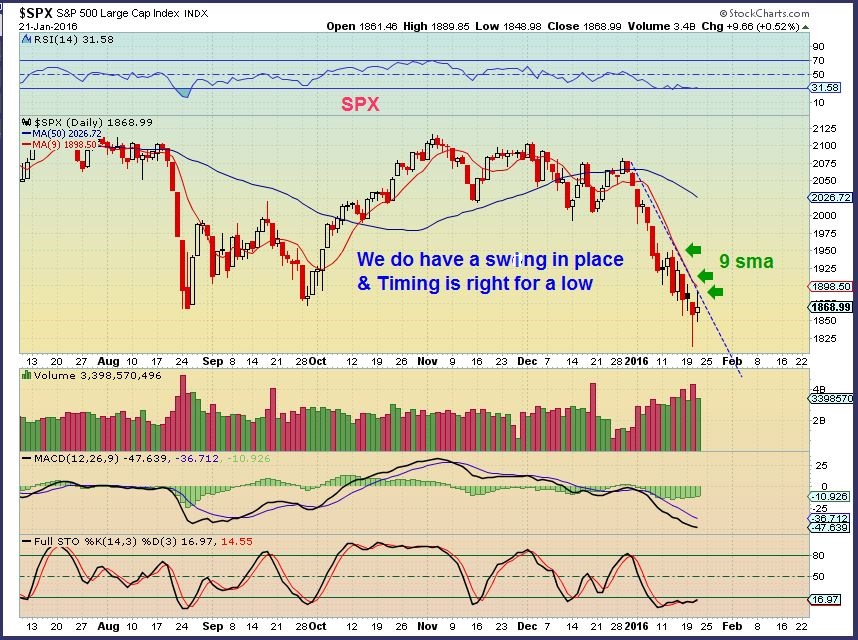
SPX – We had that confirmation on Friday. For traders, going long SSO, TQQQ,IWM, and various stocks was in place.
But please, lets not forget the Big picture too…
Read more
Scroll to top