Rockets

We have been on a rocket ship ride for a month now in Gold & Miners.  Whenever someone posts a "Rocket" as a headline picture in their report,  we usually immediately get a pullback.  I'm ready, so I thought that I would give it a try 🙂

.

This is the rocket (this was my chart from Feb 16). 

GOLD 2-16 b

We will discuss Precious Metals in a moment,  but first lets do a complete review starting with the SPX...

Read More

Still Climbing

Precious metals and especially individual miners keep climbing higher. Wave after wave, the dust buyers and shorts are getting hammered.  This wasn't entirely unexpected, that is why I mentioned taking some profits and letting partial positions ride.  This runaway , melting upward type of move can be rewarding, but cycle wise, it is will  pause or pull back soon.  We'll discuss that. The markets were moving up off of their lows too, but they stalled on Thursday.  Oil turned back down too.  To the charts...

'

  It's Friday, so there isnt much to say with only 1 trading day left, but lets take a look and see what we can learn.

This was 1 of my 2 Gold charts from Thursday mornings report. Gold actually hit $1240 as the day went on, so it looks like that flag pattern could form.  While it does look like that Flag pattern could form, I actually think we may see something else too.

GOLD 2-17

Let me show you what I think is happening now...

Read More

Public Post – OIL & GOLD

I'm going to share a portion of the premium report from Tuesday.  We had been invested in Miners from the shake out lows, but most of what was bought has had a spectacular run higher.  Now that there could be a consolidation phase in precious metals, does anything else look interesting?   Have you seen  VALE, FCX, CENX, etc?  Commodities are making some nice steady gains. I'm also looking at The Energy Sector among other things.  From Tuesdays report...


I think OIL is putting in lows  (temporary or permanent remains to be seen).   Lets discuss a few ideas as to why I think we are at lows in Oil. 

.

On November 13th ,  I said that my OIL WKLY target was $26.09

WTIC WKLY 11-13

Did we hit $26.09?

Read More

Mary, Mary, Quite Contrary, How…?

Even in the toughest of environments, we see seedlings take root and blossoms shoot up. We also see the same thing happen in the toughest environment in the markets.   At the time it may seem quite contrary, but this is also how bear markets can turn into Bulls.  Are we seeing that now?  lets look at some charts...

.

Starting with the SPX. We have expected this rally , but will it lead to new highs, or will it roll over?

.

I think that this move is just starting and it can last for a couple of weeks.   Notice how the Rally in October didn't lead to new highs and broke down to lower lows. We have lower highs and lower lows in the markets now. I have drawn in several resistance points and we will see how the markets react as time goes on. This is NOT near a point that I would short it.  I would remain long,  maybe lighten up in a week or so. The BLUE BOX is an idea of what we may see.

SPX 2-17

We will obviously discuss what's unfolding as time goes on, but take a look at this...

Read More

2-17-2016 Stretched

Yes, Gold and Miners got a little stretched in their recent run higher.  We now see a bounce in the markets  (Expected) and a pull back in the precious metals area.  Lets take a look at the charts...

Read More

Public Post – A Precious Metals Review

In a recent weekend report I discussed what I thought about the USD going forward, also using the recent action in the XJY as a historical guide.  It could affect Gold in a big way. This is important, since The Big Picture of the USD has paused and may be preparing to choose a direction to move in again soon.

.

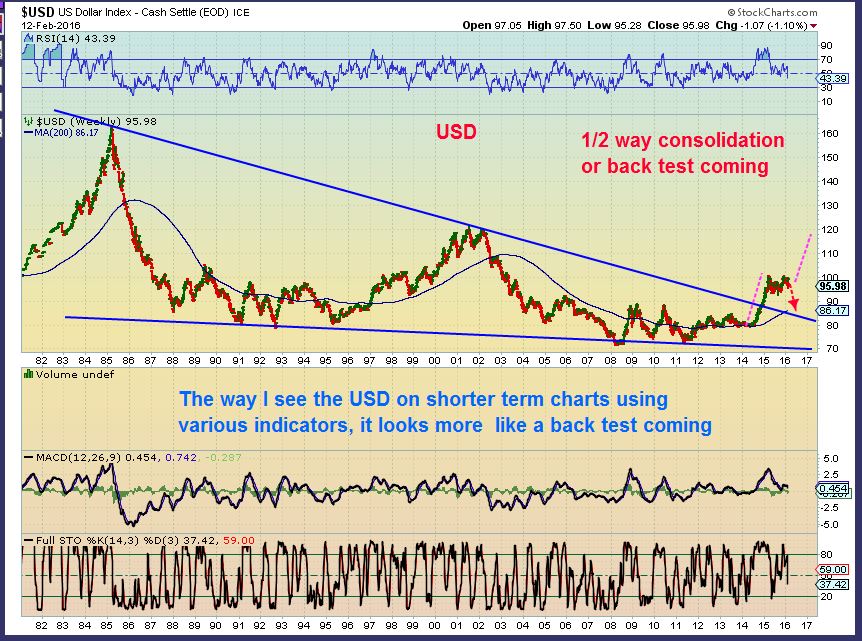
USD – After a strong run up in 2014, the USD paused and flagged. It could drop & back test the trend line, that would help Gold further. As a bull flag, it would run higher.  That might not be so good for Gold.

USD LONG TERM 2-12

.

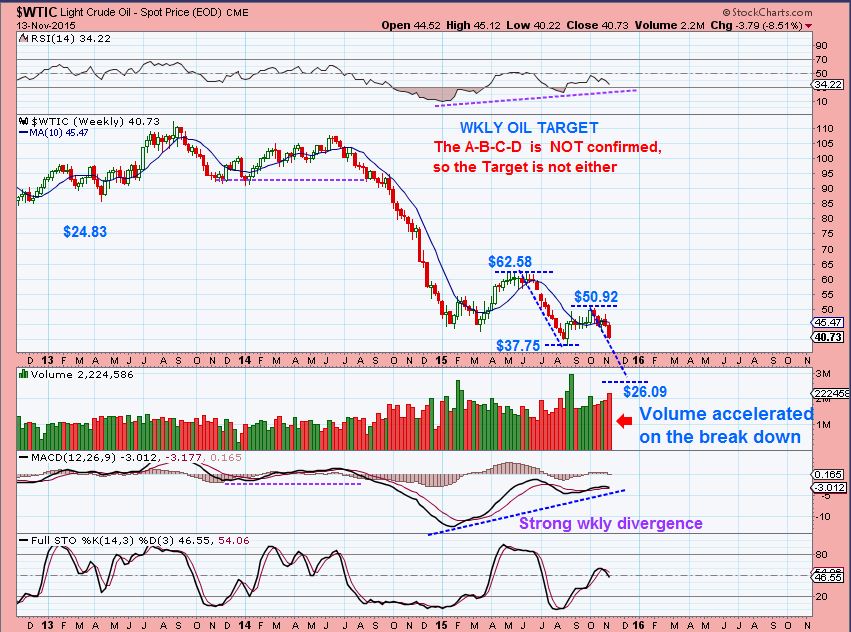
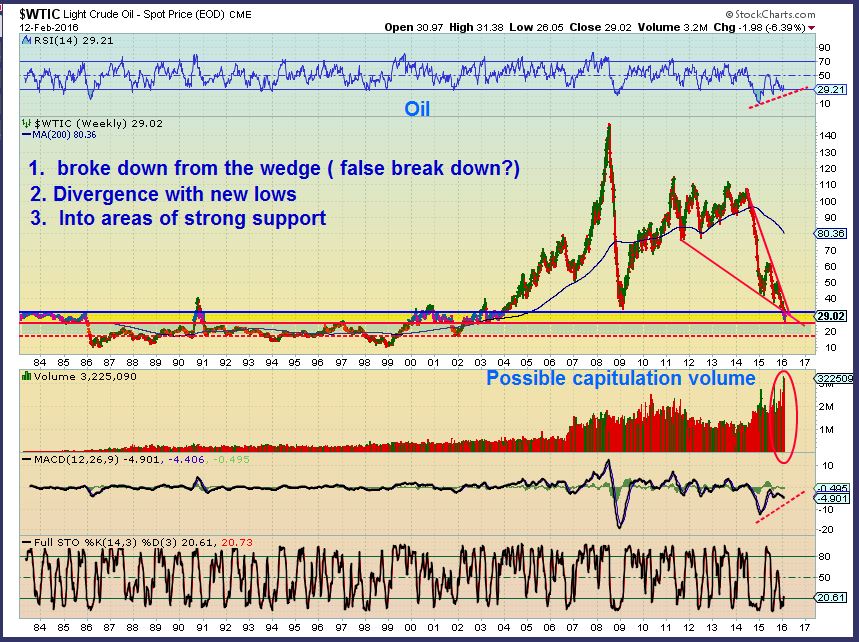
We are also watching Oils activity

WTIC WKLY LONG TERM– Oil looks close to putting in lows, but it has for a while now. Read the charts.

WTIC 2-12 wkly

.

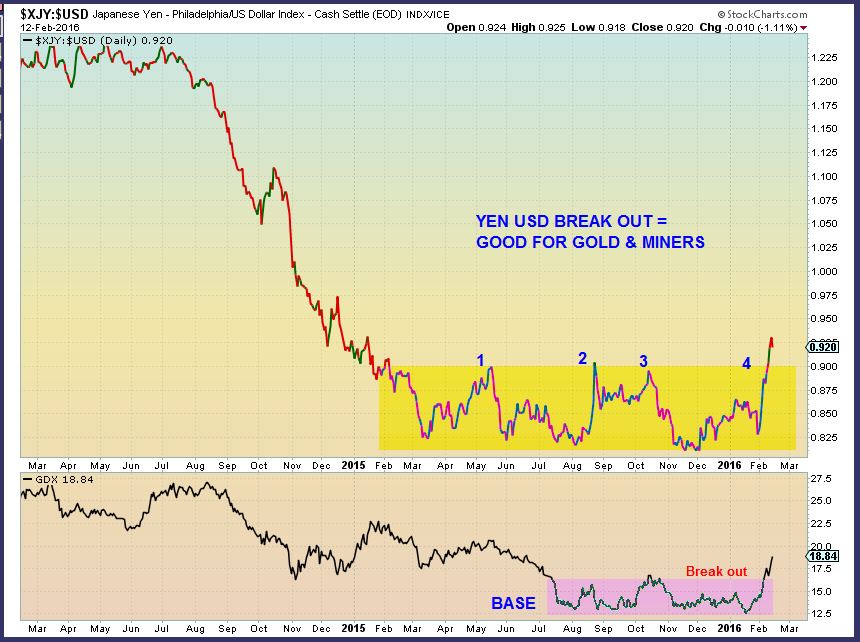
GOLD SILVER & MINERS


I had been following the possible break out in XJY:USD and in miners.  We see it here in this Feb 12th chart.  This evidence still favors Lows in Gold, Silver, and Miners,  as discussed in a prior report.

YEN VS USD BREAK 2-12

.

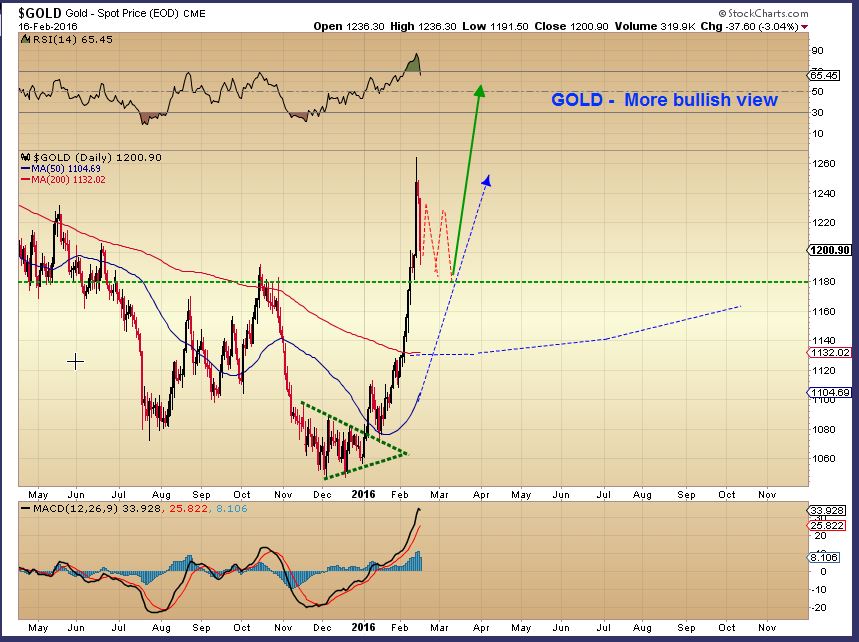
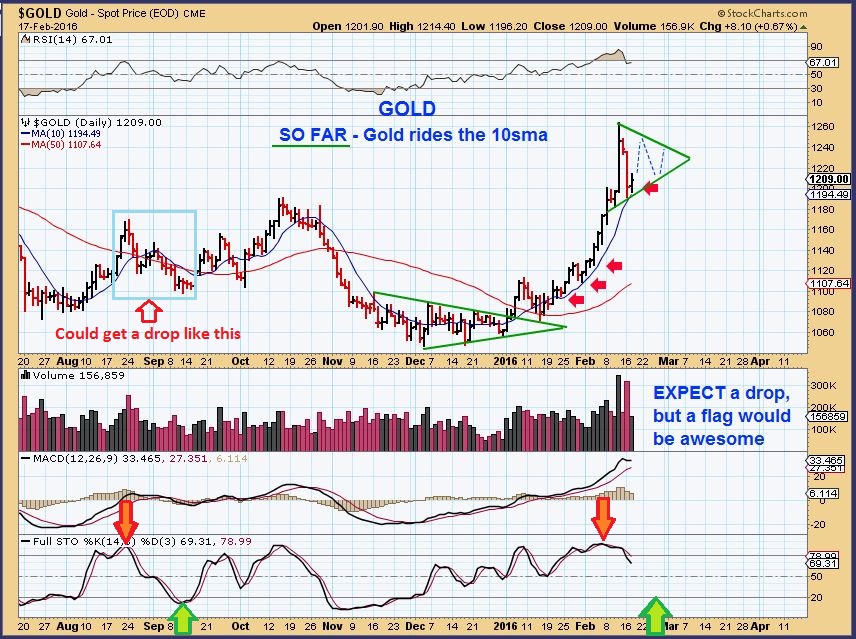
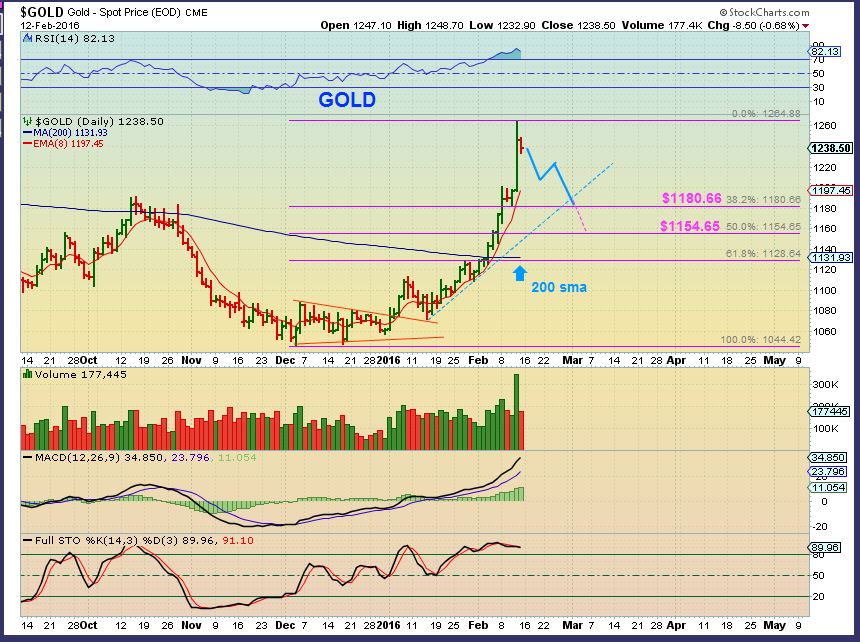
GOLD  I had 2 views for Gold, and it looks like this one may be playing with a pullback.

.

    I would expect that Golds price would eventually test the 200sma, but this can occur later when the 200 is rising.  Shown here is a possible 38% retrace back down to the top of the cup shown near $1180.  A 50% retrace is $1154.65.  Either is possible, time will tell.

GOLD 2-12


.

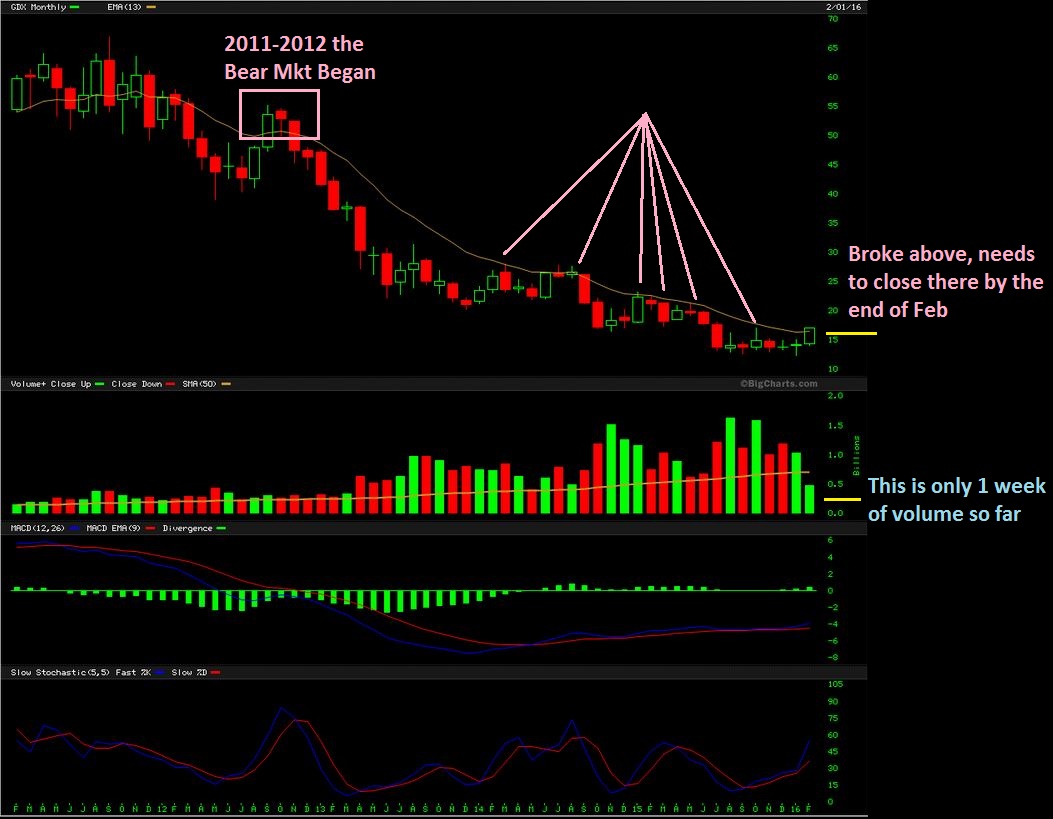
GDX  MONTHLY UPDATE –  This chart posted a week ago is one that I have been following for a while. I also posted an updated one in this weekends report.


GDX MONTHLY 2-5

.


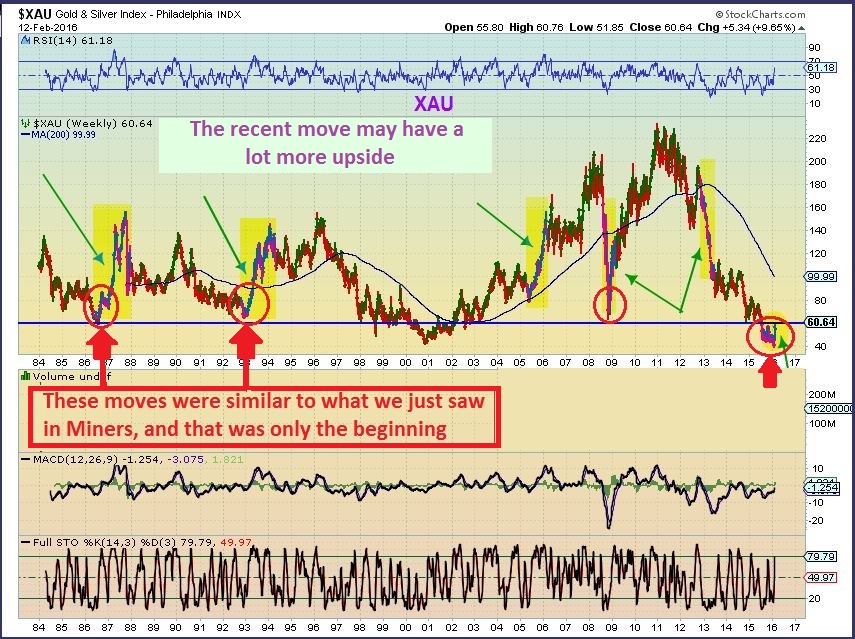
30 yr chart of the XAU.  Did you miss the last move?  It may just be the start of a larger run.  That move that we just put in looks tiny from this view.

XAU 84 thru now

.

We also reviewed some of the recent gains of the miners that we had discussed before.

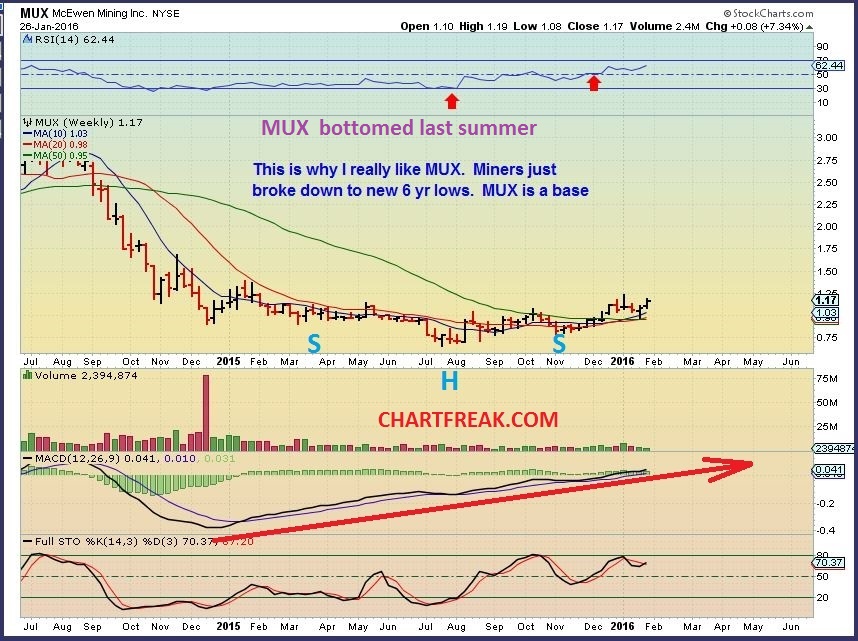
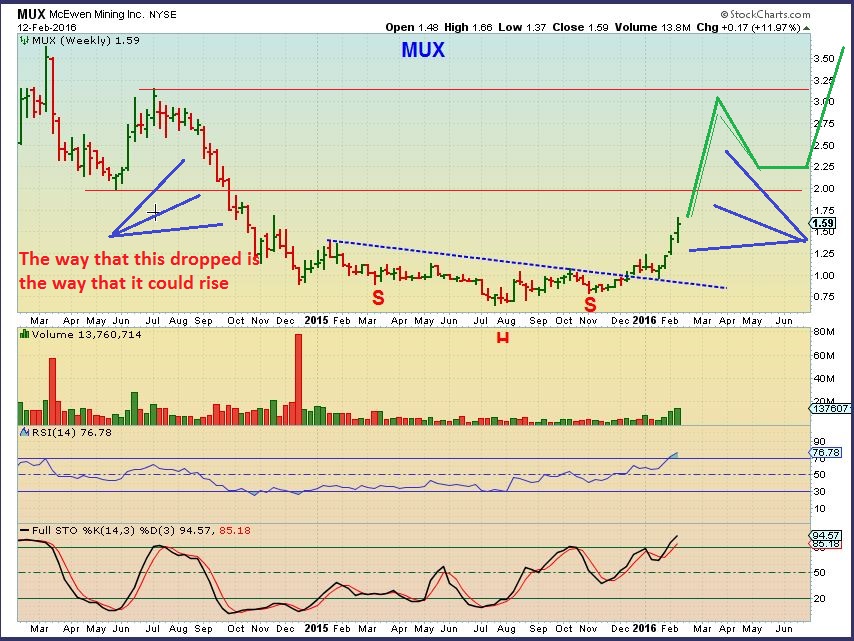
MUX– Look for the base.

MUX WKLY 1-26

The run has begun, and could mimic the multi week drop on the left on the way to the top.

MUX 1-12 wkly

 .

Even the ‘cheaper’ priced Miners have been running quickly with large %-Gains.

.

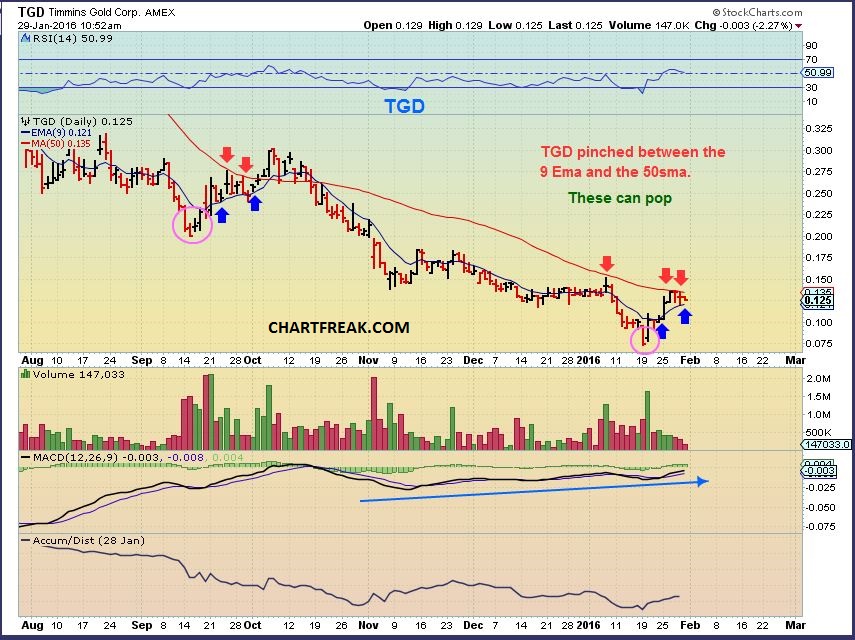
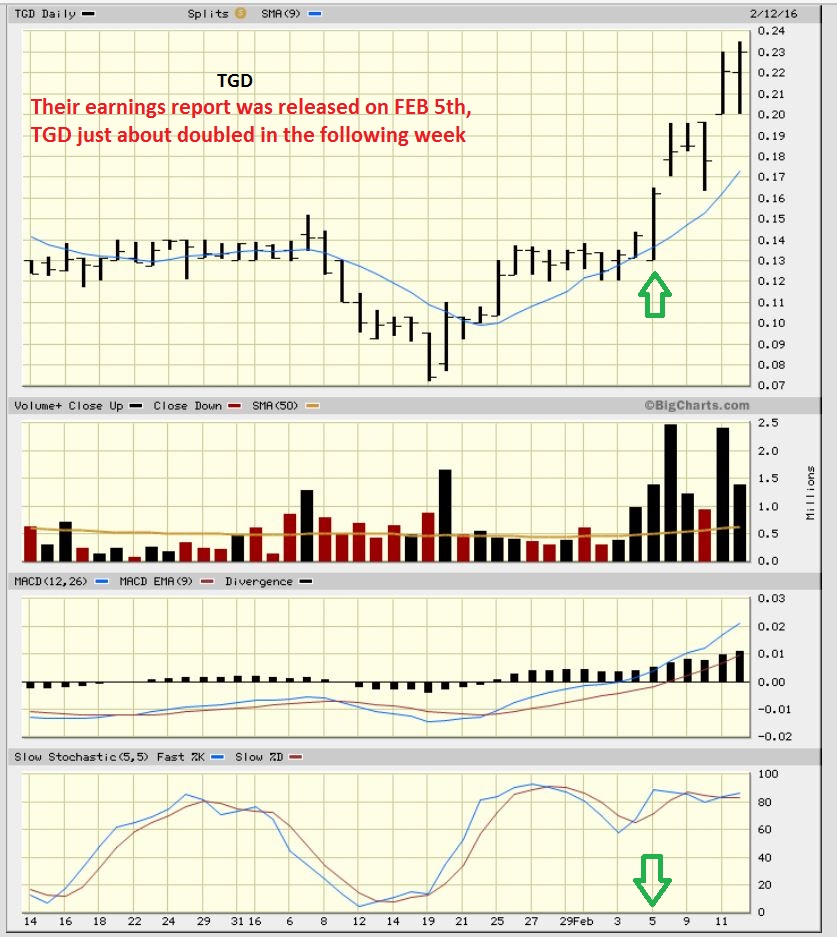
TGD was pointed out before it ran.

TGD 1-29

.


TIMMINS 2-12

.

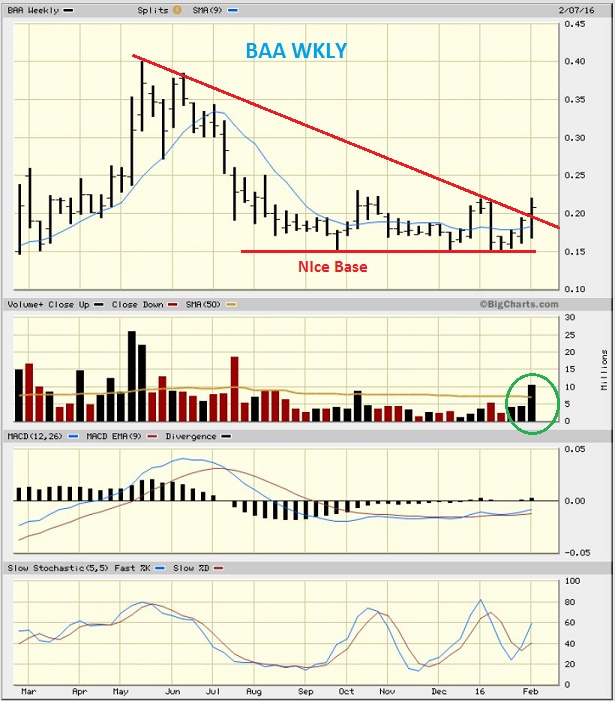
BAA and AUMN  are ready to launch in my opinion.

BAA

So we are definitely seeing many reasons for believing that the Big Picture is changing as expected.  The Bear market lows could definitely be behind us with that classic shake out move in miners in January. We see Gold and Miners breaking above prior Intermediate cycle highs.  Many that were stopped out and left behind may now have to buy later and that could push this higher too.  The set up is very encouraging  and we will be trading it and following it to the best of our ability here.  Some “Mining Stocks” may act individually and set up even when Gold itself is pulling back,  and that will be noted too.  We saw this type of action when several Miners bottomed months, even yrs ago.  Other may now have reason to do the same.   I will be hunting for and sharing trading opportunities in this sector with that in mind.

 .

Sign up here, click and scroll down

.

~ALEX

.


Weighing The Evidence

Bull? Bear? Bias?  We caught The Lows in Miners a few weeks ago, and the rally has surely gone beyond my expectations.  I now see many are calling THE END to the 4+ year bear market and calling the start to another phase of the Bull market in Gold.   So was the action of the past couple of weeks a guarantee of the Bear Market lows being in?  It's best to weigh the evidence and try to allow the facts to speak for themselves.  Lets continue to look at all of the markets and weigh the evidence. 

.

SPX BIG PICTURE - My readers know that I have been calling for the bear market drop in the markets since early last summer. We just landed in a very interesting place this week. Notice the dance around the 200 ma on a wkly basis since the 1980's.

SPX 2-12 wkly

Zooming in...

Read More

Whats A Melt Up?

What is a 'Melt Up'?  Most of us are familiar with a 'melt down' in the market,  so basically it is the opposite.  Either a stock or an entire sector can just sell off or get bought up into extreme levels, and then it still keeps going, not allowing the cautious investor an entry.  It may not be straight up everyday, it may run, pause, run again and again until the move exhausts itself.  This is what we will discuss in the weekend report, because it is possible that we could be seeing a 'Melt Up' in Gold and precious metals. They can last for weeks, with minor pauses.

.

This is an example of a small melt up. I used this chart to show the danger of trying to guess the top by buying DUST or Shorting Miners last week. You can ignore the writing,  just look at the melt up.

 DUST BURNED

. Read More

Safety First

Each trade that you take has some risk to it. Some trades are low risk  set ups with higher probability of success and others are just plain risky, depending on the set up.  We will discuss that a bit later in the report. 

.

SPX- The Fed didn't change this chart very much.  I still see similarities between the double bottom in Aug & Sept, but it is weak. Notice the candle for Wednesday rallied on the Fed and gave it up.  The buy the dip crowd is weak. We are not oversold yet, but getting there.

SPX 2-10 . Read More

Moving Forward On A Fed Wednesday

Today is sort of a Fed Wednesday. It doesn't mean that there will be some big surprises, and in fact I do not expect anything like that, but I didn't want us to go into this blind folded. Certain areas of the market are due for reversals in my opinion, and a Fed testimony before congress can act as a catalyst, even if nothing new is said. Lets just Look at the charts.

.

Tuesday the NIKKEI was down 900 points, and it is currently down another 400 this morning, but...

NIKKEI

They couldn't get the sell off in the U.S. going.  THAT should have sold off the U.S. markets if they are going to drop In My Opinion.   I've been expecting a bounce, no change.

SPX 2-9

I have mentioned that when I look at the Banking index, it broke down and is struggling at lows...

Read More