The markets have a way of maintaining themselves, and that is through corrections. I believe we have started a few ‘corrections’ now. Any pain from these corrections should be short lived this week, since the markets are actually closed Friday in the U.S. Today is the last trading day of the week. Lets take a look at the markets.
.
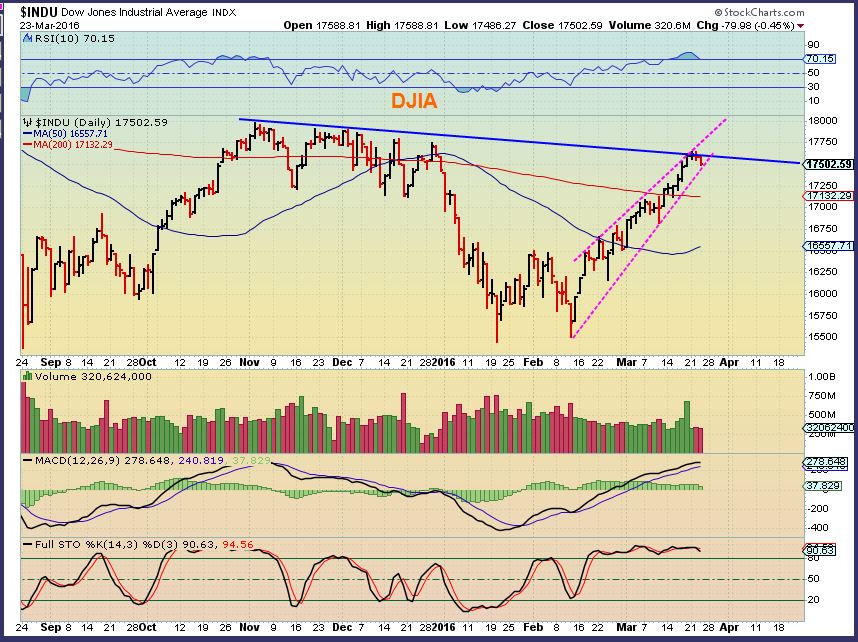
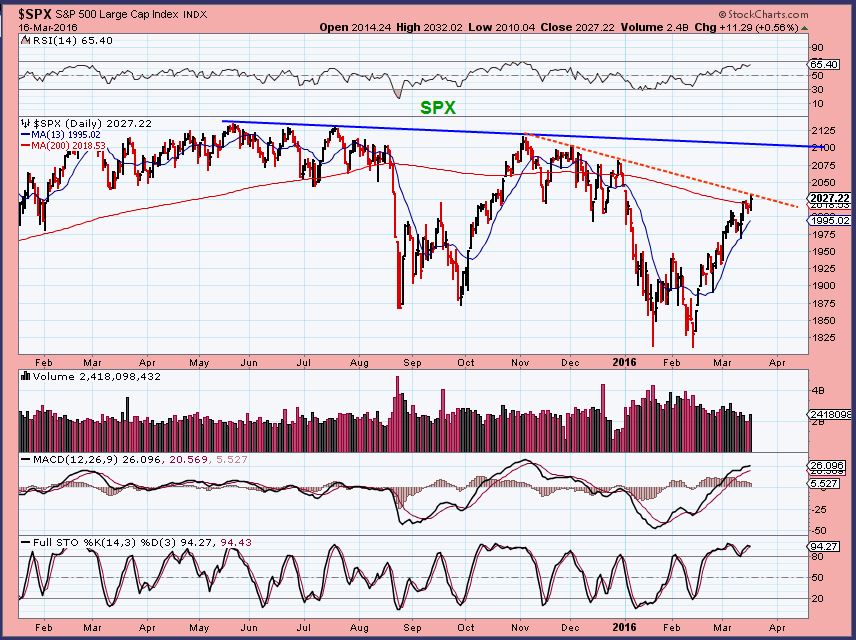
SPX – I have been pointing out this rising bear wedge for a while, expecting a correction. I believe that it has started.
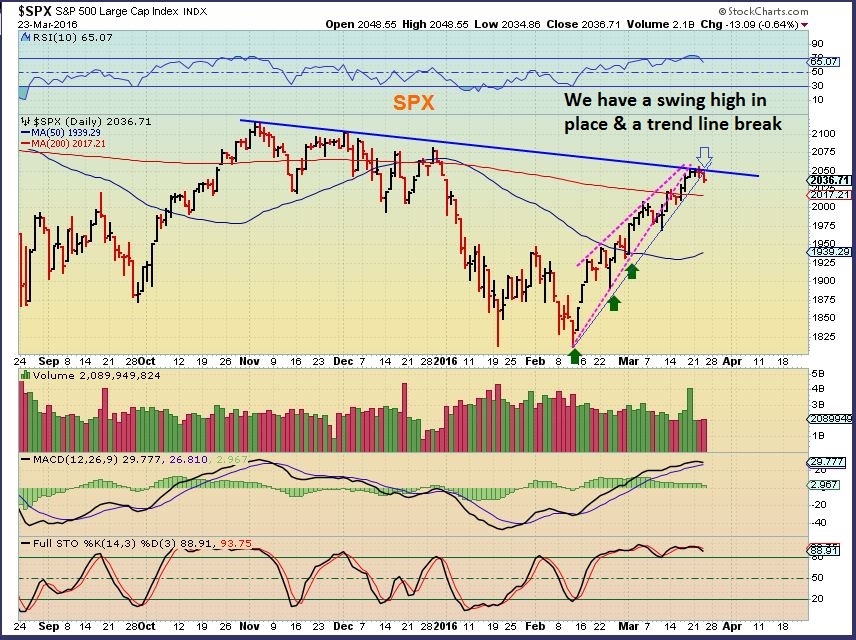
The Dow looks the same
Read more
If you’ve heard of 3D Printers, raise your hand. Not a whole lot changed in the markets Tuesday, so after a quick review, this is one area that we’ll discuss today…
.
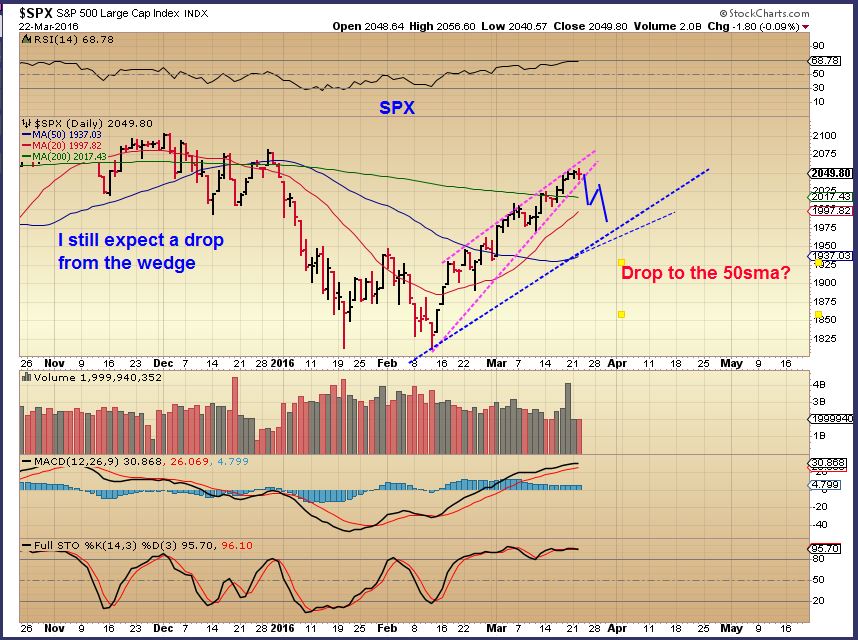
SPX – No Change in my outlook from the past few reports. I expect that this daily cycle is topping.
Read more
This rally has played out pretty much as expected, but I want to point out some interesting changes in character that could affect future trades / trading.
Read more
The weekend report discussed Turning Points. Though I have laid out my big picture expectations, I also mentioned that at turning points it is important to continue to examine clues from an unbiased view point. Sometimes subtle changes at turning points can either alter the bigger picture or confirm it. I discussed a few changes developing in my weekend report, so lets continue to examine any clues that may appear.
.
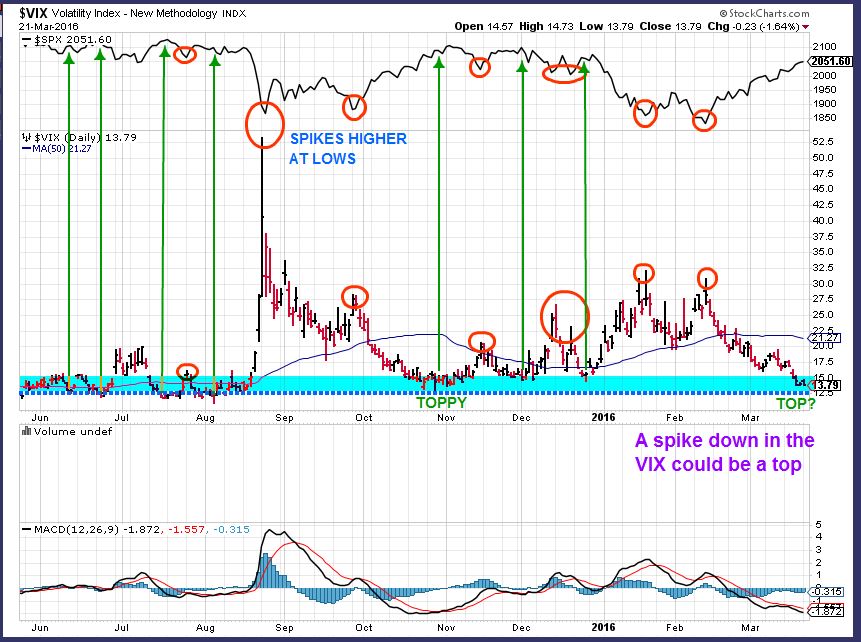
SPX – Our run higher still resembles the run higher last fall in many ways. I am expecting a dip down into a DCL soon, but the move out of that daily cycle low is going to be important to watch. It is not time to short this market yet. As the market rises , I see a bearish wedge and lighter volume. We wait for the dip.
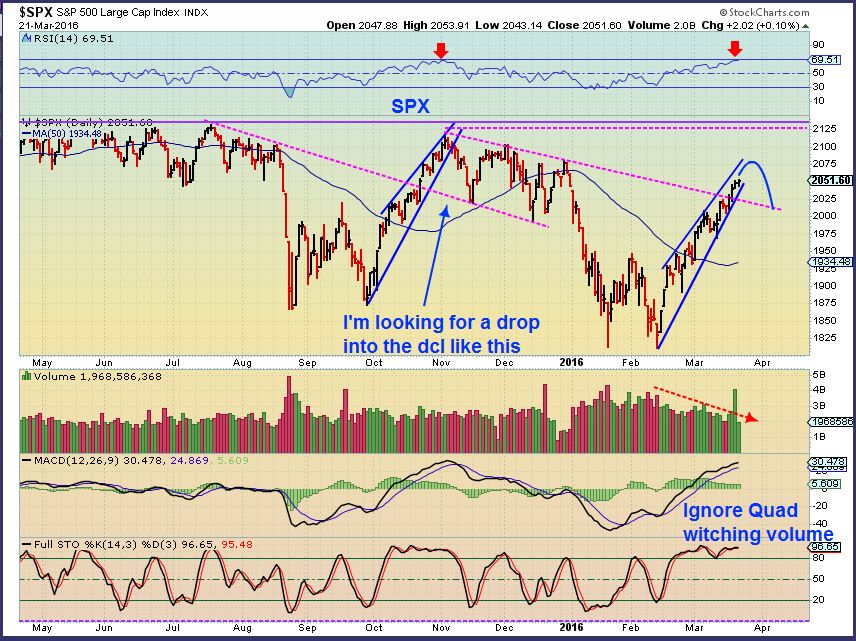
Usually at tops (even temporary tops) , the VIX gets down near $12 -$13. Spikes higher in the vix can lead to bottoms, and a spike lower can signal a top. The vix is low enough, but a spike lower would probably signal a temporary top.
Read more
It doesn’t matter whether markets are rising or falling, sooner or later, they hit a turning point. We have a lot to discuss this weekend regarding those turning points, so lets dig right in…
.
SPX – Whether we started a bear market or not, I still expected a strong rally when we were at recent lows. It would draw in bulls, but what comes next after 6 weeks higher?
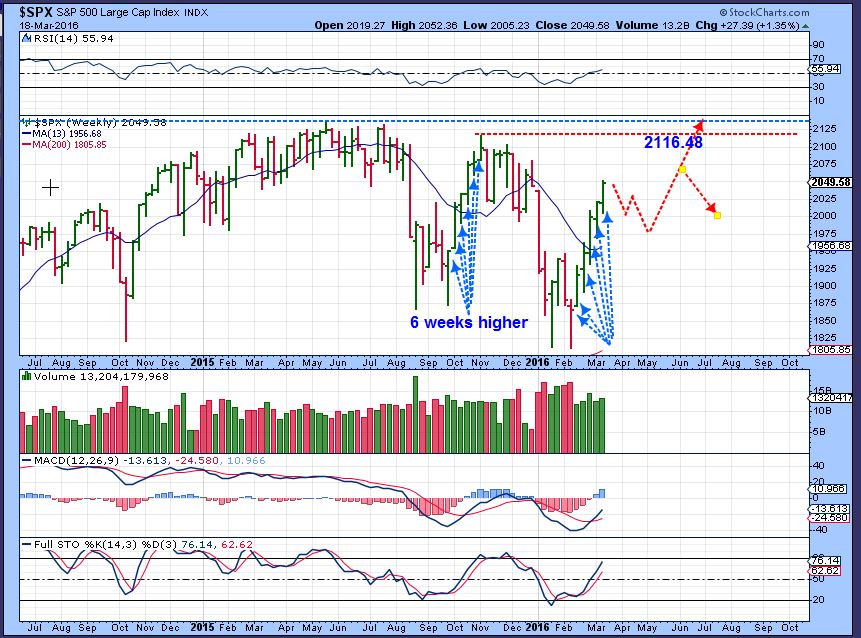
This rally has played out pretty much as expected, but I want to point out some interesting changes in character that could affect future trades / trading.
Read more
Quad witching can add volume and a little volatility to the trading day, so I just wanted to do a review of the markets and discuss a few trades.
.
Let me start with the IWM this time. I actually like this set up for a run to the 200msa. We’ll see if Quad witching helps or hinders things. This does look bullish.
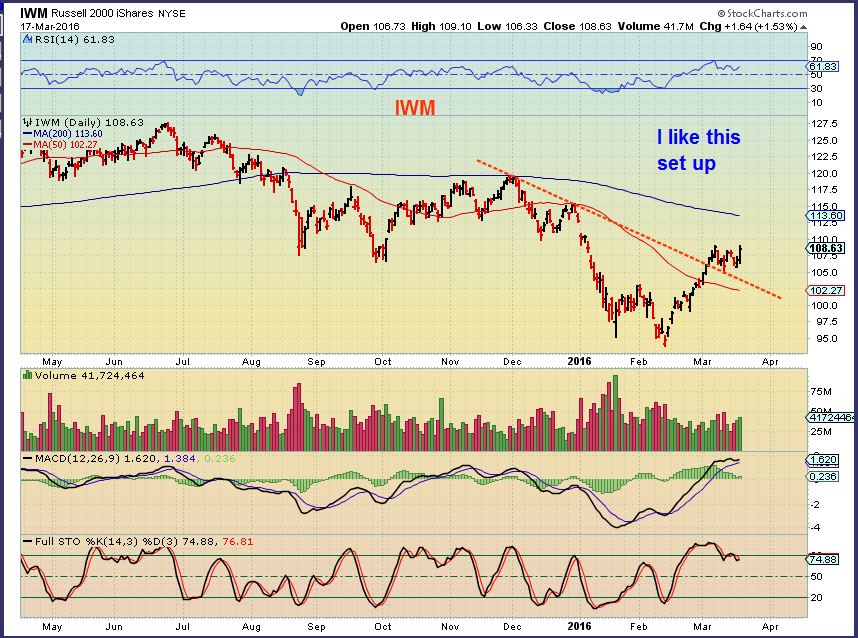
I wanted to start with the IWM, because…
Read more
In the premium section of chartfreak, we’ve discussed using Low risk entries to take a position in a stock, but what makes them low risk? Lets take a look at a couple of examples.
.
First, we have been trading sectors that looked to have bottomed recently after seriously selling off . They give evidence of little downside and greater upside. As pointed out here in recent weeks, we’ve traded Miners since January, and Commodities and Oil since February. Lets look at commodities for example.
.
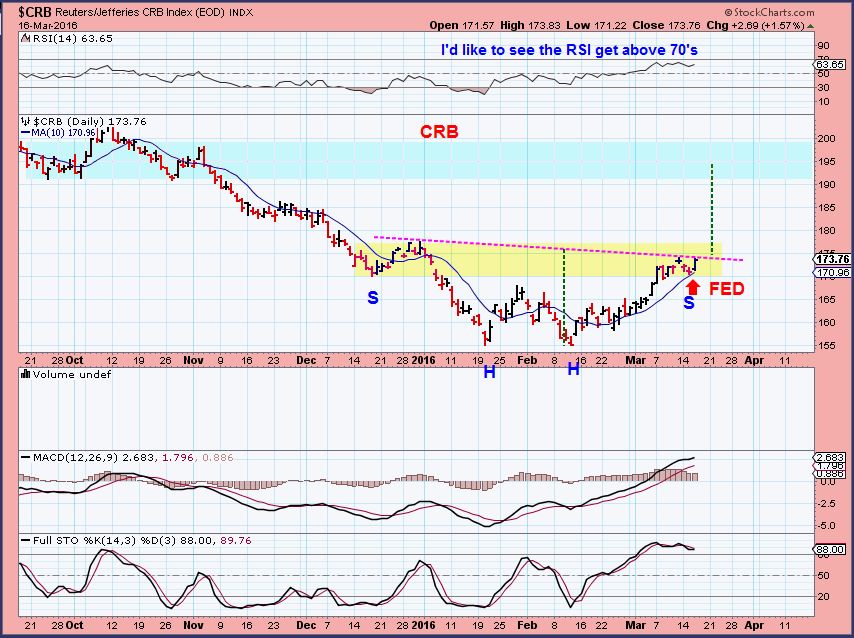
CRB – We caught commodities after the second bottom formed with divergence. The commodities chart still looks bullish after consolidating for a week heading into the Fed Meeting. I believe that this can run higher now.
.
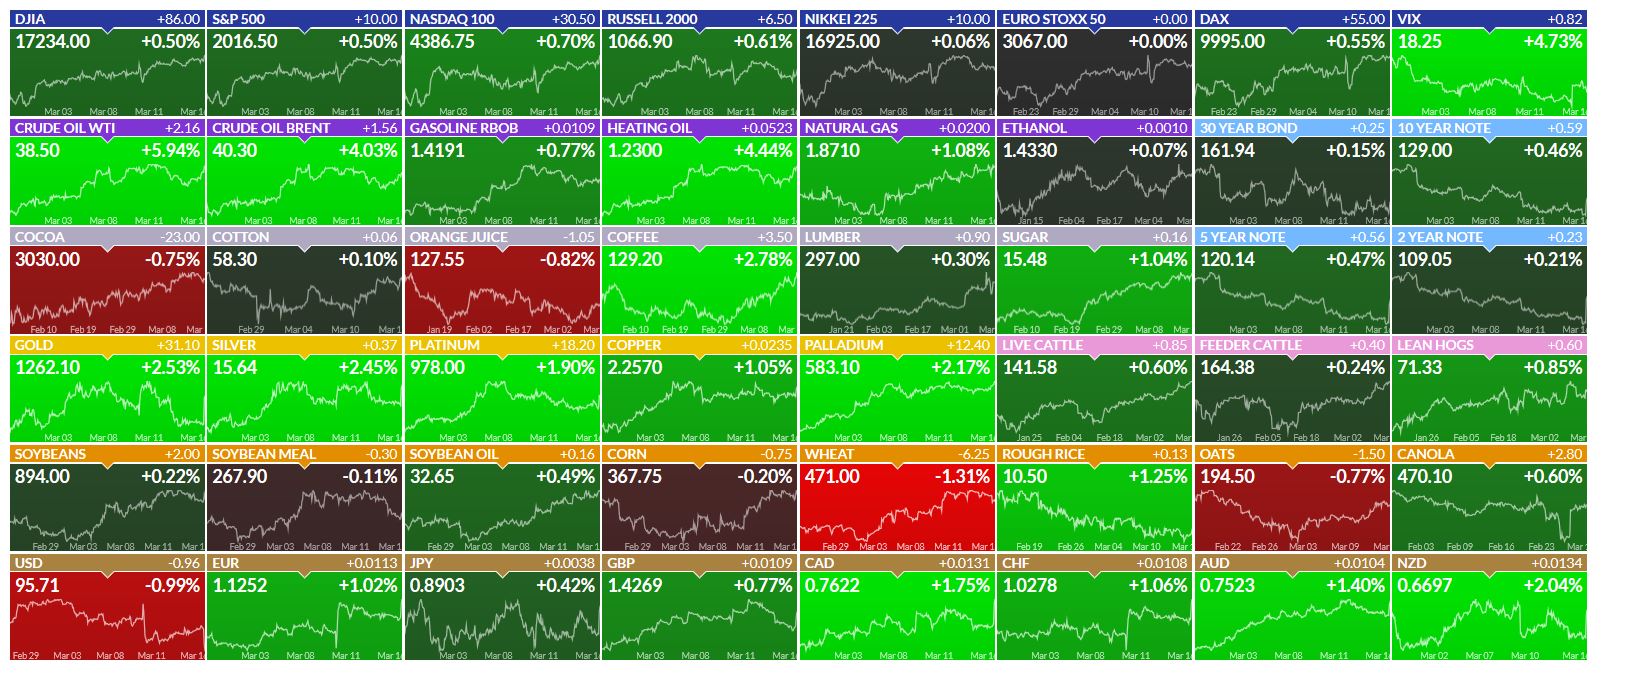
We’ve been watching various Metals stocks pulling back or consolidating after running higher recently. See stocks like X, CENX, AA, FCX, VALE, CLF, STLD, Etc .  Look at The sea of Green in various Commodities after the Fed Decision was released.
.
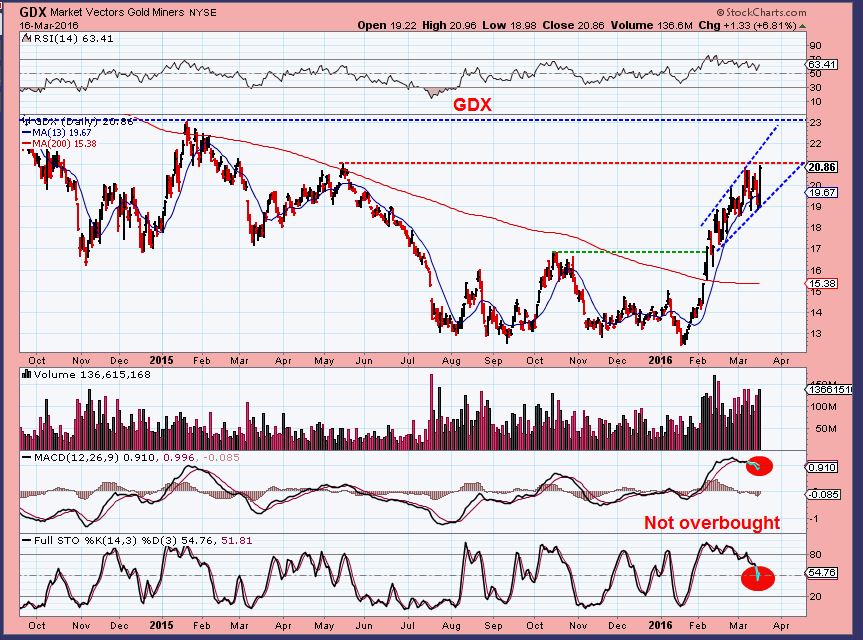
Sidenote: While I believe that individual MINERS may have a little upside left, Cycle timing says that they should actually be maxing out soon. We will be prepared to buy the pullback at a low risk point. Short term traders have been given charts and instructions to trade individual Miners if they want.
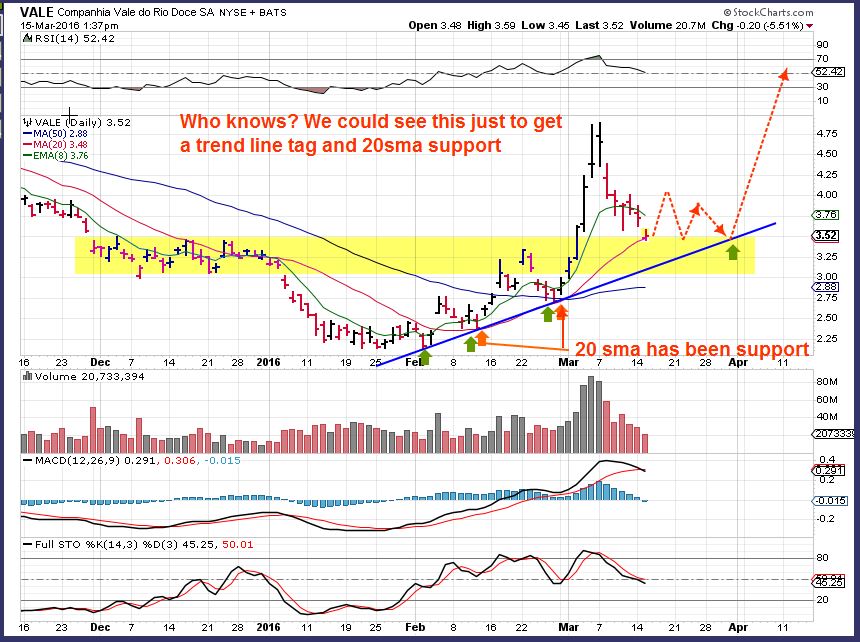
So lets look at my recent lessons on trading and then watching a stock like VALE pull back after a nice run higher.
.
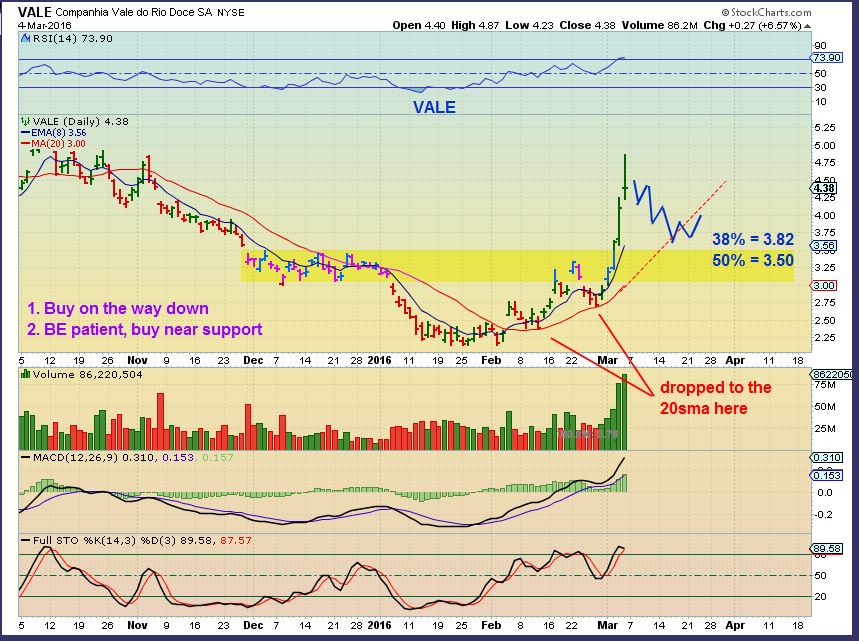
VALE – I bought Vale near the gap fill in the $2.50 area, after watching commodities bottom. On March 1st, a second lower risk entry point would be the break above the 50sma and trend line back test too. Why low risk? Because you could place a stop a little below those moving averages to limit risk if the trade goes against you.
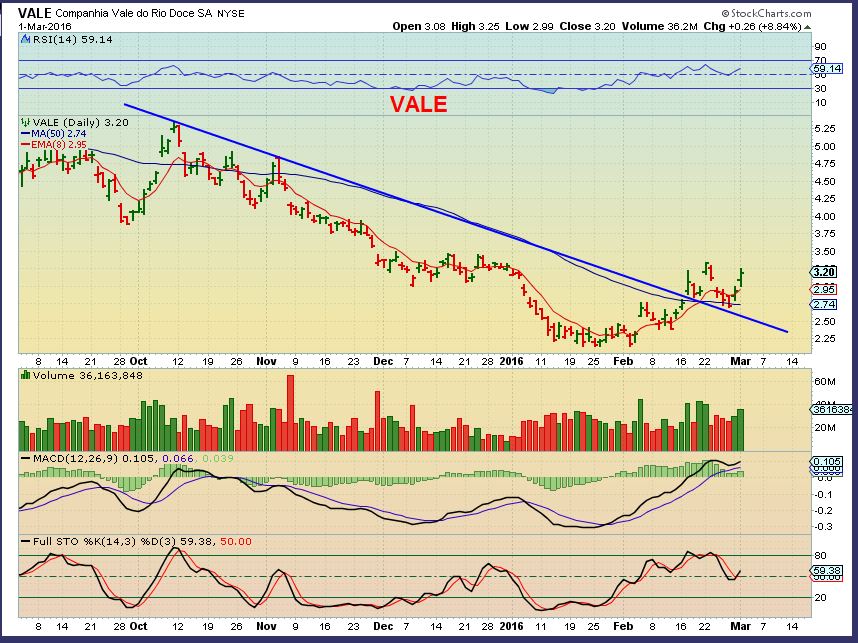
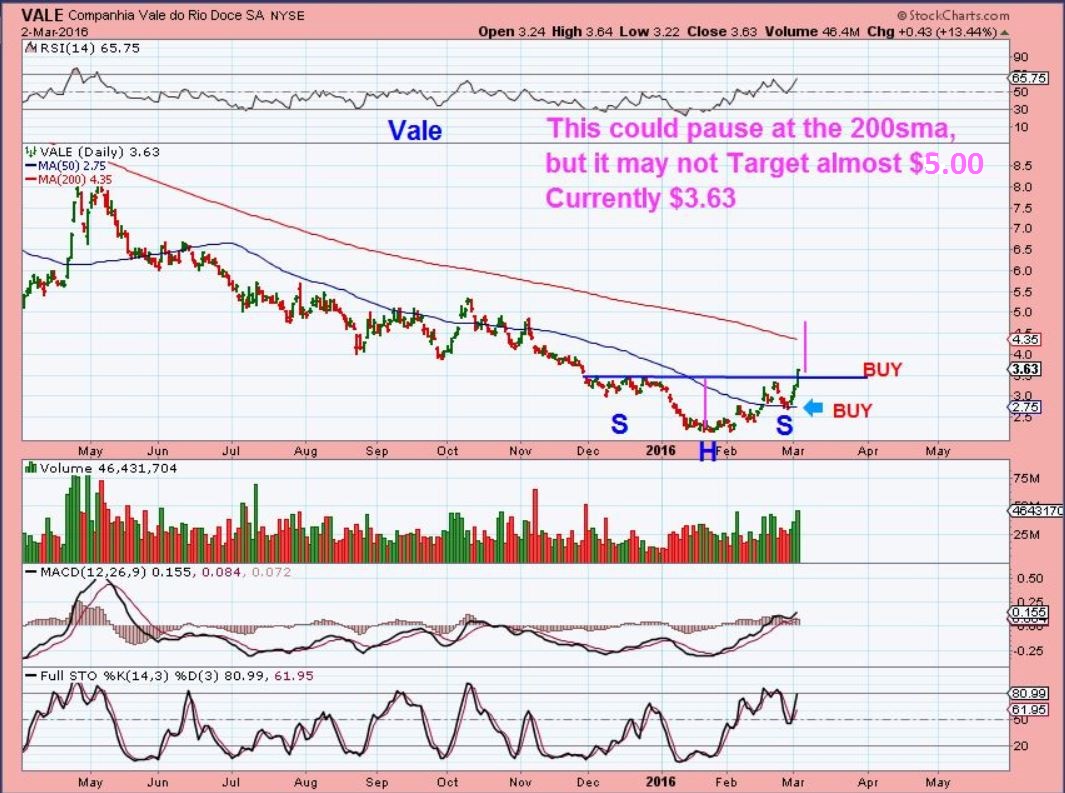
I called for a run to the $4.80 – $5 area using this inverse H&S , and began to sell on the way up over $4.50.
.
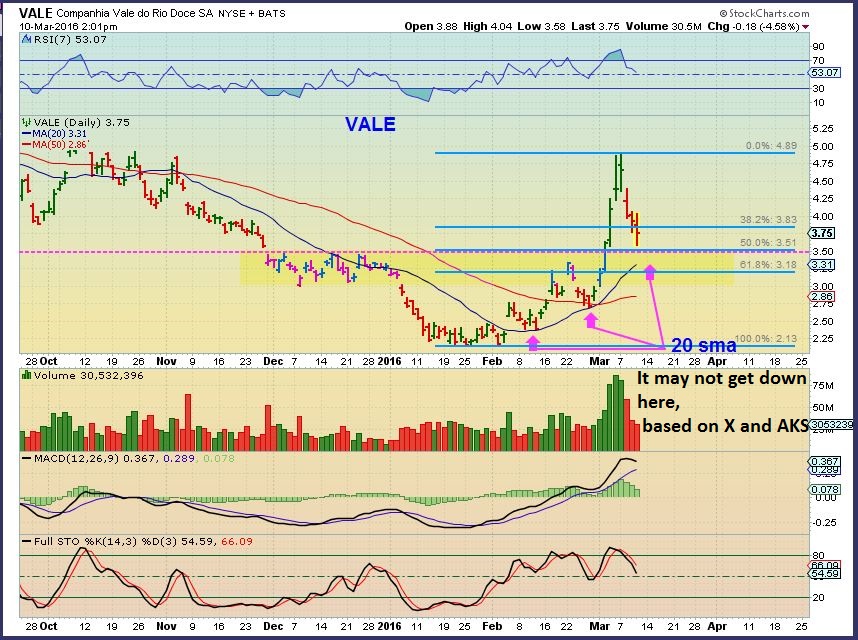
Then after the run fulfilled (Topping candle), we had to look at a logical place that Vale may drop to. These were two ideas, if vale had in fact topped at that $4.87 high & reversal. We’d be looking at the $3.82 and $3.50 area for starters.
Vale almost hit the 50% retrace on March 10, and volume was lightening up. The 20sma was entering that $3.50 area.
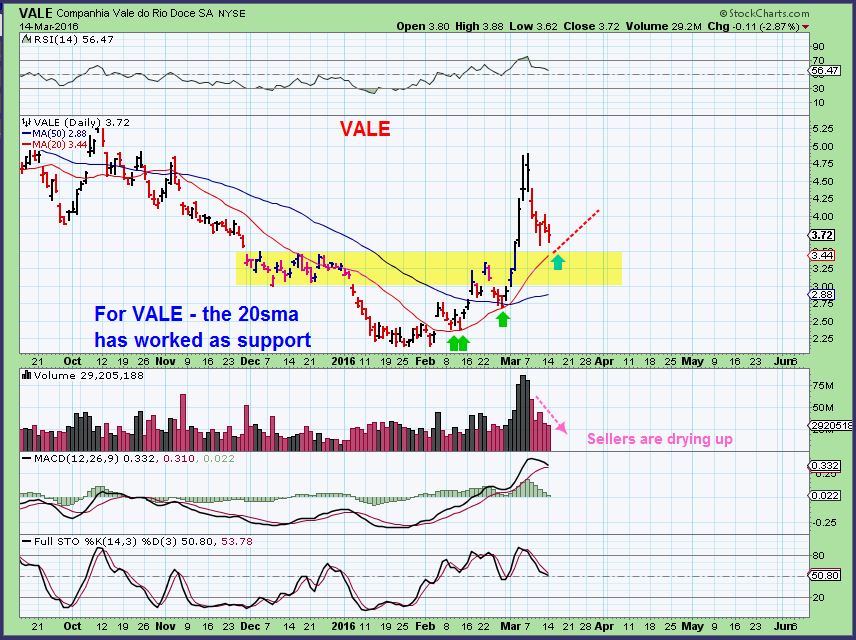
March 14, selling was slowing up in that support area, and I mentioned that I started a position. I started small, because this ‘could’ still drop to the 50sma, but it was above support ( Yellow) .
VALE – Vale pulled right back to the $3.50 area as hoped for Tuesday and also on Fed Wednesday. It took off after the Fed Decision. I captured this chart at 3:30, but it closed even higher at $3.99. So you can see why that was a low risk entry. That doesnt mean that it will go straight up from here though.
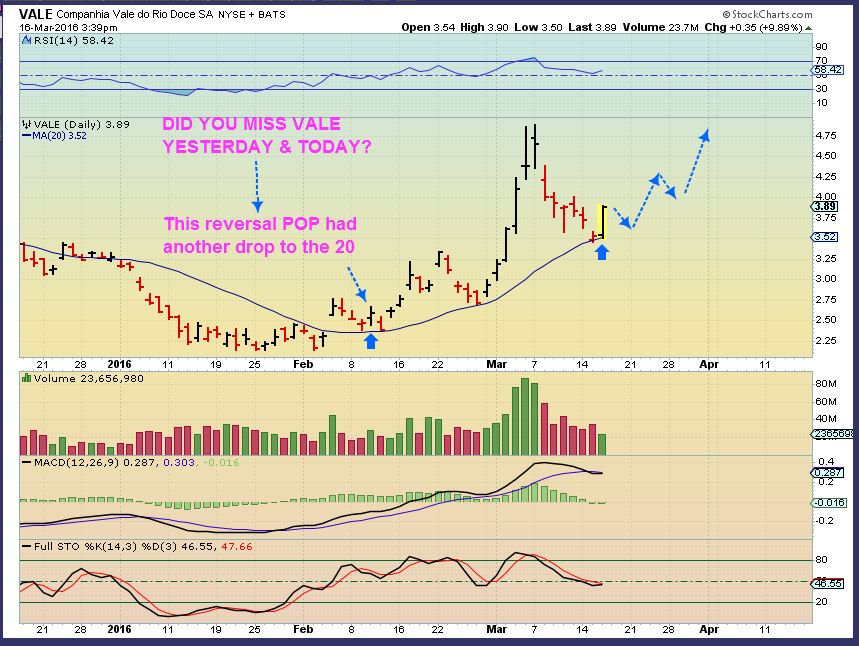
REMINDER CHART – Notice how long the price lingered at the 50sma at the end of March? This may or may not go right back up to the highs. It could also play out in a consolidation manner as shown, time will tell. The entry is low risk, even during possible price swings.
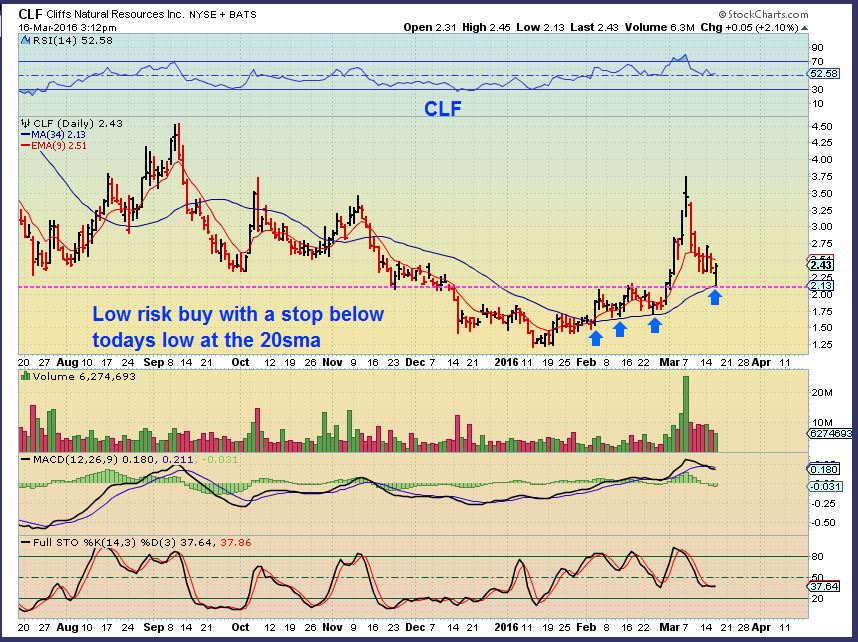
These are 2 more examples from Thursdays report showing a lower risk area to enter a position. A ‘stop’ is placed below a reasonable support area.
CLF – I had been watching this one for re-entry too. Look what it did during the FED MTG.
CENX – That recent pull back to the 20sm offered a low risk entry with that reversal.

There were others pointed out too.
.
The FED Decision seems to be favorable for a continued run in Commodity stocks and they’ve presented a low risk opportunity (if you honor your stops). Many Metals stocks have pulled back and consolidated going into the Fed Mtg. Now they may be at a lower risk entry point. OIL moved higher after the Fed Decision too. We’ll see if some more of our Energy stocks that have been pulling back can also tack on some gains. If you didn’t buy the pullbacks in commodities yet, this may be your day. Happy trading!
.
~ALEX
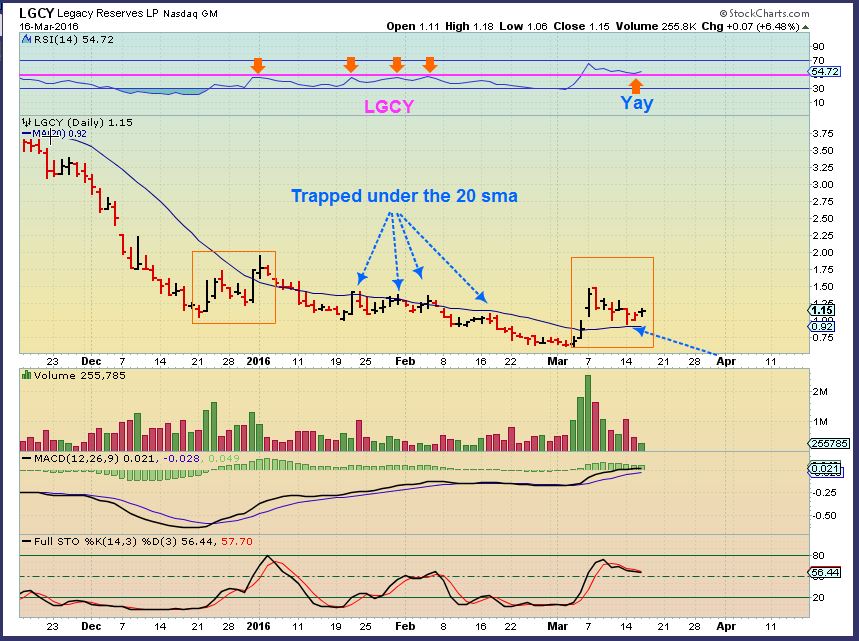
Bonus Energy possibility (Caution, they are higher risk due to debt and lower oil prices. Due diligence is due.
LGCY 3-16 …Yes, it is still acting correctly consolidating that blast higher. I’d like to see a repeat of that orange box. 
Nobody wants to take unnecessary risks in the market, but the saying “Nothing ventured, nothing gained” applies too. So you have heard me mention looking for “Low risk entries”, but what is that? It is timing an entry where the risk to the downside is minimal, and the gain on the upside outweighs it. We will discus that further later in this report.
,
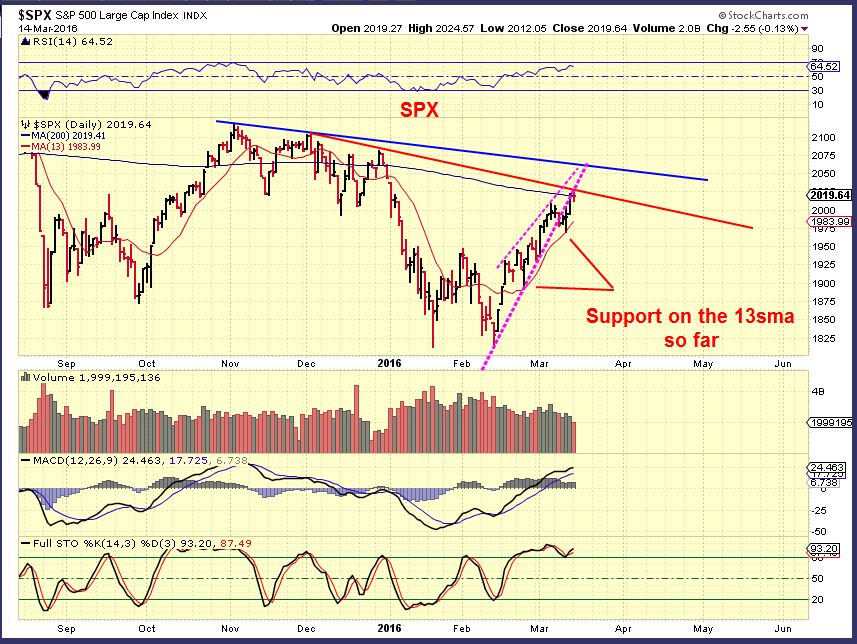
SPX -Friday is Quad witching. The Fed didn’t kill the markets this time, but that wasn’t a very convincing push either, was it?
Read more
It’s Fed Wednesday, and so far there is no real change here, going into that decision.
SPX – No real change in this chart, but there may be a change of character. We have the Fed decision Wednesday and Quad witching Friday to pop this above the 200sma, or drop it down to maybe the 50sma area. Tuesdays selling recovered.
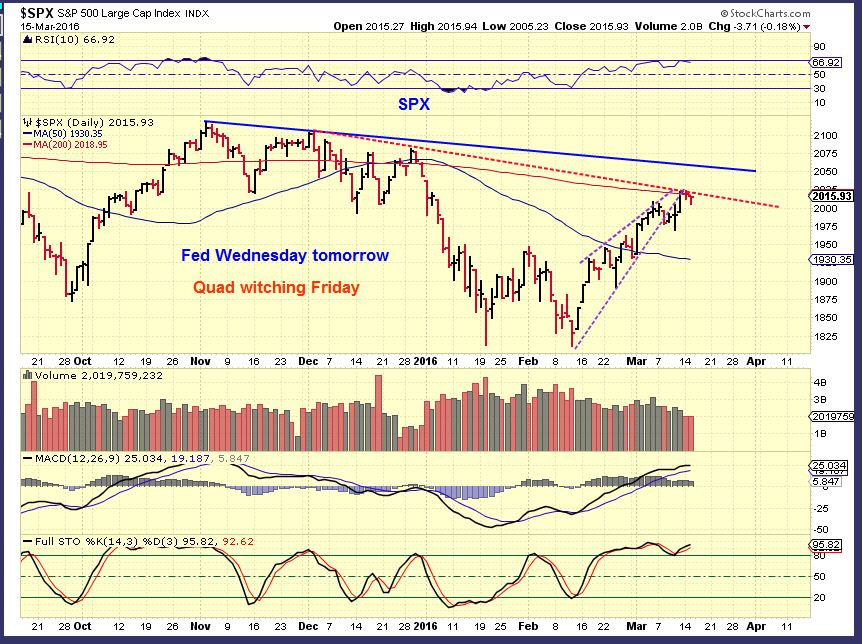
Let me point out this …
Read more
The short term trade set ups seem pretty clear, but with that Fed Wednesday Meeting rapidly approaching, the end of the week could host a number of reactions. Lets see how things are currently unfolding .
.
SPX – This bearish wedge was forming last week (March 9 chart).
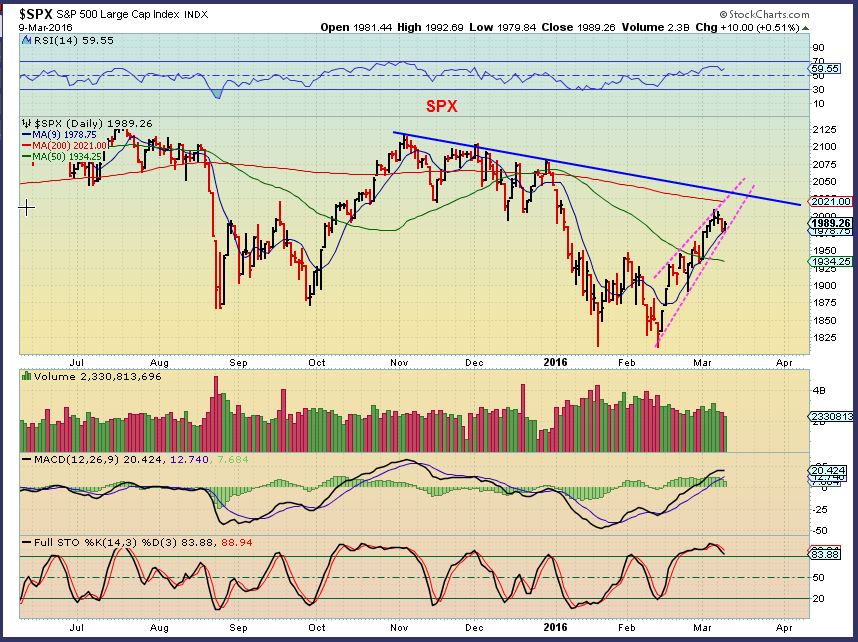
The SPX did drop quickly and recovered last week, as seen here. Is this still a wedge though?
The Fed Mtg is approaching and could affect the outcome.
Read more
Scroll to top