
When Is It A Lower Risk Trade?
In the premium section of chartfreak, we’ve discussed using Low risk entries to take a position in a stock, but what makes them low risk? Lets take a look at a couple of examples.
.
First, we have been trading sectors that looked to have bottomed recently after seriously selling off . They give evidence of little downside and greater upside. As pointed out here in recent weeks, we’ve traded Miners since January, and Commodities and Oil since February. Lets look at commodities for example.
.
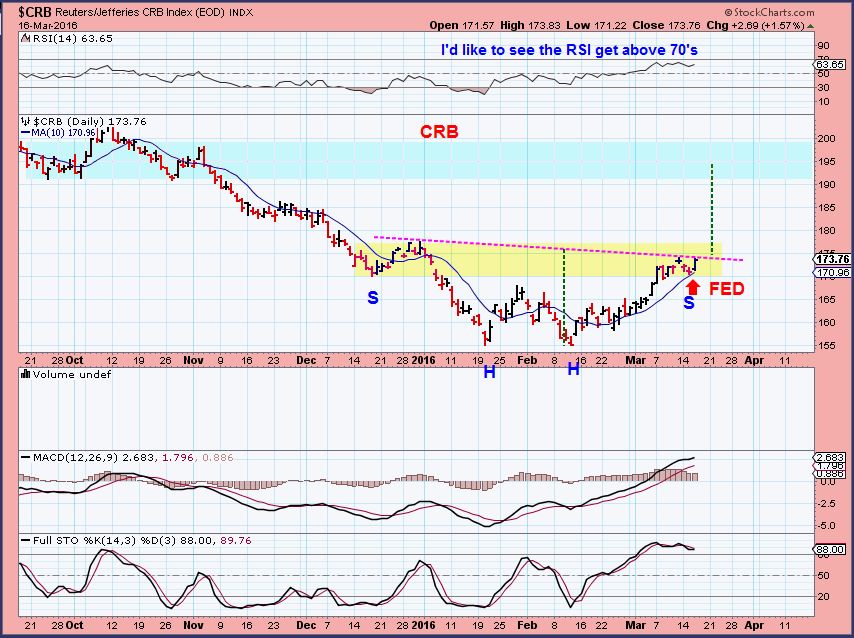
CRB – We caught commodities after the second bottom formed with divergence. The commodities chart still looks bullish after consolidating for a week heading into the Fed Meeting. I believe that this can run higher now.
.
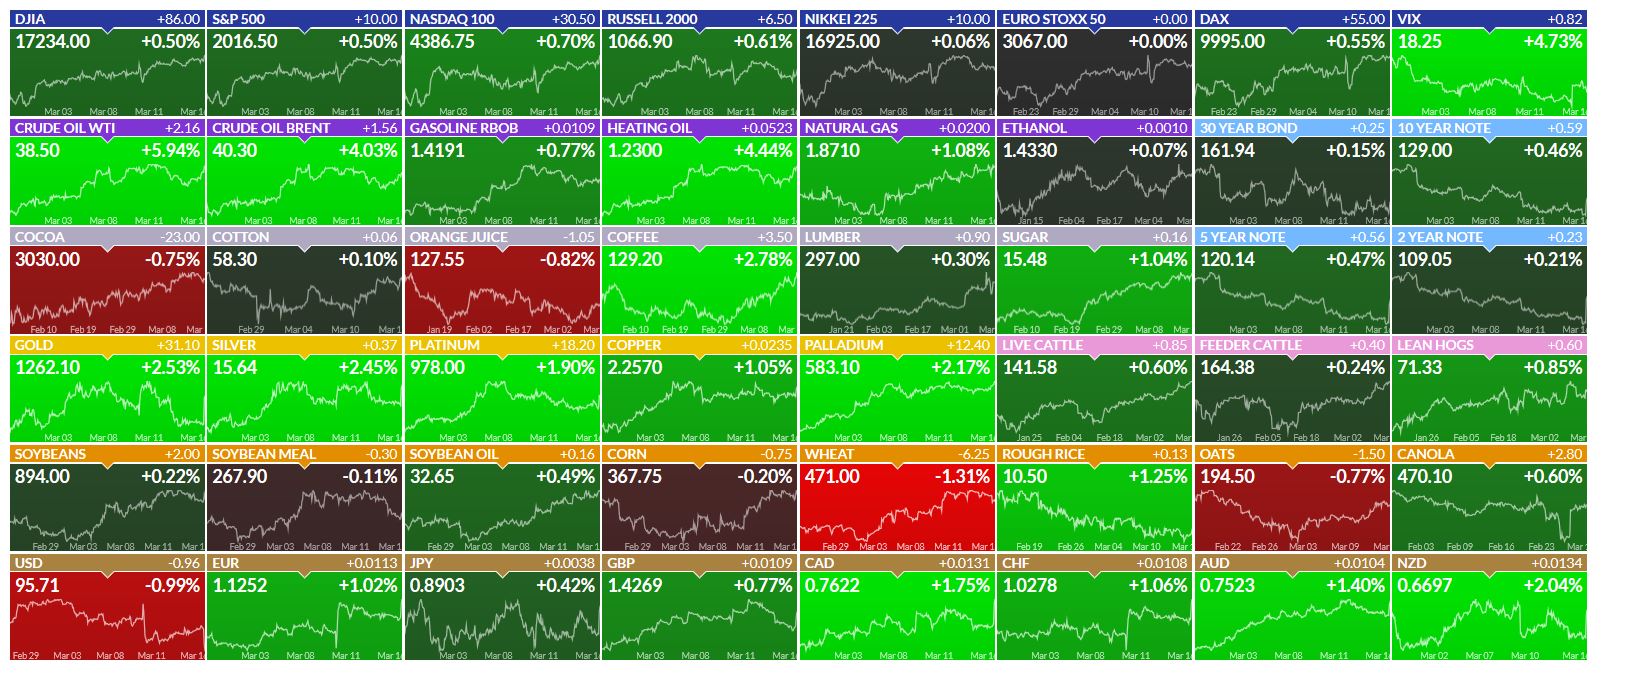
We’ve been watching various Metals stocks pulling back or consolidating after running higher recently. See stocks like X, CENX, AA, FCX, VALE, CLF, STLD, Etc .  Look at The sea of Green in various Commodities after the Fed Decision was released.
.
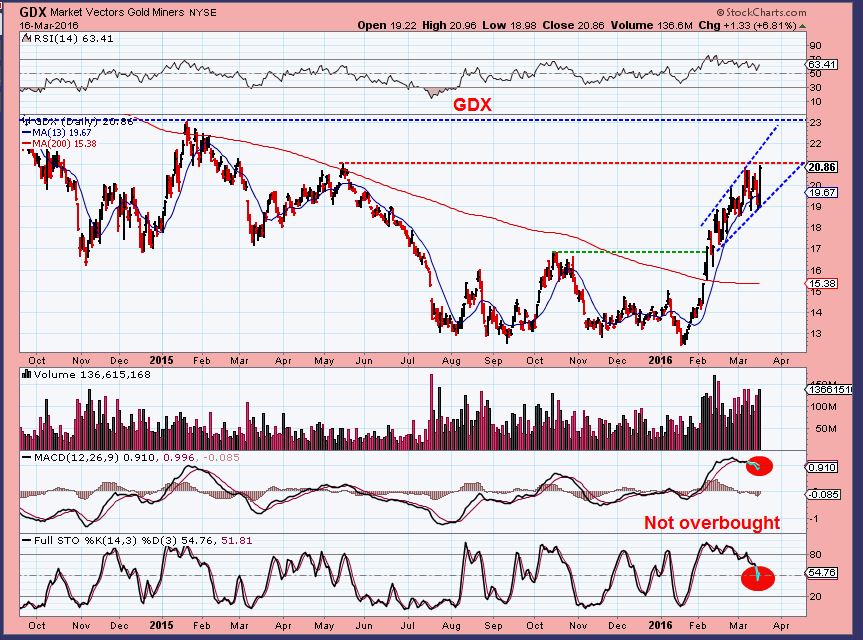
Sidenote: While I believe that individual MINERS may have a little upside left, Cycle timing says that they should actually be maxing out soon. We will be prepared to buy the pullback at a low risk point. Short term traders have been given charts and instructions to trade individual Miners if they want.
So lets look at my recent lessons on trading and then watching a stock like VALE pull back after a nice run higher.
.
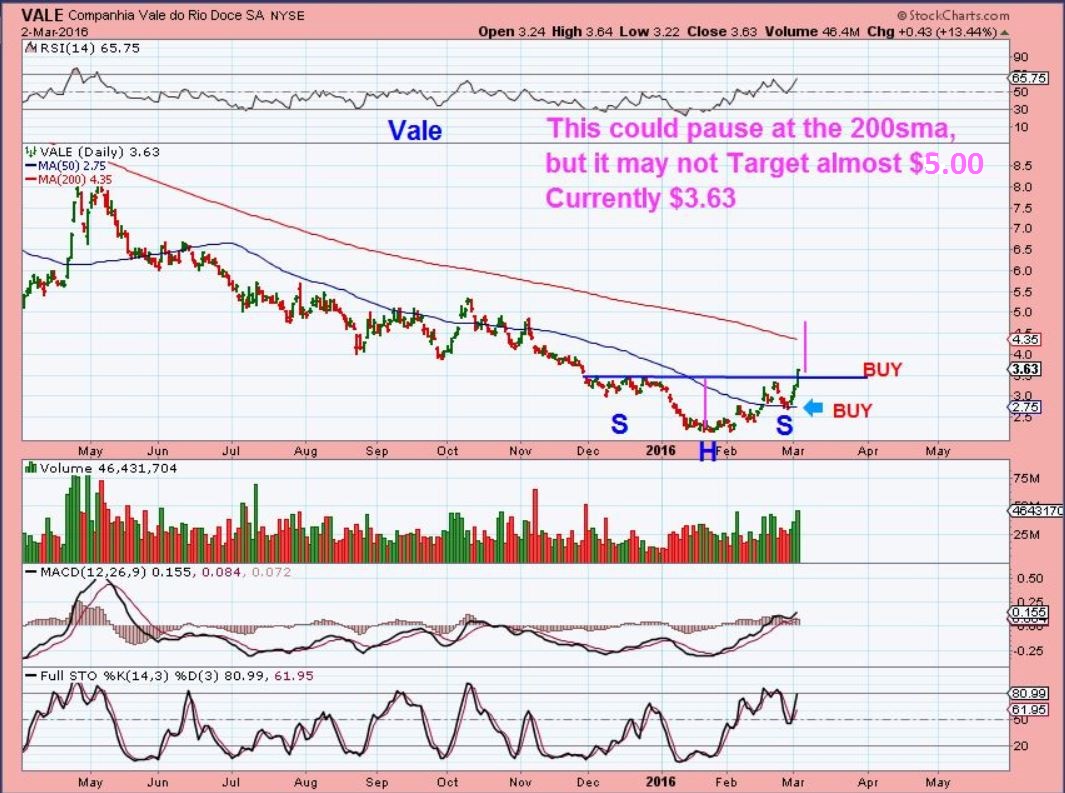
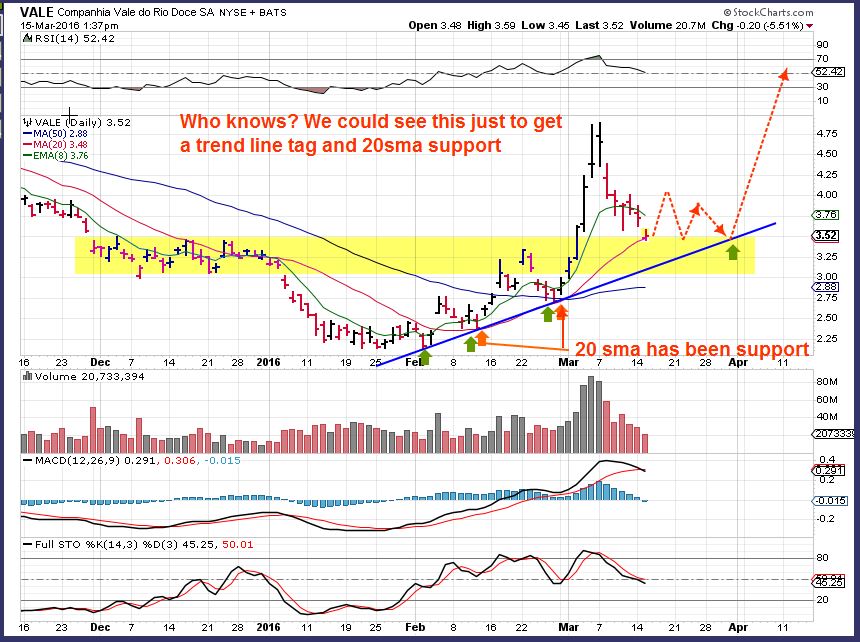
VALE – I bought Vale near the gap fill in the $2.50 area, after watching commodities bottom. On March 1st, a second lower risk entry point would be the break above the 50sma and trend line back test too. Why low risk? Because you could place a stop a little below those moving averages to limit risk if the trade goes against you.
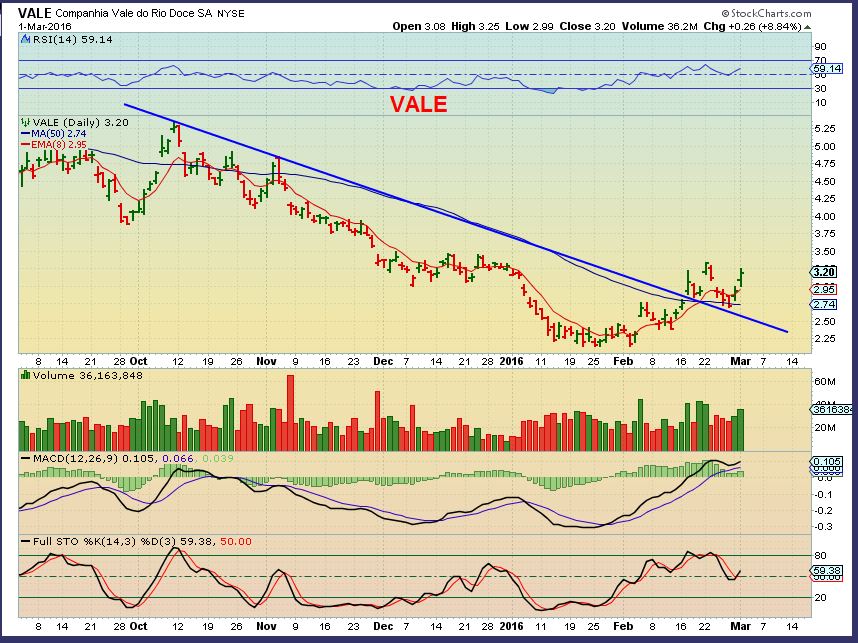
I called for a run to the $4.80 – $5 area using this inverse H&S , and began to sell on the way up over $4.50.
.
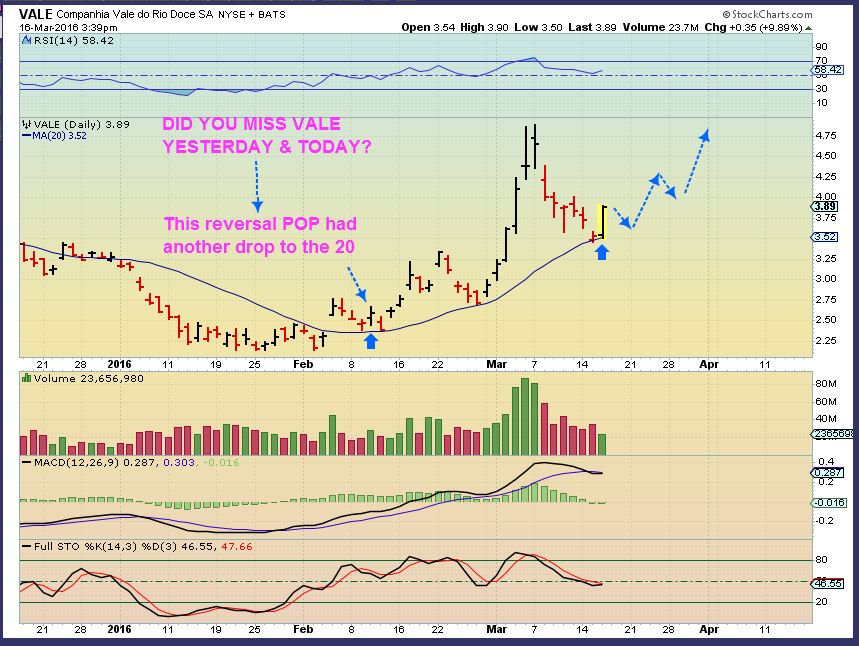
Then after the run fulfilled (Topping candle), we had to look at a logical place that Vale may drop to. These were two ideas, if vale had in fact topped at that $4.87 high & reversal. We’d be looking at the $3.82 and $3.50 area for starters.
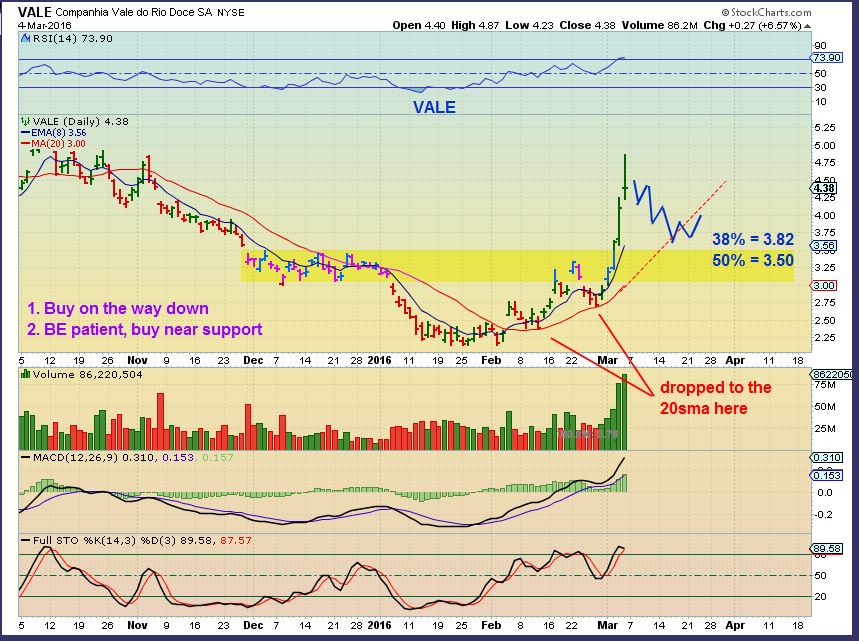
Vale almost hit the 50% retrace on March 10, and volume was lightening up. The 20sma was entering that $3.50 area.
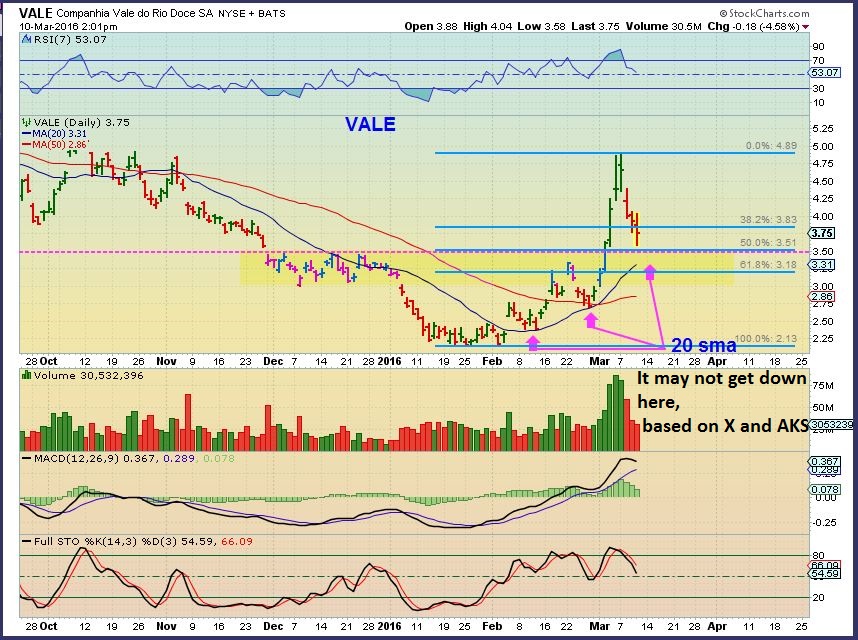
March 14, selling was slowing up in that support area, and I mentioned that I started a position. I started small, because this ‘could’ still drop to the 50sma, but it was above support ( Yellow) .
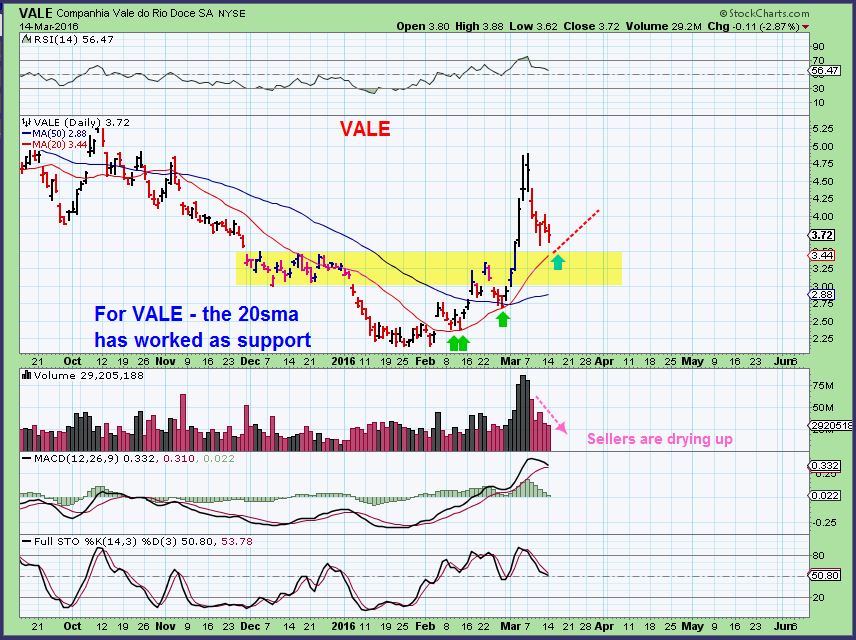
VALE – Vale pulled right back to the $3.50 area as hoped for Tuesday and also on Fed Wednesday. It took off after the Fed Decision. I captured this chart at 3:30, but it closed even higher at $3.99. So you can see why that was a low risk entry. That doesnt mean that it will go straight up from here though.
REMINDER CHART – Notice how long the price lingered at the 50sma at the end of March? This may or may not go right back up to the highs. It could also play out in a consolidation manner as shown, time will tell. The entry is low risk, even during possible price swings.
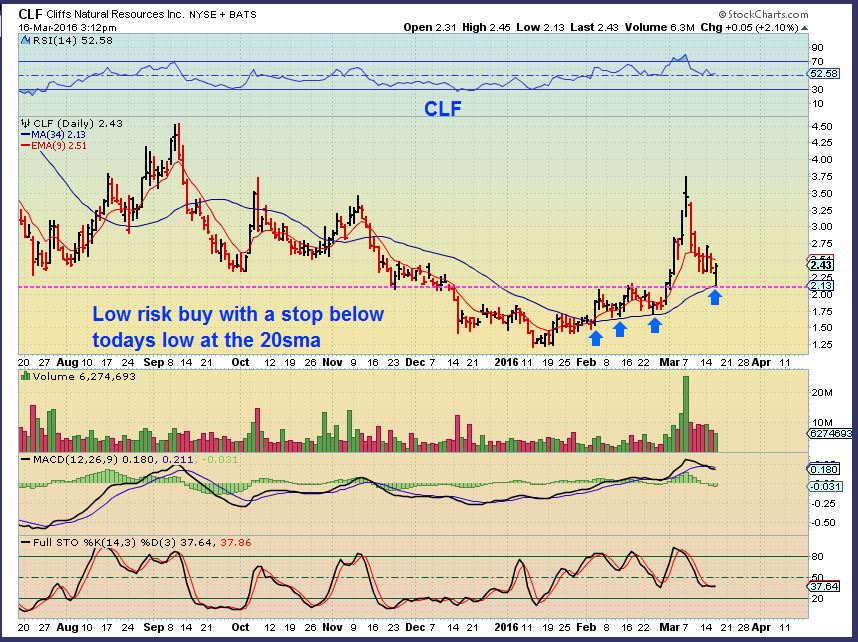
These are 2 more examples from Thursdays report showing a lower risk area to enter a position. A ‘stop’ is placed below a reasonable support area.
CLF – I had been watching this one for re-entry too. Look what it did during the FED MTG.
CENX – That recent pull back to the 20sm offered a low risk entry with that reversal.

There were others pointed out too.
.
The FED Decision seems to be favorable for a continued run in Commodity stocks and they’ve presented a low risk opportunity (if you honor your stops). Many Metals stocks have pulled back and consolidated going into the Fed Mtg. Now they may be at a lower risk entry point. OIL moved higher after the Fed Decision too. We’ll see if some more of our Energy stocks that have been pulling back can also tack on some gains. If you didn’t buy the pullbacks in commodities yet, this may be your day. Happy trading!
.
~ALEX
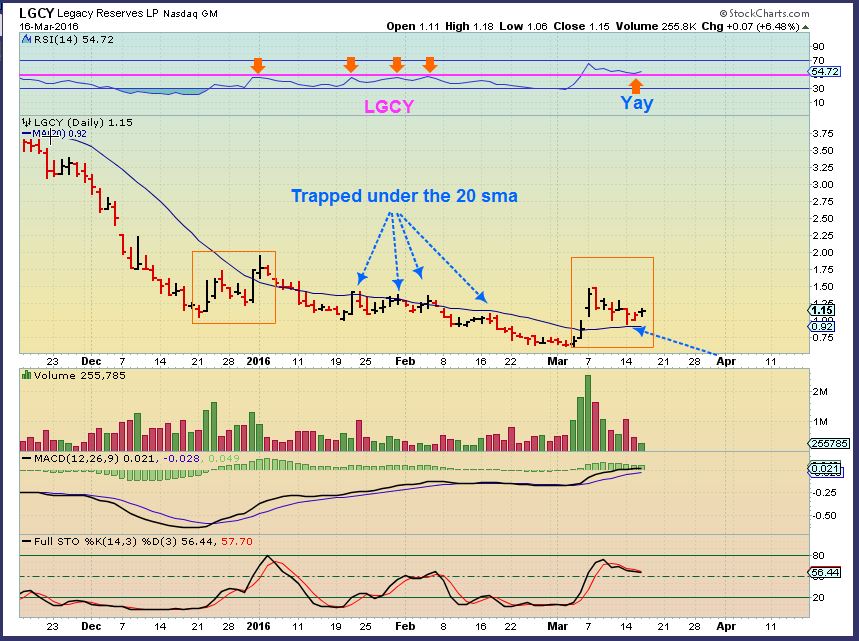
Bonus Energy possibility (Caution, they are higher risk due to debt and lower oil prices. Due diligence is due.
LGCY 3-16 …Yes, it is still acting correctly consolidating that blast higher. I’d like to see a repeat of that orange box. 


SXE ( I do still own a partial position in my basket of energy and commodities) could get a big smack down today. They agreed to a restructuring ( bankruptcy) and dropped 30% after hrs ( but the volume was only 5,000 shares sold). Still, that could be beaten down today.
http://seekingalpha.com/news/3168009-southcross-energy-parent-agrees-chapter-11-restructuring-principle
Well that sucks, I followed you into that trade. Its down 44% overnight…………Are you going to sell or hold your shares?
It does –
Mine wasnt a big position, but I bought it in 2 places ( under $1 first and then added at $1.20) so I will cut the first portion this morning, and the other small portion maybe a bit later just in case theres a bounce. This is BKRPTCY talk, so I really dont expect a bounce.
You find it better to sell premarket? or wait to open?
situational- different for each company I would imagine. I just sold some at the bid at 70 cents just to unload them / clear my head and move on.
If you look at the bid price and are willing to take it…pre market is fine. You sell at the bid & usually get an instant fill
BTU got crushed on a gap down yesterday, its up 12% in premkt today – So knowing exactly when to sell for best price is unknown, but selling to leave the trade behind at any cost is a choice 🙂
Hey, SXE shot up at the open ( Well, up from down that is). Opened at 70 cents and now 93 cents
I watched it and got out at 0.88. Im okay with that. Its actually an up day for my account in total! Never want to see that again. Another reason to have multiple companies in a sector. Imagine if I had a bid stake in that and REXX? Yikes
Well, depends on when you would have bought REXX, its still up about 180% from 12 days ago. 🙂
My point was not REXX so much as having all my cash in 2 stocks rather than the 8 I currently have. Diversified although most within the same sector.
was that always a risky one?… the 50sma has never been anything other than pointing south
ooo…sorry about that .. 🙁 that hurts….ugggh
Keeps me humble 🙂
Let’s look at four energy partnerships that slashed/suspended their distributions recently:
1. Kinder Morgan Inc. KMI: On Dec 8, the largest pipeline operator in North America slashed its dividend by 75% to 50 cents per share annually. The payout cut by the debt-laden Zacks Rank #3 (Hold) company is likely to free up capital to the tune of $900 million a quarter to fund its expansion capital budget.
2. Southcross Energy Partners L.P. SXE: In Jan, lower commodity prices forced Southcross Energy Partners to suspend its quarterly cash distributions that amounted to 40 cents per common unit. The Dallas, Texas-based midstream partnership, sporting a Zacks Rank #3, also closed a $14 million unsecured loan.
3. Atlas Resource Partners L.P. ARP: Another partnership slashing cash dividend in the wake of collapsing energy prices is Pittsburgh, PA-based Atlas Resource Partners. In Nov, the Zacks Rank #2 (Buy) upstream energy player said that it will chop its annual cash distribution from $1.30 to 15 cents per common unit.
4. Breitburn Energy Partners LP. BBEP: Trying to shore up its finances in the face of a prolonged oil downturn, Breitburn Energy Partners said it would suspend its common unit distribution. This will enable the Los Angeles-based Zacks Rank #3 oil and gas partnership to save $111 million per year.
Be aware if you own these.
Hi Bill, I had inherited KMP which became KMI….I own some of these others also….what are you warning of?
Nancy, after the big drop in SXE this morning, cutting dividends may be a warning or troubled cash flow. Just a heads up to check your companies out.
Alex, thanks for the heads up in VALE! What would be your target for this? would you use the first sunup and just extend…so around $6?? Would like to know so I can pay for an extended subscription. :-))
Hi Deshy,
Its honestly not possible to tell coming right out of the reversal area. As shown, it could bounce & go sideways , eventually moving higher ( See the GCX chart in this report).
Basically what you said is what to look for, the first run up could be an A-B move, and then the $3.60 plus that move could be a C-D. If volume gets very light on the way up, it usually just does a double top, then either further consolidates up & don, or puts a handle like move on , etc.
What I might do is sell some up near $5 if we go there and the volume is light, and let the rest ride for a bit….but I’ve left some good trades behind that way too.
Thanks! I’m still learning to fish, so every but helps.
I’ll try to keep us posted in reports as time goes on, if anything obvious shows up.
Appears to be struggling around the 200sma currently
Sometimes its hard to believe that I sold my NUGT at $48 and it was an awesome trade, then I see NUGT at $71 right now in pre-market. Amazing move out of these lows!
#I-Want-A-Do-Over
Yes, please. Same thing, tried to be too cute with timing and missed out. I have one small account that was in NUGT since $18
Yes, me too , about $17.70 I think. Crazy move to $73.48 as of today, but who knew. It got so volatile in the recent times that I would never have been able to hold on.
JNUG 20 to 80’s too.
Funny thing is its not that volatile anymore? Keep going up. I think it pulled back from $70 to $54 which is tame for NUGT. 38% just once
I hate gaps .
I looked at a 6 month chart of CLF and I cannot find one time that it gapped open higher and didnt immediately fill that gap.
CLF gapped ope today : (
Sell?
Not now, Its just that if it gaps, its going to fill it.
And it already did this morning thankfully , just like VALE.
I was lamenting that it WILL fill, but what if it fills next week. That wouldve been a bummer
Still can’t wrap my head around REN? Why isn’t that jumping higher?
Too is really taking off! Any thoughts as to likely resistance levels?
There is resistance way up at $12 🙂
There is also a gap that may be getting filled below the $8 level, it can stall there.
You need to figure out how to win the battle between greed and fear.
Trailing stop? Sell some and ride some? , etc