PUBLIC REPORT- THE TURNING POINTS
Markets rally, Markets drop, and markets reach turning points. We discussed this in the premium side of the weekend report. Lets look at a couple of the areas that we discussed Sunday March 20th.
.
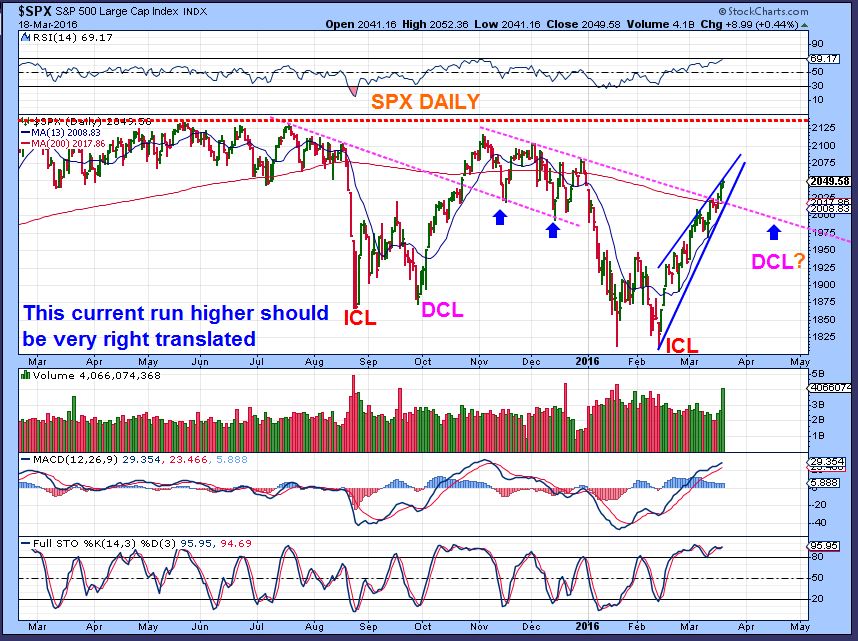
SPX – Whether the recent run of lower highs and lower lows started a bear market or not, I still expected a strong rally when we were at recent lows. It would draw in bulls, but what comes next after 6 weeks higher?
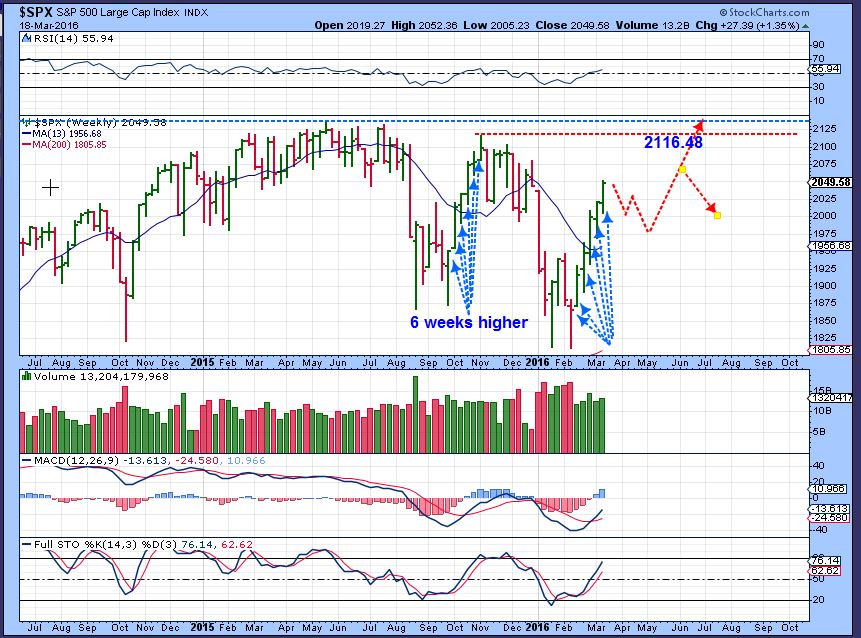
This rally has played out pretty much as expected, but I want to point out some interesting changes in character that could affect future trades / trading.
.
SPX DAILY – Breaking the recent downtrend line is great, but we did that in OCTOBER 2015 too. The markets still rolled over to new lows. How we bounce after the next dip is a key to future trading. We have a rising wedge currently, and I expect a drop using cycles, into a DCL (Daily Cycle Low) soon.
.
Before we even dropped last year, I mentioned that at Prior tops, The 10+20 sma turned down, The 10 crossed under the 20. THEN a rally ‘back tested’ that 20 ma area as shown.
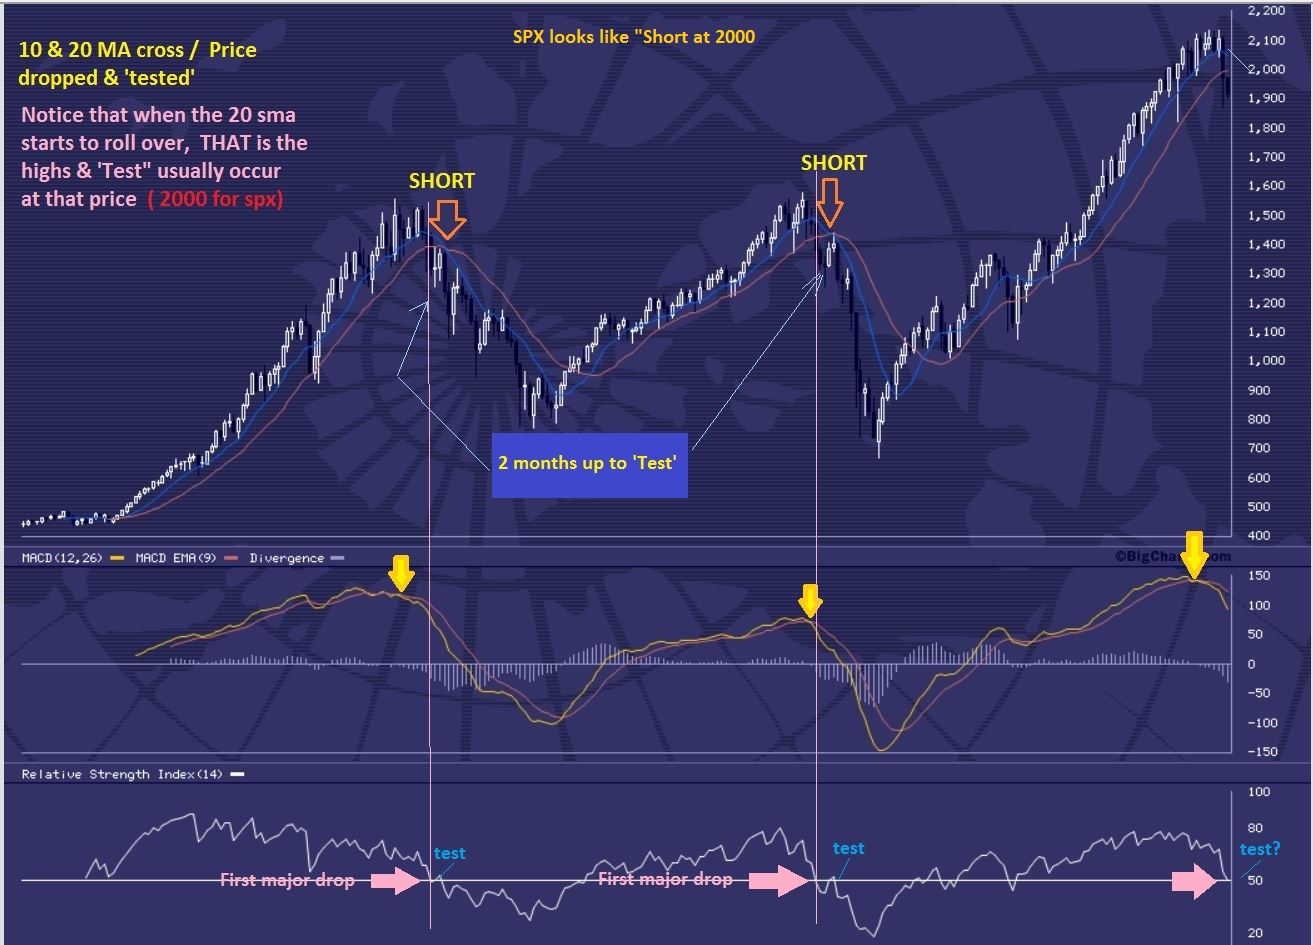
Right now, those Moving averages have been recovered in this first daily cycle out of an ICL. THAT DID NOT HAPPEN AT THE 2 PRIOR TOPS. 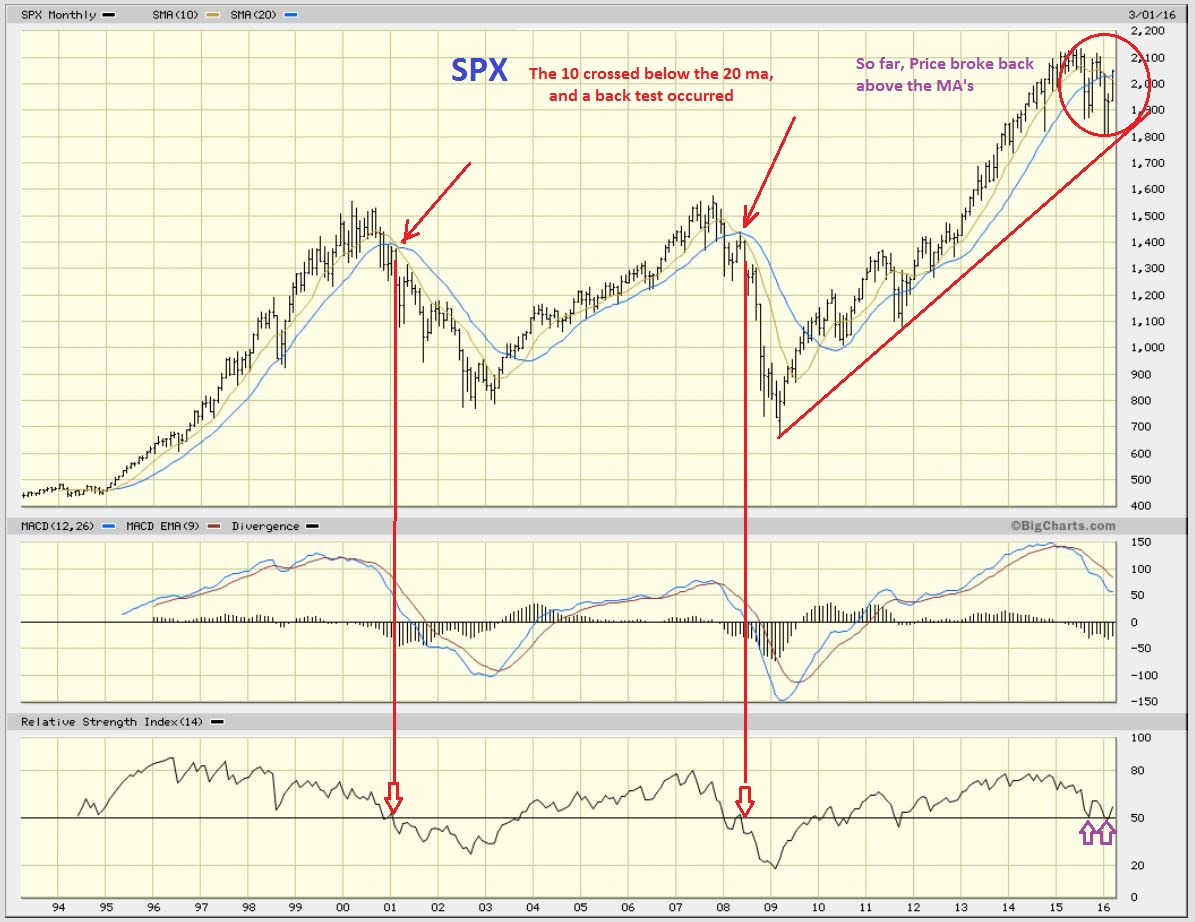 .
.
I discussed the implications in the weekend report, using several other charts of the DOW, TRANNIES, ETC.
TURNING POINTS – IS THE DOLLAR STILL PUTTING IN A DOUBLE TOP, AS I EXPECTED.
.
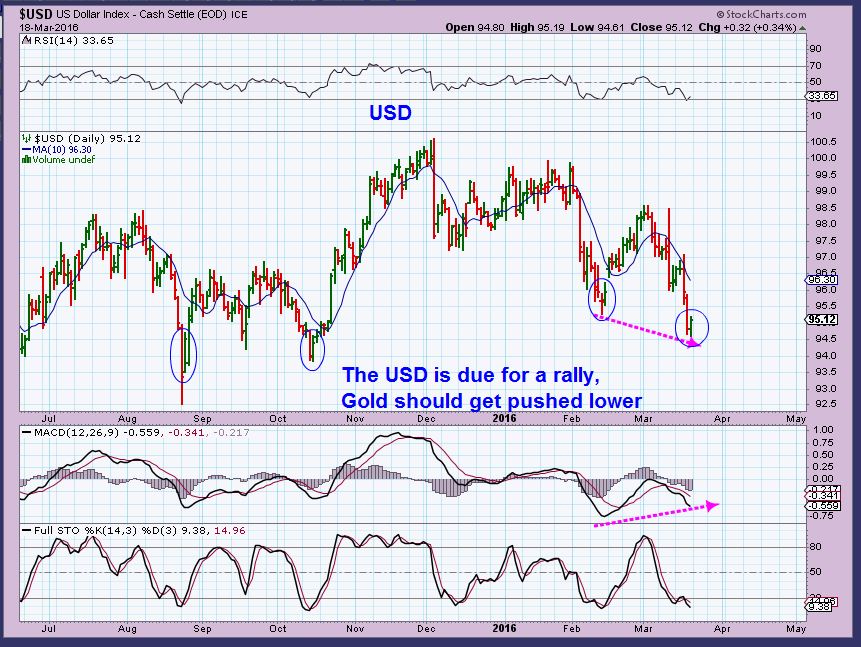
USD – I expected the Fed to finish this drop, then possibly bounce.
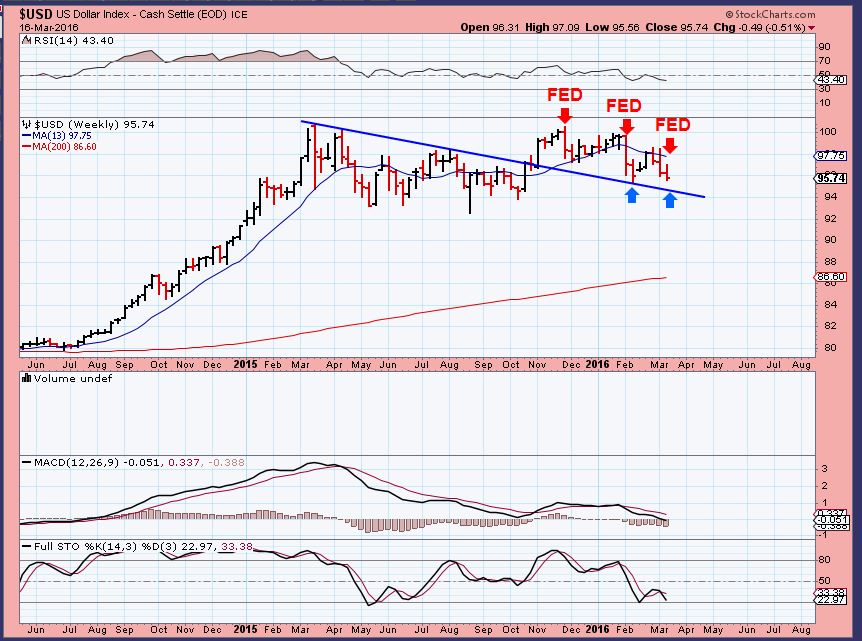
The USD drop may be complete short term. This could affect Gold.
.
USD DAILY – Divergence and a small reversal that could become the DCL. Gold may finally feel the pressure, unless this is just another bear flag, dead cat bounce.
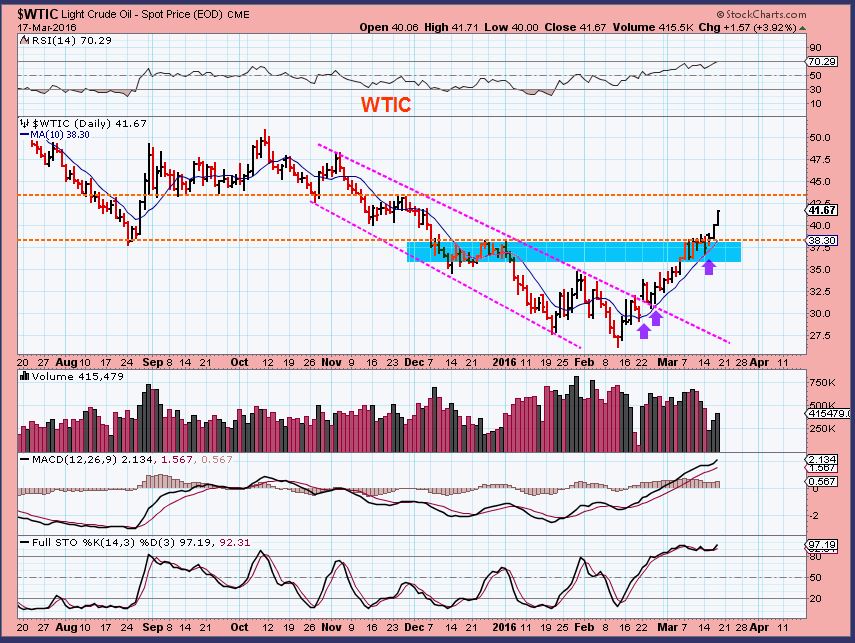
We caught the lows in OIL, because I had a $26 target that I was looking for ( Along with a possible $24 target). A Turning point.
.
WTIC DAILY – Oil rallied form $26. I pointed out the break through resistance and the move towards the next resistance area ( $43 ish).
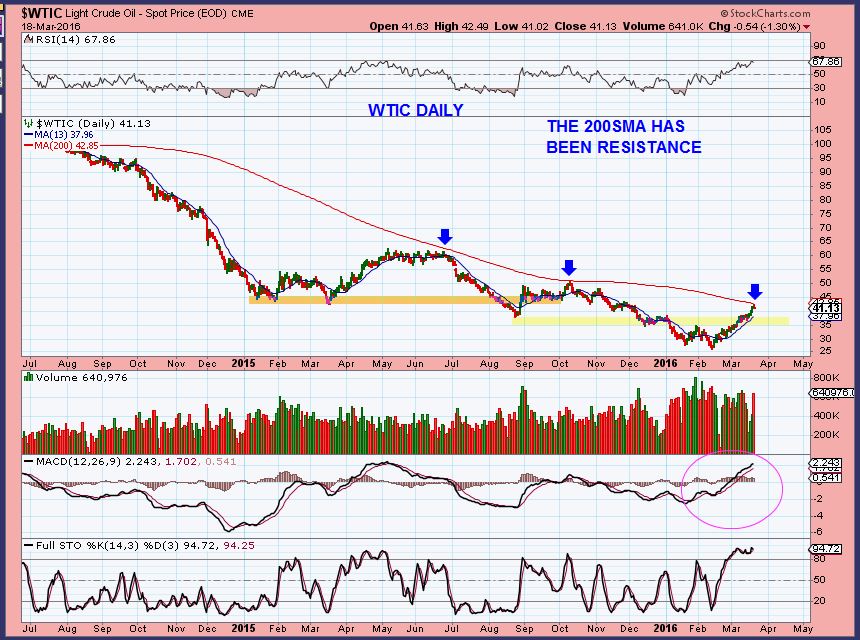
WTIC DAILY – the 200sma has acted like resistance, so OIL may pause this week. I discussed what I expect next.
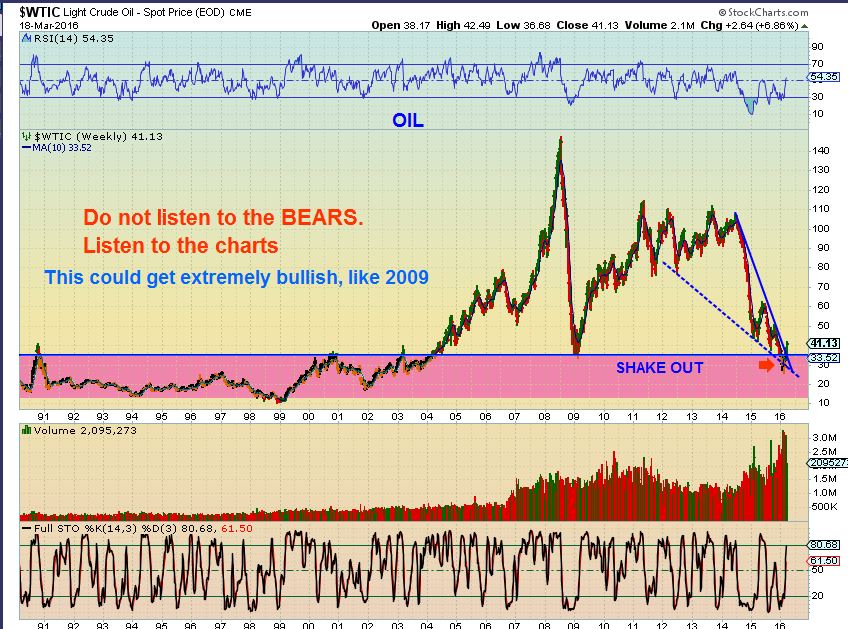
Lastly is OILS BIG PICTURE- Has OIL turned the corner? Some say it needs to put in months at the lows to form a base. In 2008, we saw a V-Bottom. We are monitoring Oils bottoming process.
.
THE CRB – The CRB is in the normal timing to find a dcl ( 20-28 days roughly). We may have just seen it. If Not, a pullback in the markets could have this drop into a dcl, but timing wise it is getting late. The CRB may just ride out the 10sma like Miners did.
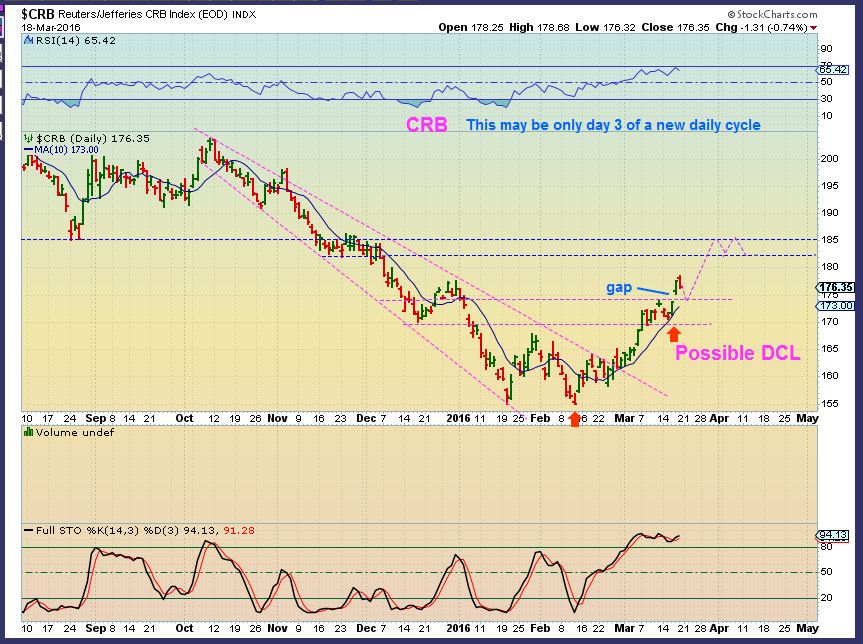
CRB – The Big Picture. Another Turning Point? The commodity runs out of the lows can be steady and strong. We have been monitoring & Trading Steel, Aluminum, iron ore stocks, etc., as shown in prior PUBLIC REPORTS.
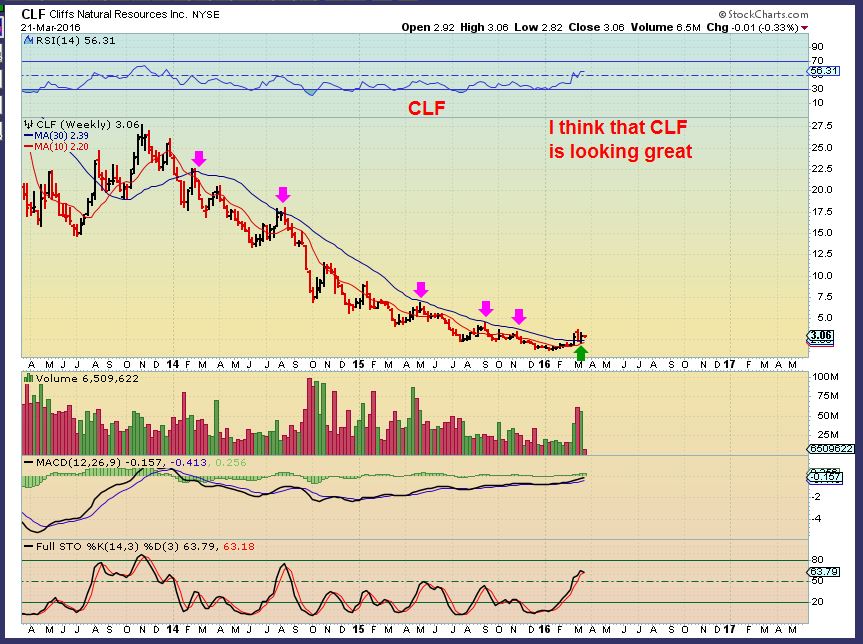
CLF recently ran from roughly $1.25 to $3.75. Did you miss the run in CLF?
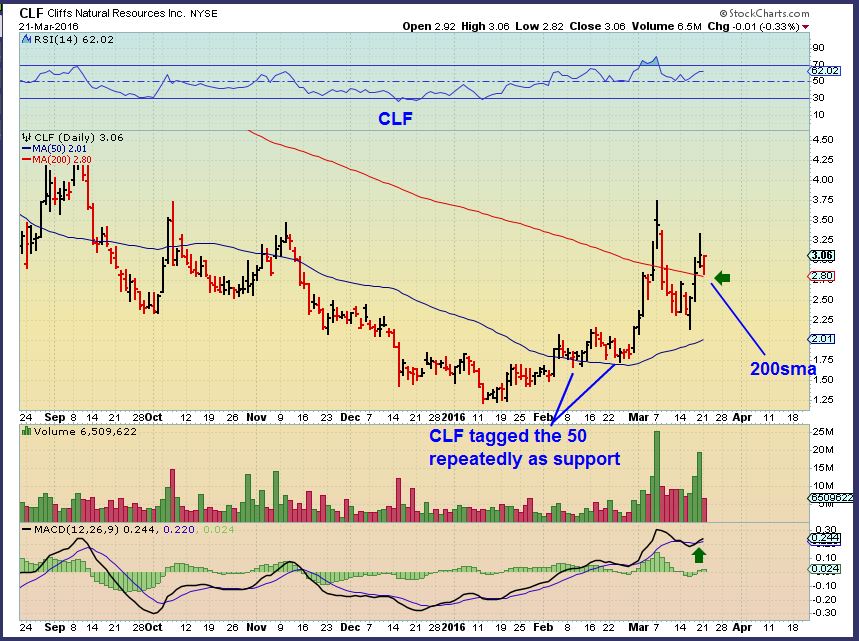
Not if Commodities are at a major turning point. 
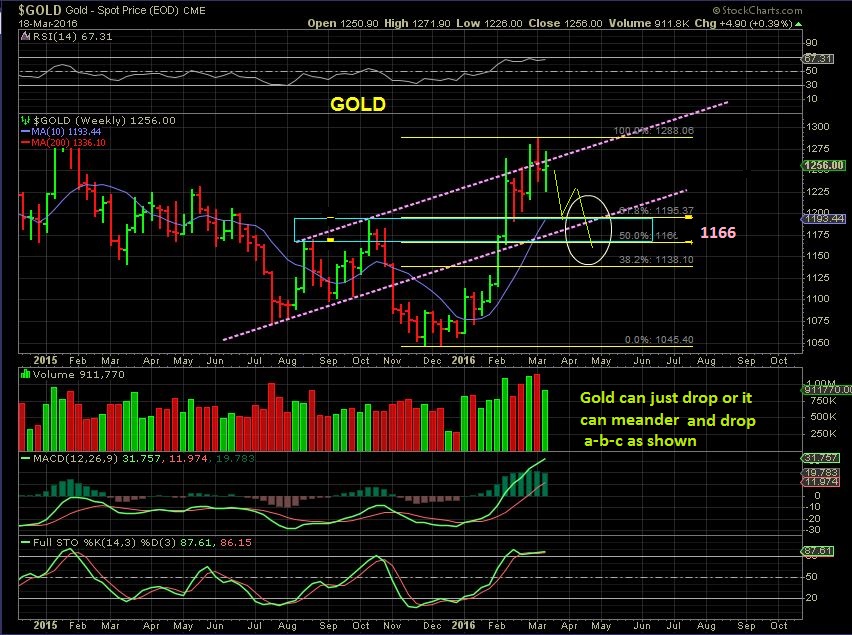
GOLD
GOLD – Gold finally looks ready to pull back, if this is indeed a topping pattern.
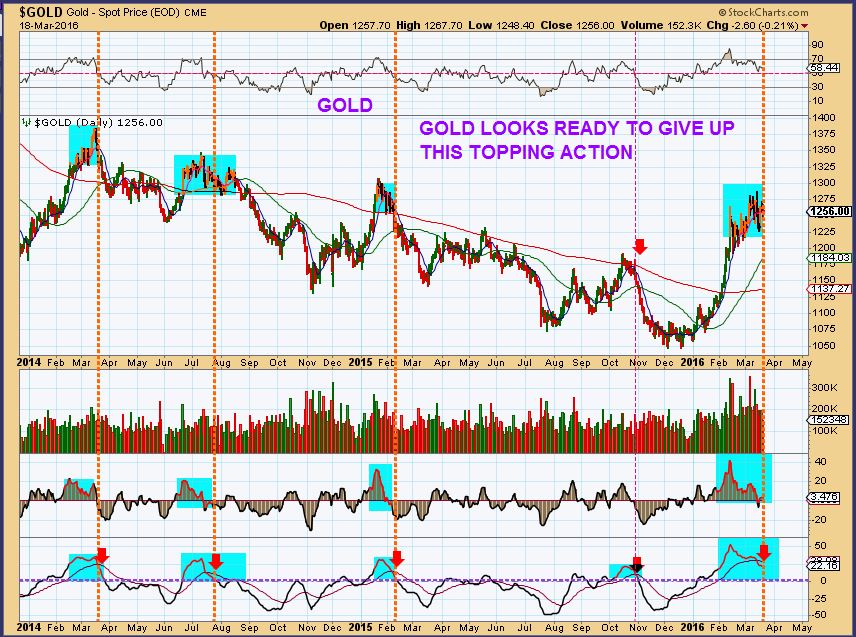
GOLD WKLY – Normal target would be in these areas, and it may take some time to find the next lows.
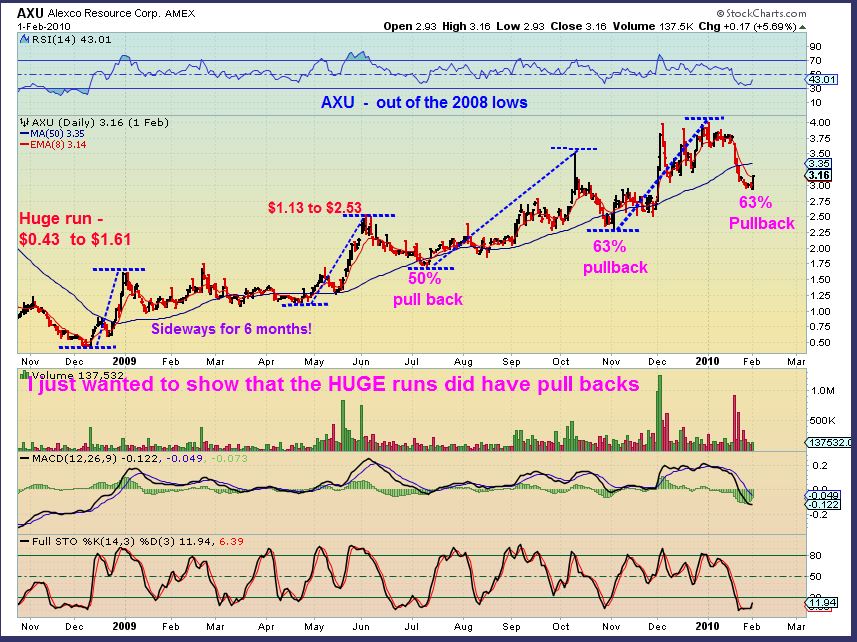
We discussed MINERS also . I pointed out that past runs out of the lows can be very profitable as either a BUY & HOLD, or for those trading daily cycles. Below is one of a few the examples that I posted as a visual.
.
The pull backs can be concerning for the Buy & Hold crew, but longer term, profits were excellent. Emotions are affected if you stare at account balances, but the profits were great for those that bought the dips. If conditions remain bullish, we will review this often.
So we appear to be at the doorstep of many turning points. The absolute lows of some of the recent sell offs may be in, and dips can offer some profitable trading entries to the patient ones. We will continue to take advantage of those here at chartfreak. The price of 1 month is $37.95 if you’d like to give it a try. We also have discounted quartly / yrly memberships available too.
.
To Sign up here, click and scroll down
.
Thanks for reading along, happy trading!
.
~ALEX
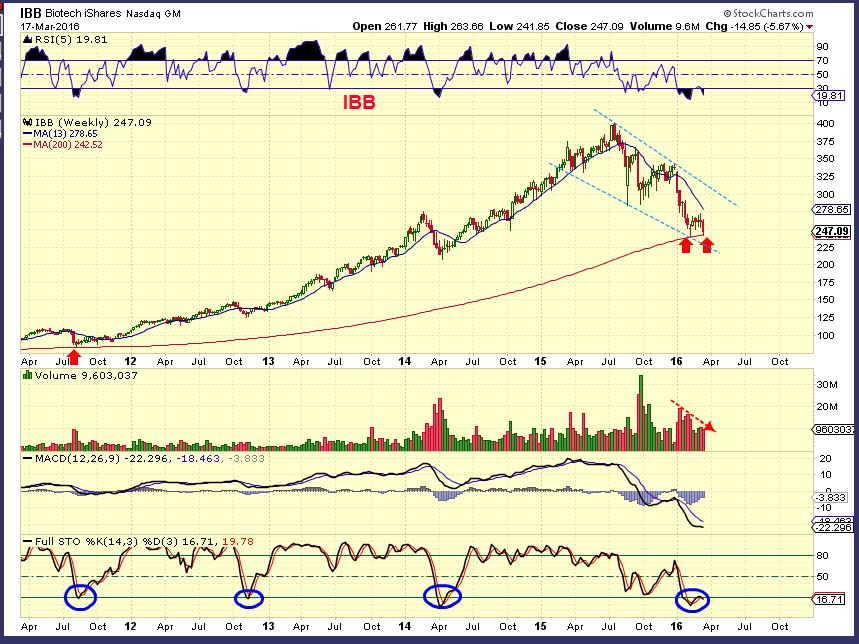
Side note on the Biotechs:
As mentioned in one of last weeks reports with this wkly chart of the IBB ( below) – I am interested in many of the Biotech charts set ups. I do see “bases” that have been forming between the weeks of the 2 red arrows that do have a bullish appearances on individual charts.
One can use ETFs or options to minimize risk, but trading the individual set ups does include a good amount of risk.
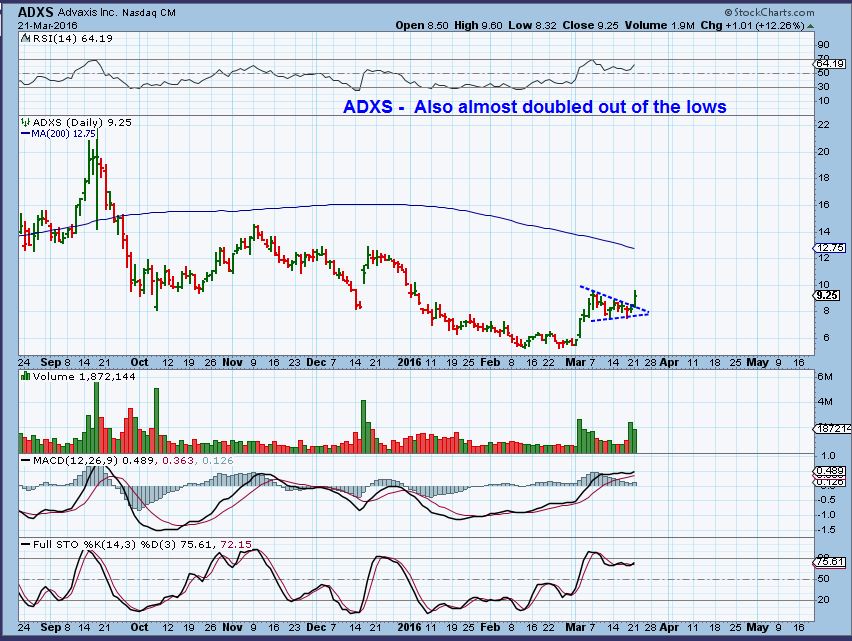
Personally I have traded biotech in the past , and they can be high risk no matter how solid the company seems. In the past I have owned a few ‘good’ companies that either failed on a drug trial that was going well, or the FDA didn’t approve their drug due to side effects, etc., and the stock will actually open up down 20- 50-70%. That said, here are a couple of examples of bases that I like.
.
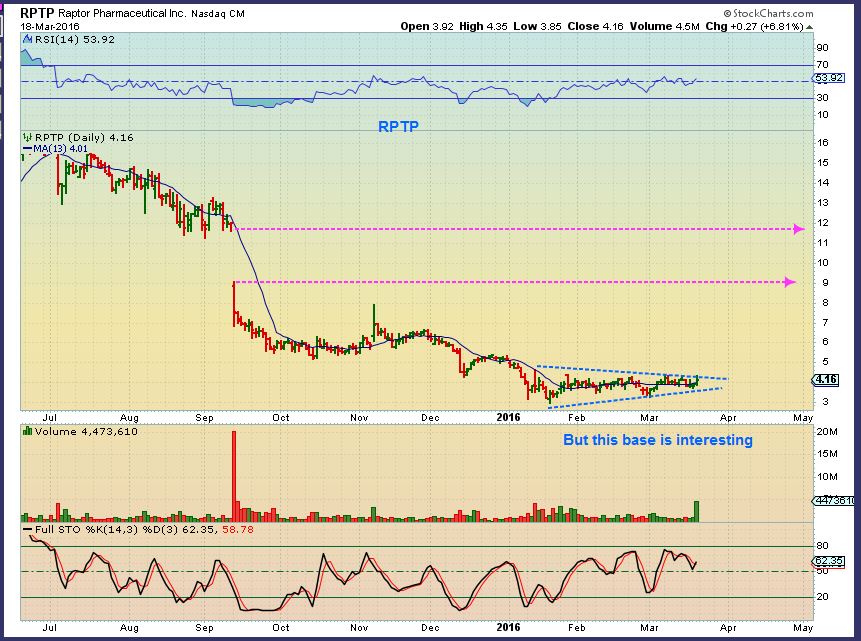
RPTP – Huge drop from $12 to $8 , but now I like that base in the $4 area.