RECALCULATING ROUTE
Have you ever been driving along using your GPS and you decide that maybe you’re going to take a short cut to your destination? The GPS detects that you have left the designated course and immediately needs to compensate by announcing, “Recalculating Route!”. Well last week sectors of the markets took sharp detours right after the elections. Using over 50 charts, this weekend report will discuss the road we find ourselves on now.
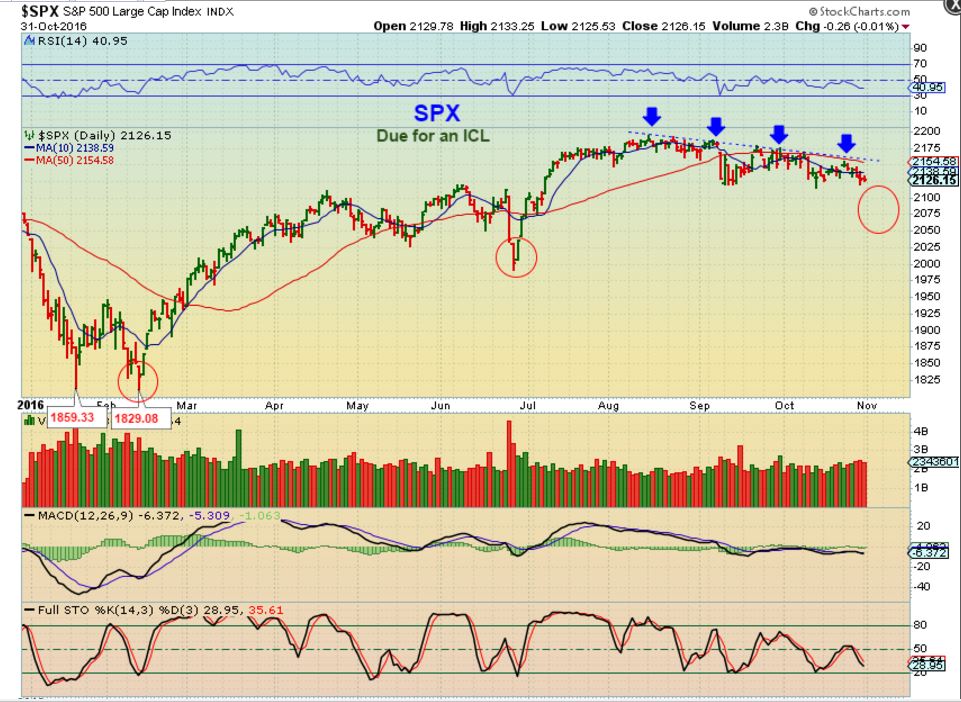
SPX – Nov 1st , Expecting a trade-able ICL, maybe in the 2070 area.
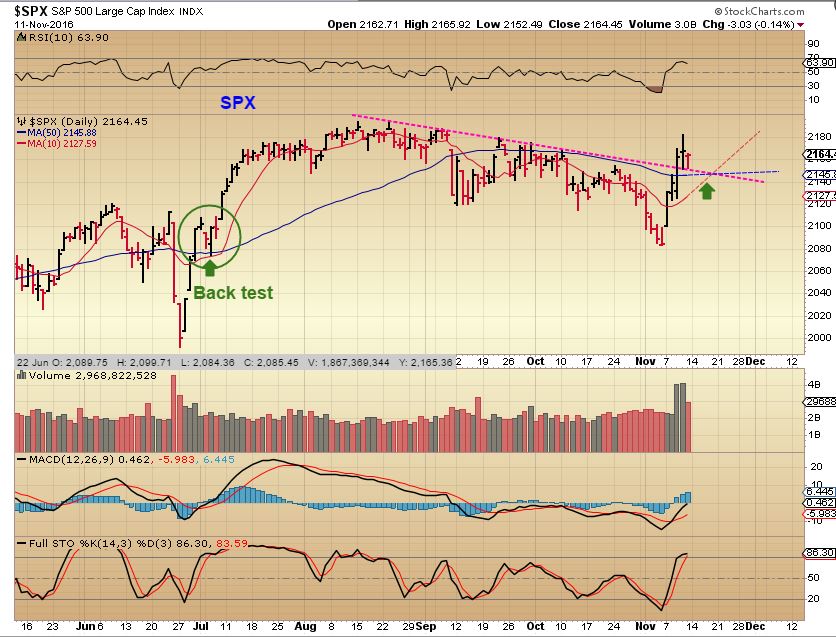
SPX – The ICL seems to be solidly in place, with a break out from the downtrend after the election results were in. Futures shot down immensely during election night, but the chart simply reflects the time that the market was open. Volume was huge after the election.
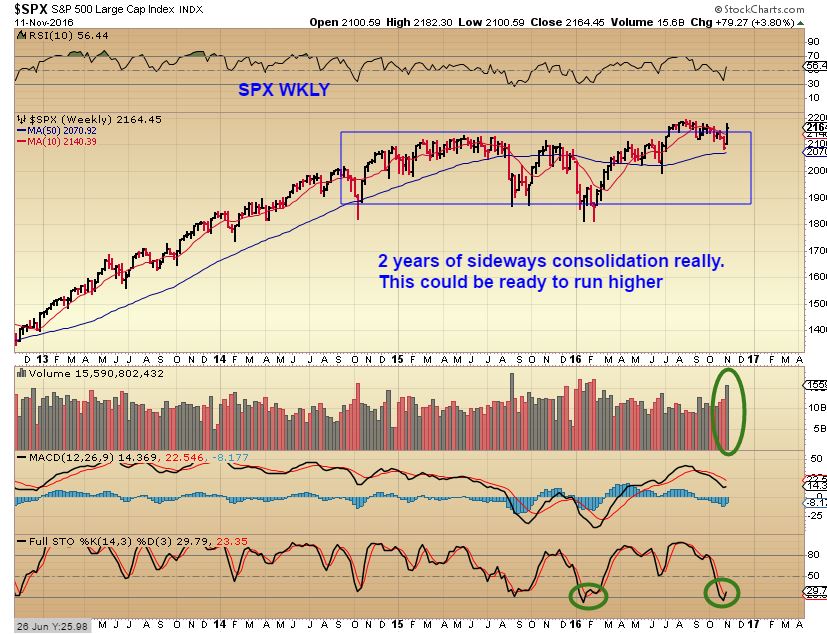
SPX WKLY – This could be a huge breakout from a 2 year consolidation, and it is oversold!
SO here is my current thinking…
Recalculating route: Trumps policy has been to promise to build a better infrastructure, add more jobs, boost the economy, etc. Can he do that? Time will tell, but this 2 years consolidation of indecision seems to be breaking out with confidence since the election results. When President Obama promised better health care, the health care sector did well. Trump promised infrastructure repair and Metals stocks blew up higher. We discussed X, AKS, FCX, VALE, STEEL, ALUMINUM, etc in reports last week, and their explosive moves. The bonds seem to indicate that inflation will come about too, and wouldn’t inflation be good for Precious Metals too? Gold shot up $50 after the election, but gave it all up in 3 days falling toward an ICL. Let’s look at the path of various sectors and see what the markets are telling us.
————————————————————–
ON DEC 4TH, WE CELEBRATE OUR 2ND ANNIVERSARY. THANK YOU TO ALL OF OUR MEMBERS FOR MAKING CHART FREAK SUCH AN AMAZING SUCCESS!
The service has grown tremendously since our launch and I have greatly expanded the content produced for members on a daily basis. We hardly ever run a promotion, but to celebrate our 2nd anniversary, new members receive 10% off their first recurring payment. See bottom of this post for details.
————————————————————–
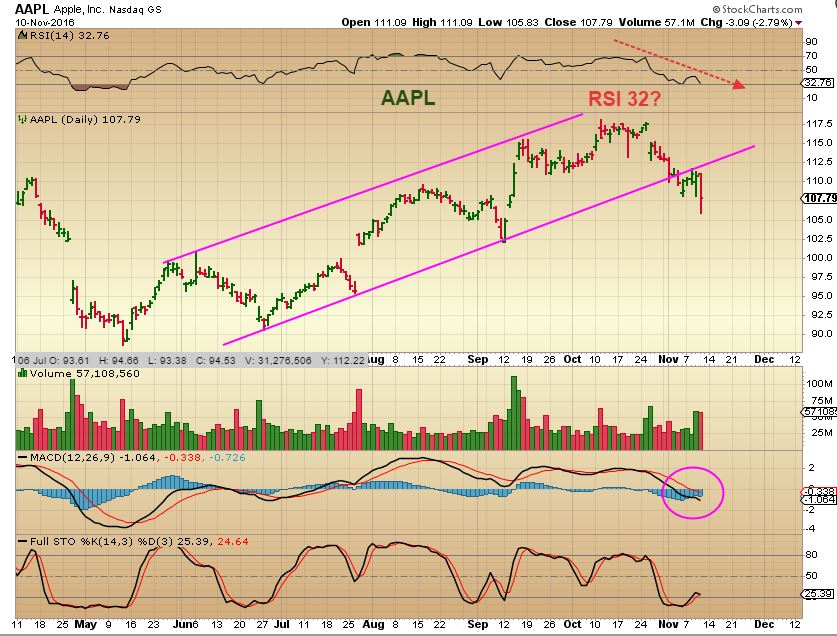
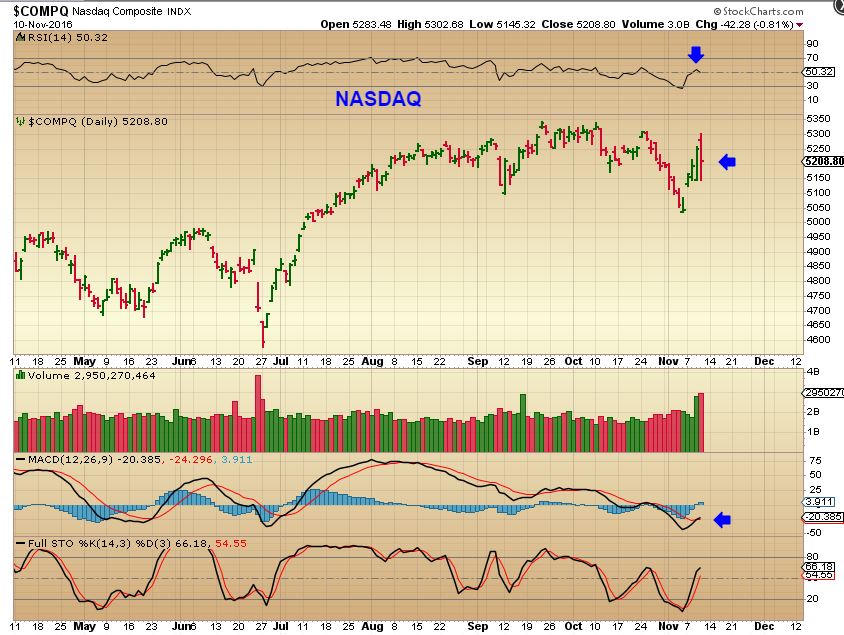
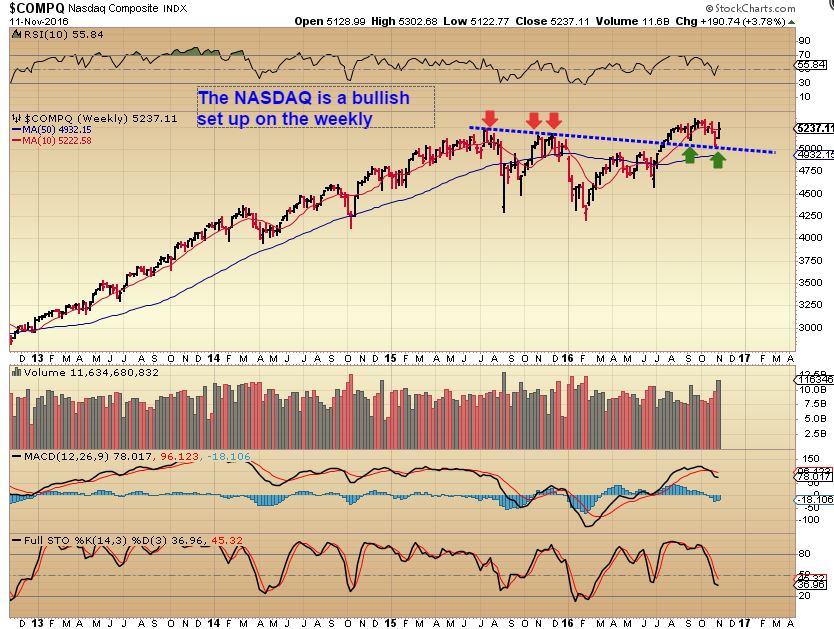
NASDAQ – I pointed out the sad looking charts of GOOG & AAPL last week . Will Tech suffer now? Should some Tech investors be recalculating their route? Time will tell, but what I am saying is that we may be seeing some shifting and we have to be ready to alter our route if necessary.
NAZ daily Thursday, I didn’t like this drop and Tech did seem to be having trouble, but Friday it went green again. So lets look at the weekly.
NASDAQ WKLY – This is still a bullish weekly chart, so the ‘trouble’ that came up after the election may just be a bump in the road, NOT a change of direction. Time will tell.
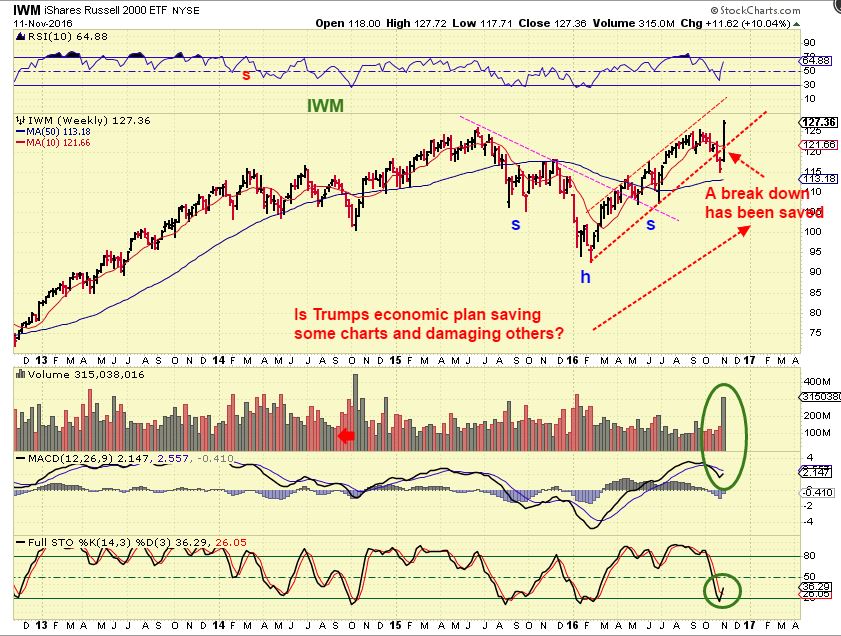
The IWM actually broke down a week ago. This election week it recovered. Was that a shake out? This is how a Bull Market throws people off ( Think Gold & Miners too). This chart was a false break down / shake out and looks quite bullish.
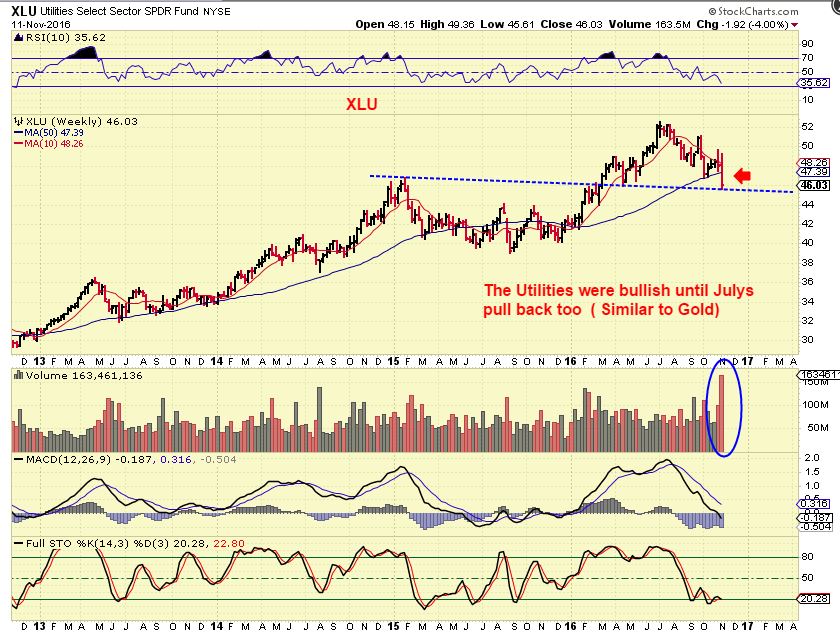
XLU – The XLU looked like it as breaking down From July to now, after a very bullish run from Jan to July ( Sounds like Gold, huh?). This week it crashed after the election results. The Big picture says to keep an eye on it, but it may still be just a back test and consolidation before resuming upward. It is oversold on the weekly. This break down may recover.
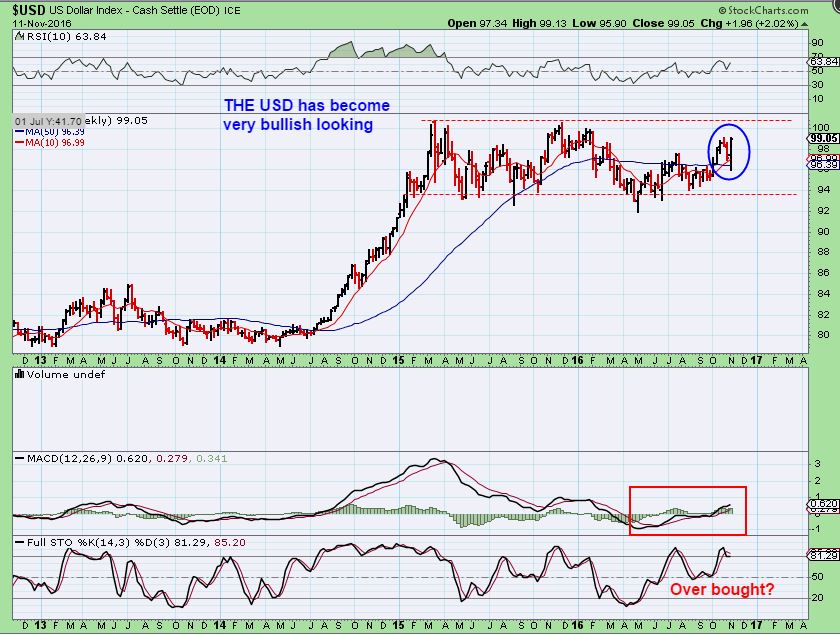
USD – The USD is due for a pullback using cycles, but currently the chart looks like a bullish break higher.
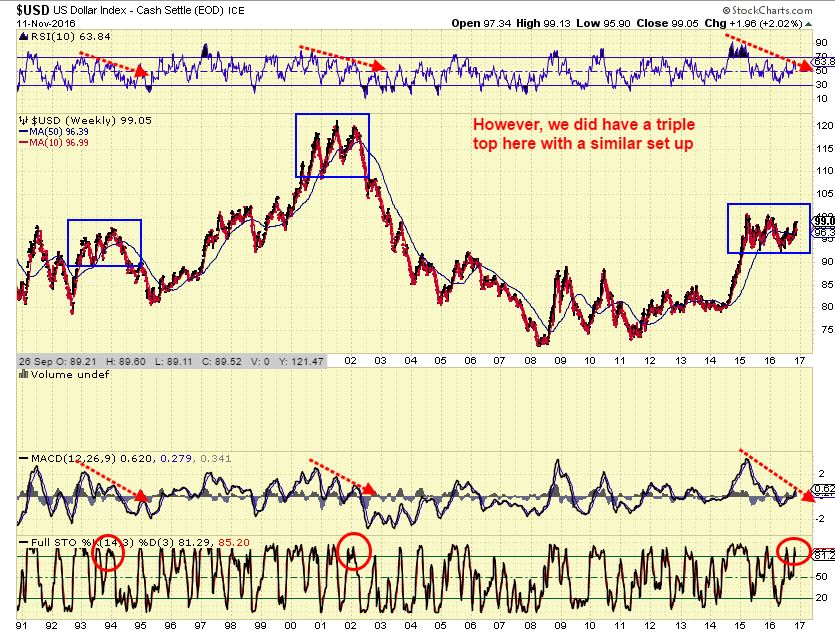
USD – We have seen this type of top before, with divergence. I am of the thinking that when the Fed sees markets breaking higher, they may actually do another interest rate hike in December. The USD may roll over with an interest rate hike. Trust me, I have studied Gold during times of interest rate hikes – It was bullish for Gold.
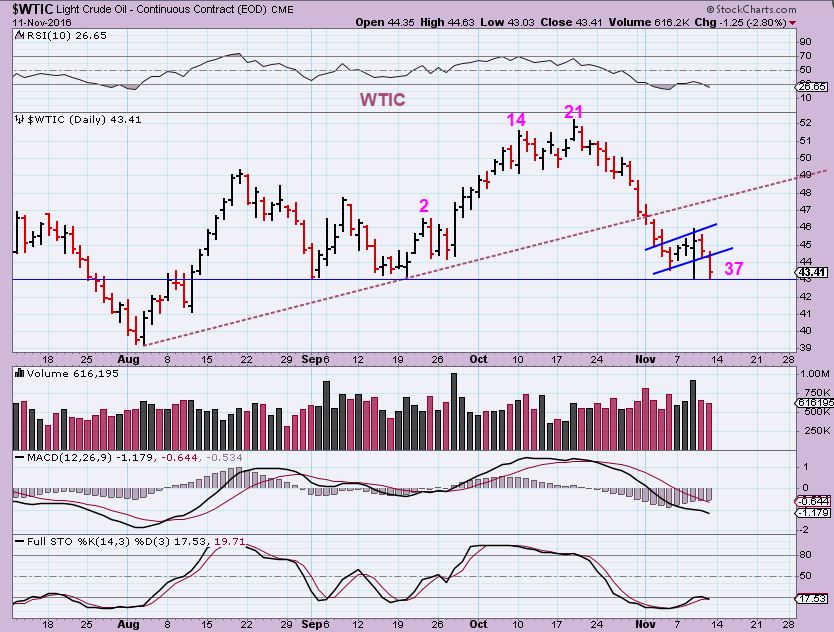
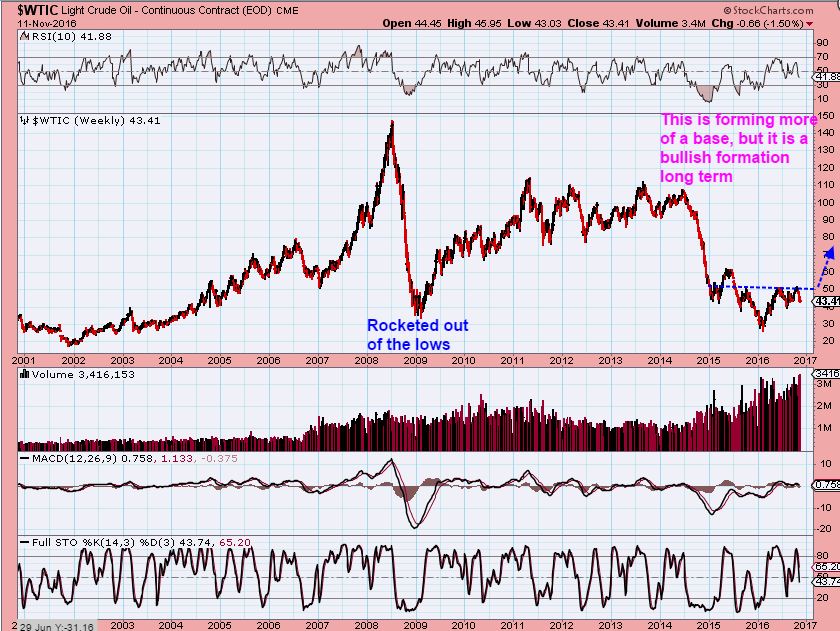
WTIC – Oil continued lower as expected.
WTIC – Oil broke the intermediate trend line, so it is falling into an intermediate cycle low (ICL). I do expect a bounce with the next daily cycle and it could back test the trend line. At that point we could drop further to an ICL.
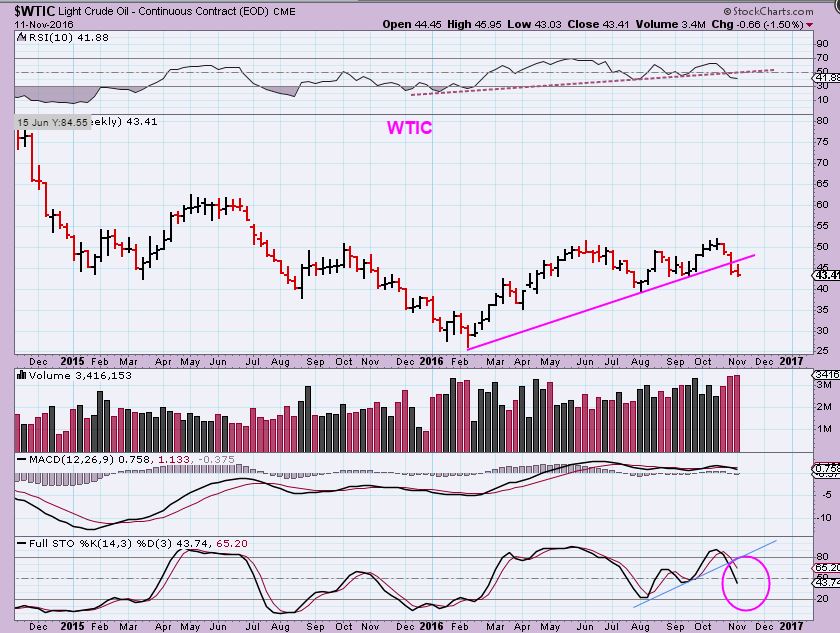
WTIC BIG PICTURE – We are not rocketing higher like 2008. I originally thought that we may see the same type of move higher, but Oil is putting in a bullish base. This looks like an Inverse H&S.
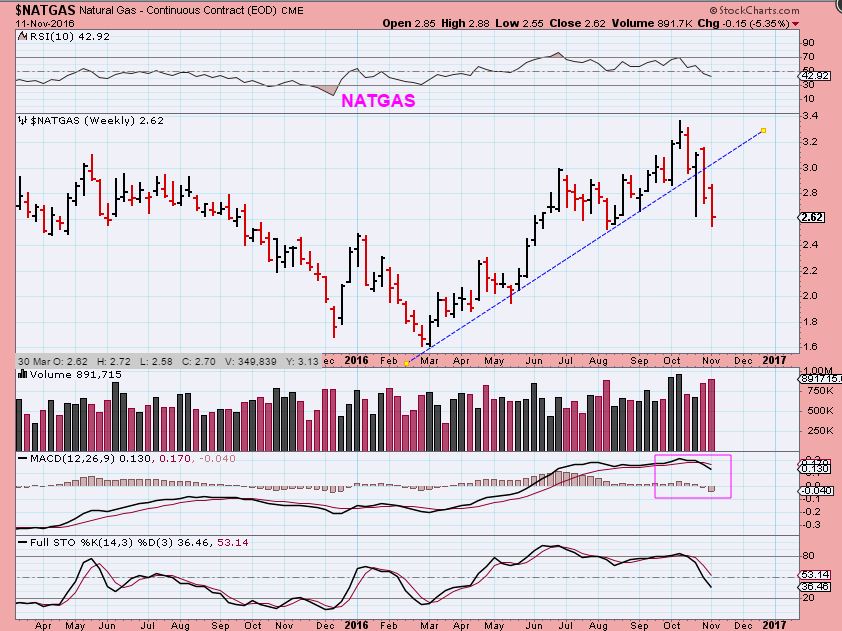
NATGAS – Natgas also began to break down.
GOLD, SILVER, & MINERS
A common question that I am being asked this week has been, “Is gold still in a bull run, or did the Elections alter it?” Do we need to recalculate our route and go short? Was Trumps election bad for Gold? Lets examine the charts and see what we can discern.
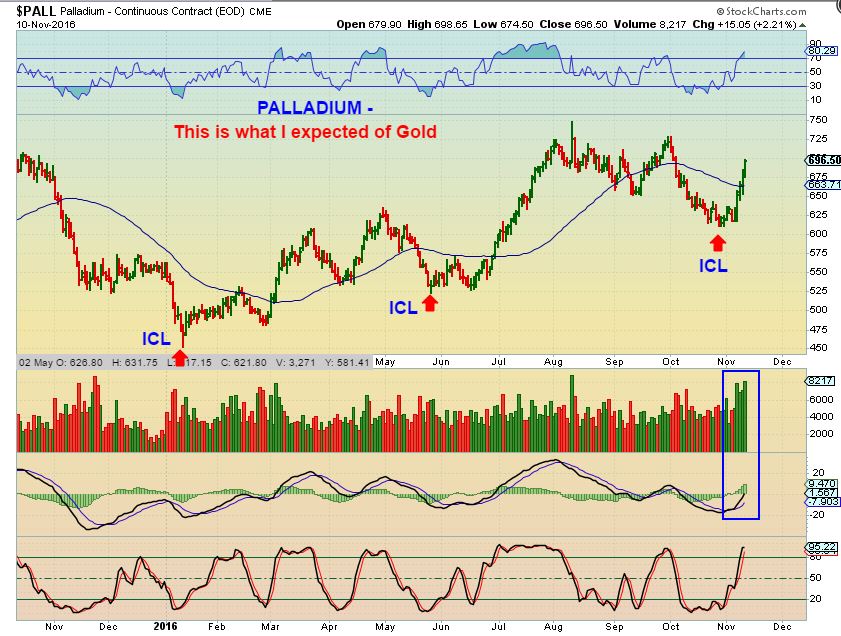
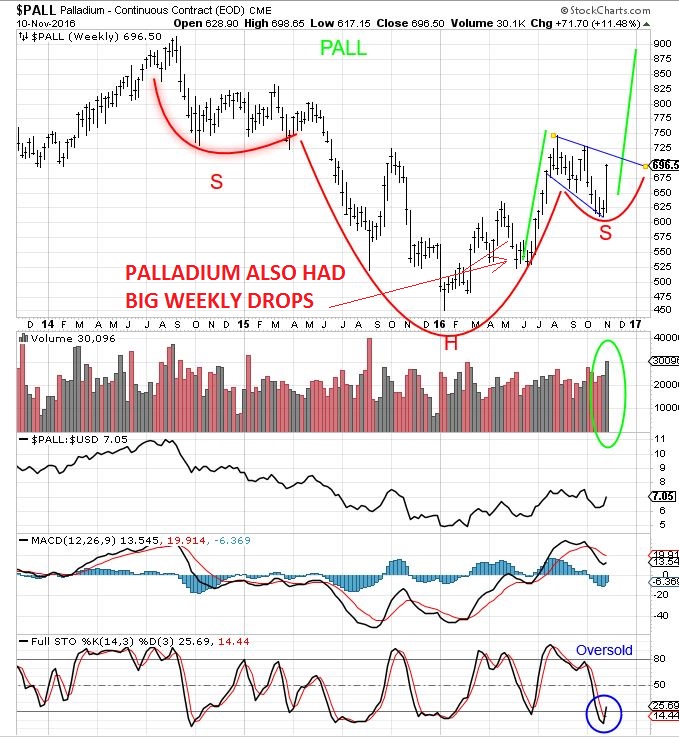
PALLADIUM looked bullish to me, it seems to have bottomed in October.
It dropped pretty sharply from July to November before it took off higher. Is it leading? Gold was doing that too, dropping from July Highs to now, and we played the daily cycle ( unfortunately, the last DCL did not hold as an ICL after the election, we need to examine that now.
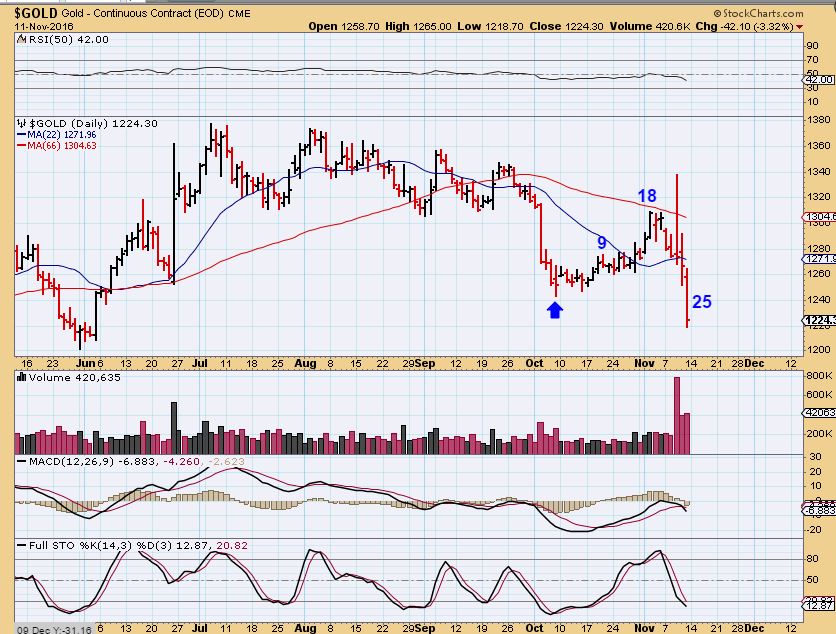
GOLD – After the elections, Gold initially reacted by shooting up $50. We then saw 3 days of solid selling, but the ‘timing’ was correct for it to head into a DCL. We knew that, but I did not think that the Oct lows should break. Why not? I compared it with former Intermediate cycle Lows, and Oct seemed to fit the requirement of an ICL. Gold broke down, but an ICL should be ahead.
Let’s Review
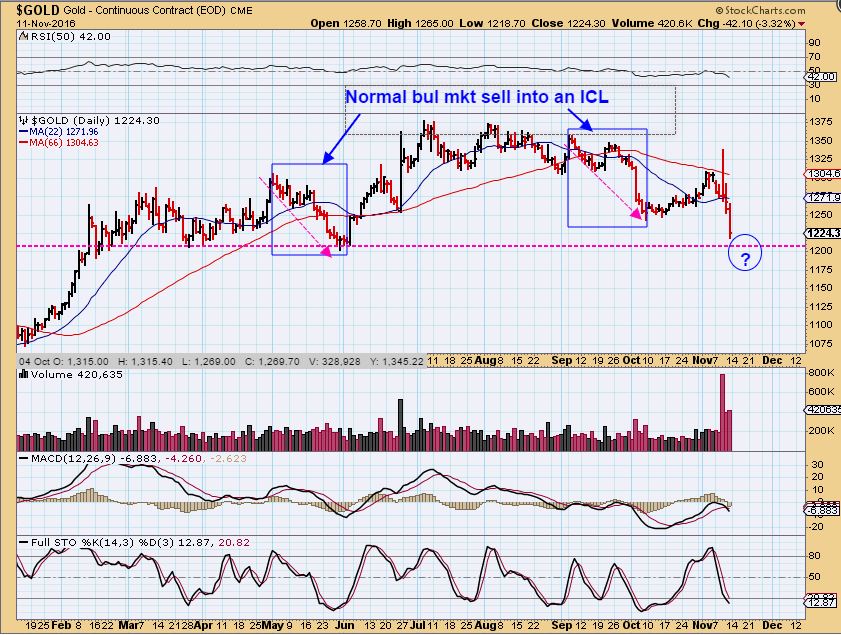
GOLD – The selling was normal for an ICL in October, but we just broke the October lows. Did the Election make Gold bearish and is it breaking down? I do not believe so, and I want to discuss this further.
Could ‘they’ (Big Money) slam this into an extended ICL to run the stops? It would be a perfect shake out that will have everyone believe that the election of Trump is bearish for Gold. In my opinion, the election of Trump is NOT bearish for gold, but again, we will watch this closely. In order for big money to scoop up a bigger slice of the pie, they would drop Gold & run stops. When the job is done, they mop up positions and it runs higher quickly.
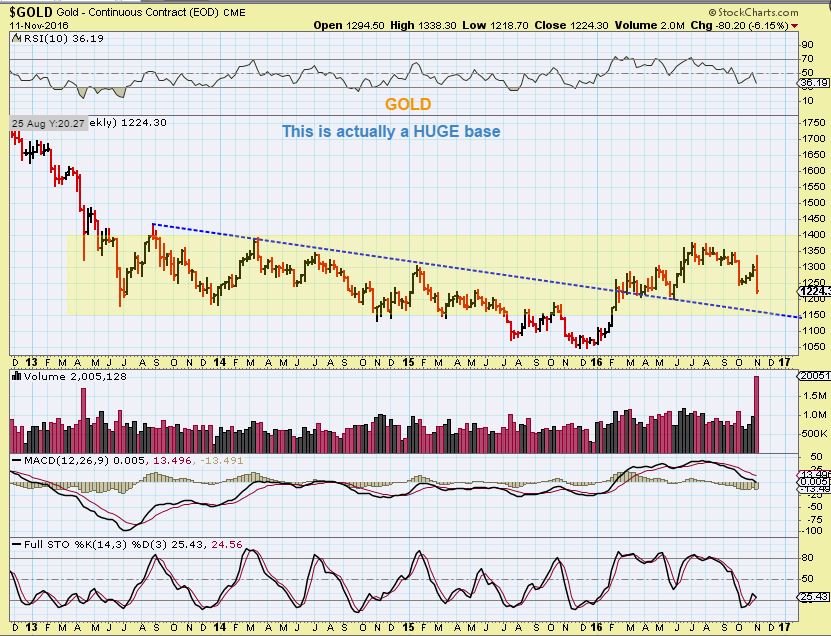
GOLD – A back test to $1150 could be considered a normal back test that would run the March & May stops. I do see that the trend line was already back tested in May, so a dip down there again really is not necessary. A drop below 1200 would actually be enough to run stops.
GOLD IN A BULL MARKET
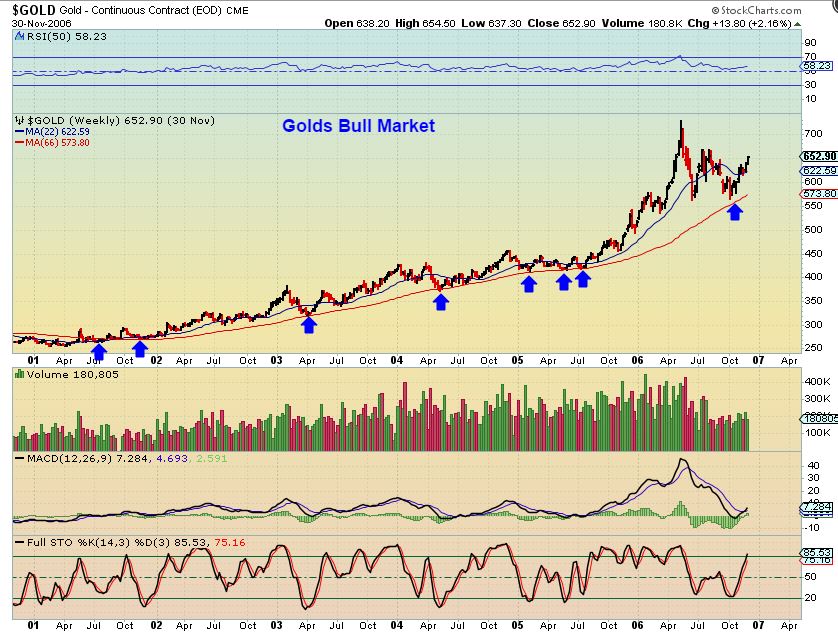
GOLD CHART #1 – This is the run from 2000 to the 2016 peak – In the past bull run would often hold up at the 66 MA. Steep drops have dropped to the 66ma repeatedly. At times I use the settings 22, 44, 66 ma for longer term reasons, because the fluctuations can be large in a long bull run ( look at 10 yr charts of AAPL, PCLN, or NFLX if you need proof that Bulls buck a lot).
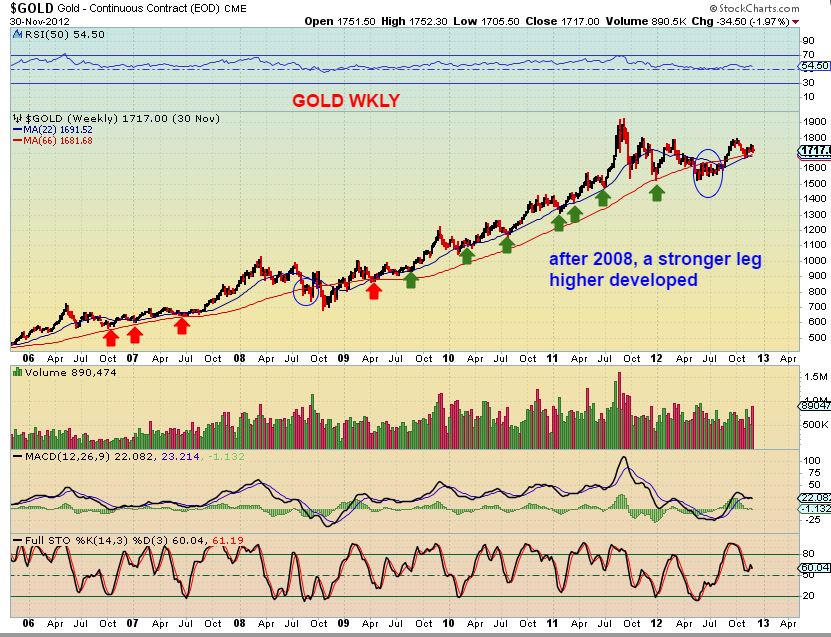
GOLD CHART #2 – from 2006-2012 peak – This steeper run from 2008 onward actually tagged the 66 within the first year, and then held the 22 from then onward. We are now within the first year of what should be the resurgence of the Bull, so let’s see what is happening now.
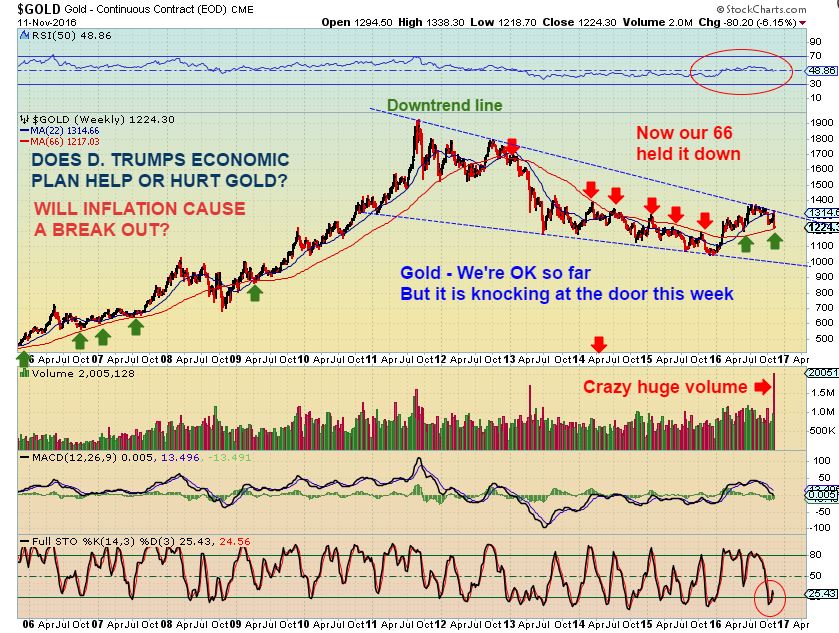
GOLD CHART #3 – That 66ma became resistance in the bear market ( red arrows), and then support in the new bull run. We are in that area now. A quick drop for that stop run below 1200 and recovery is fine, but if Gold trades below the 66 ma for too long, I would become concerned.
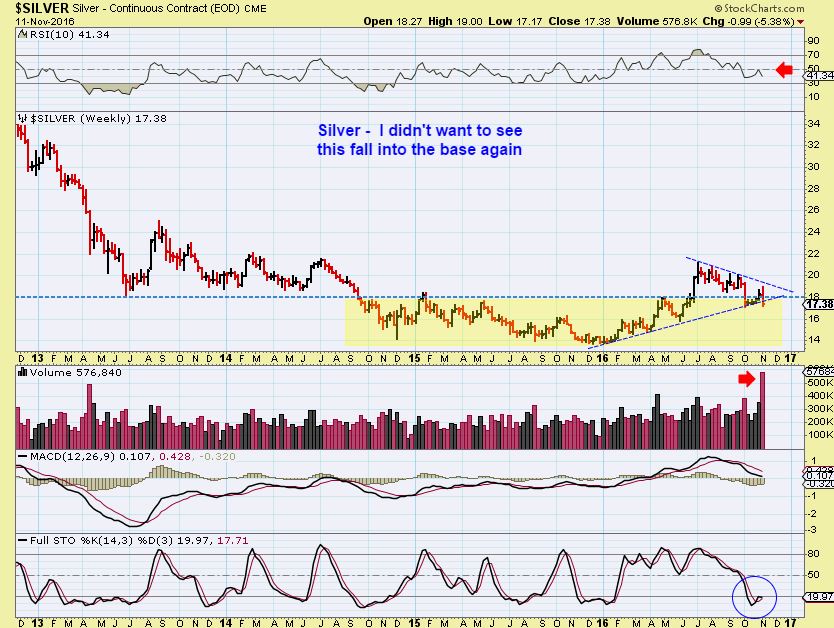
SILVER – Silver is breaking the intermediate trend line. This means it could be looking for a yrly cycle low, and then we would expect a recovery if the Bull remains active.
MINERS
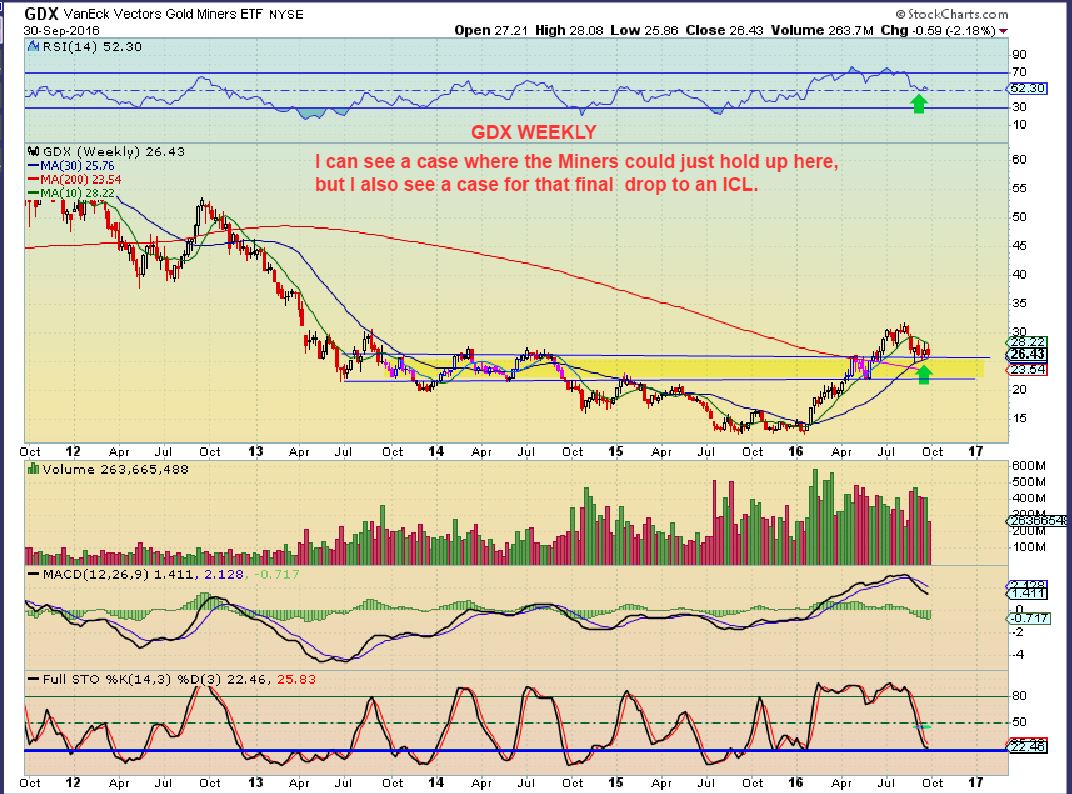
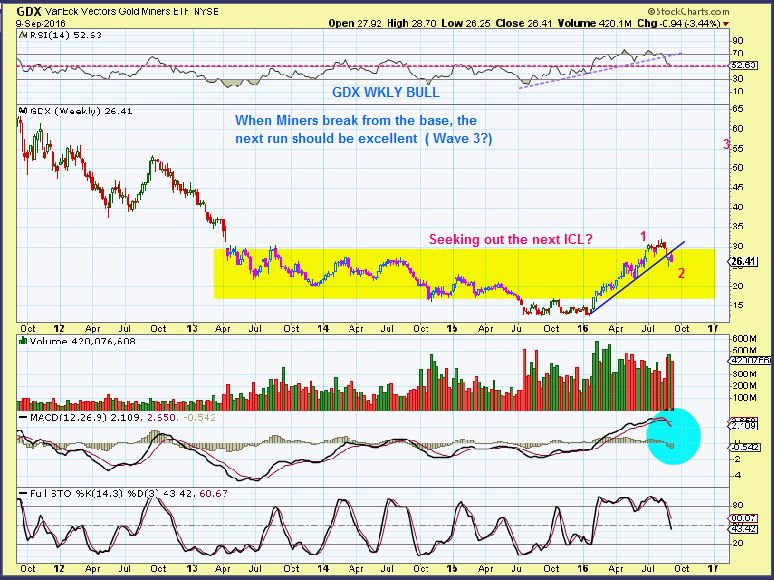
GDX – In September I drew this expectation. I wanted to see strength and support hold price, but also knew that we could drop into the yellow area for an ICL. My Sept charts show that I was discussing an A-B-C down at that time, to about $22 area.
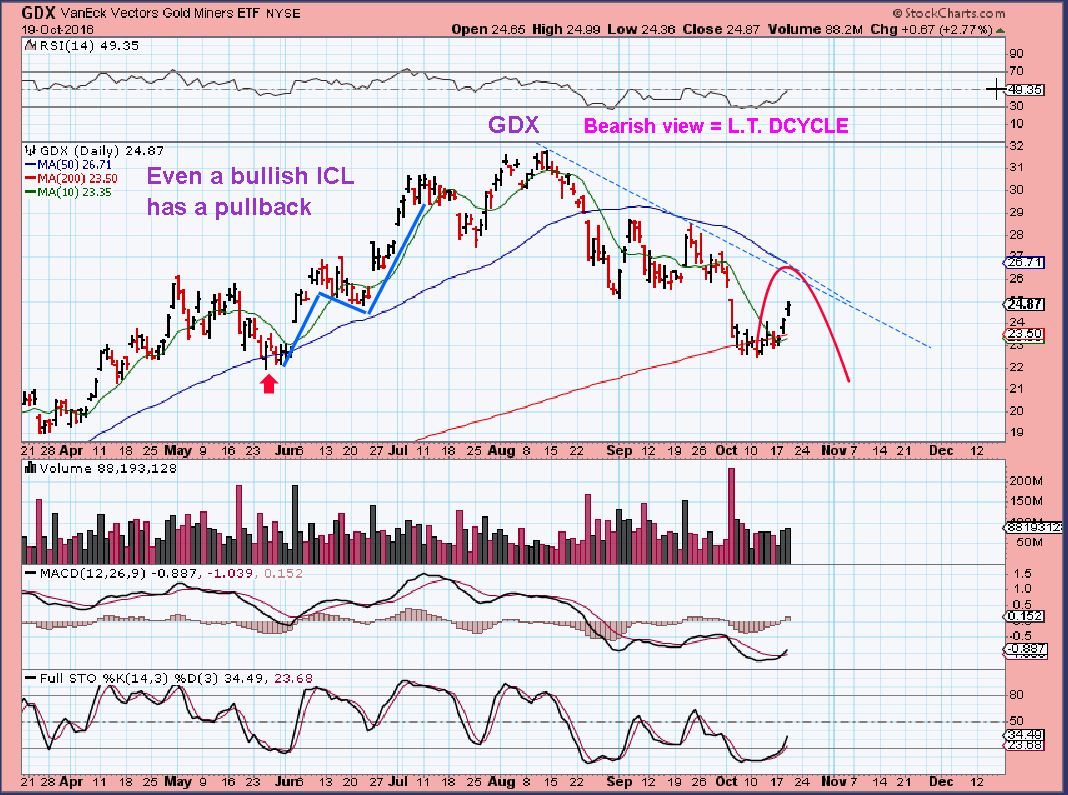
GDX OCT 19th – When I was buying the OCT lows, I said that I felt the selling had dropped it into an ICL. I pointed out that one more deeper drop could come due to cycle timing. Some Miners still have not broken the Oct lows, others have.
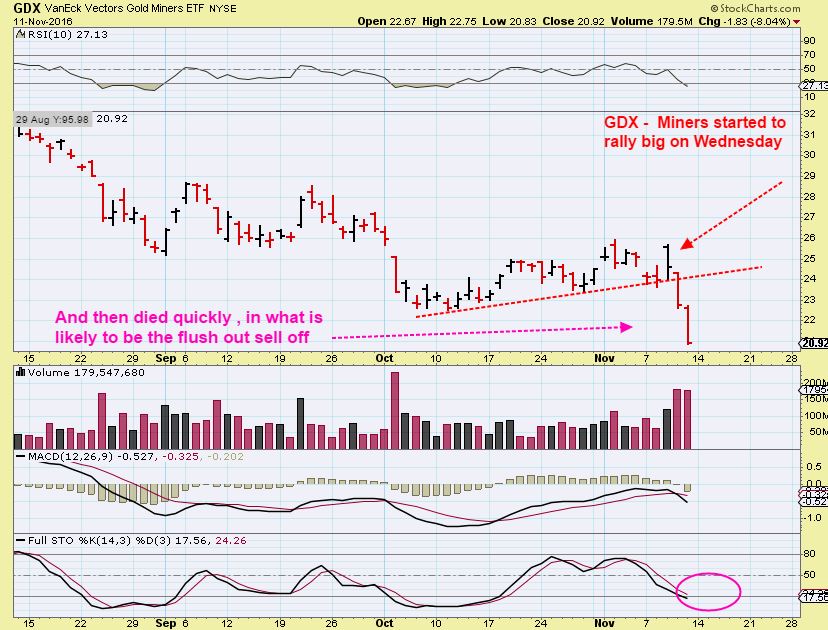
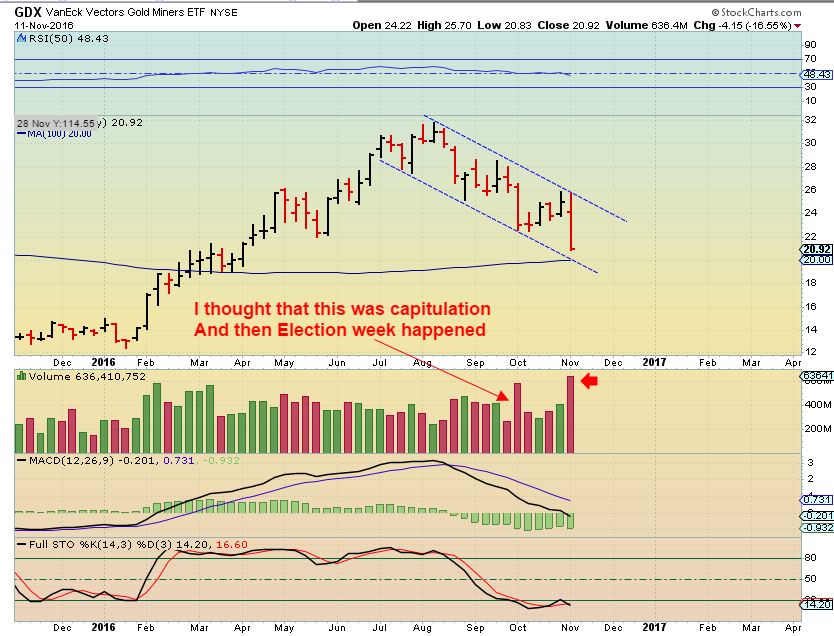
GDX NOV 11 – So here we are, with Miners rallying Wednesday after the elections, and then taking a 2 day drop that felt like 10 straight days of selling to many. GDX dropped 8% and that is big for that ETF.
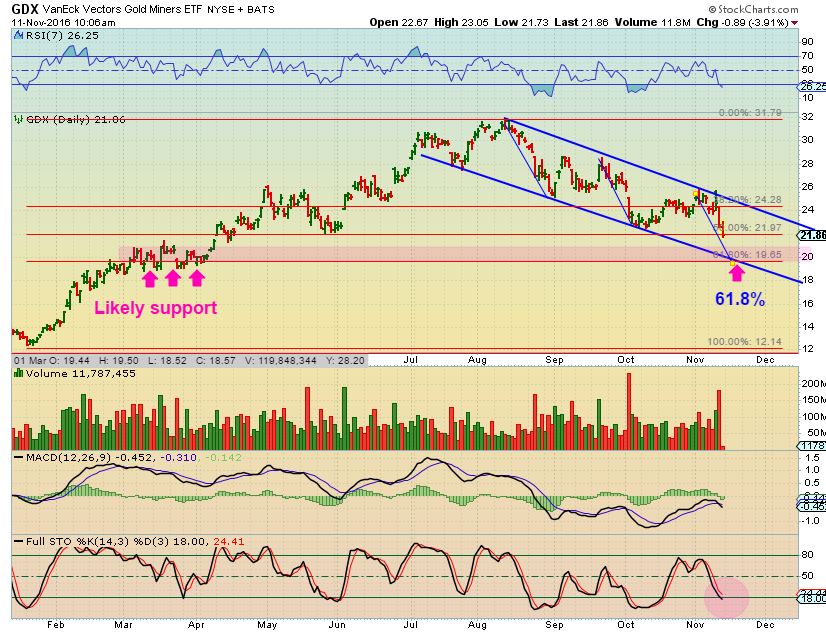
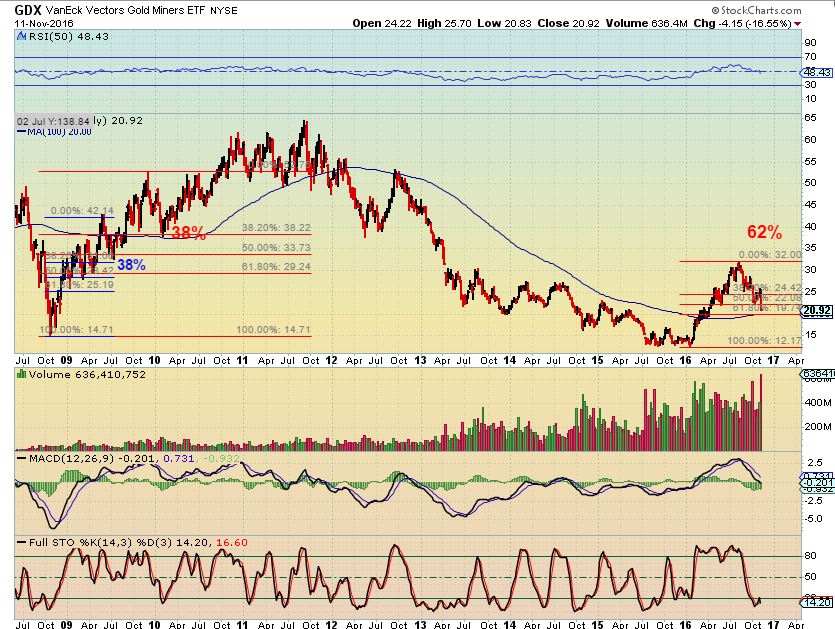
GDX Friday intraday, I posted this in the chat section to show possibilities in this sell off. We see 50 – 62% pull back is possible in Bull markets. Notice past drops of equal length with the blue lines. You never want to be holding leveraged positions in these kinds of drops, but at least you can see that they do recover in the coming bounce. Please examine the chart and then lets continue…
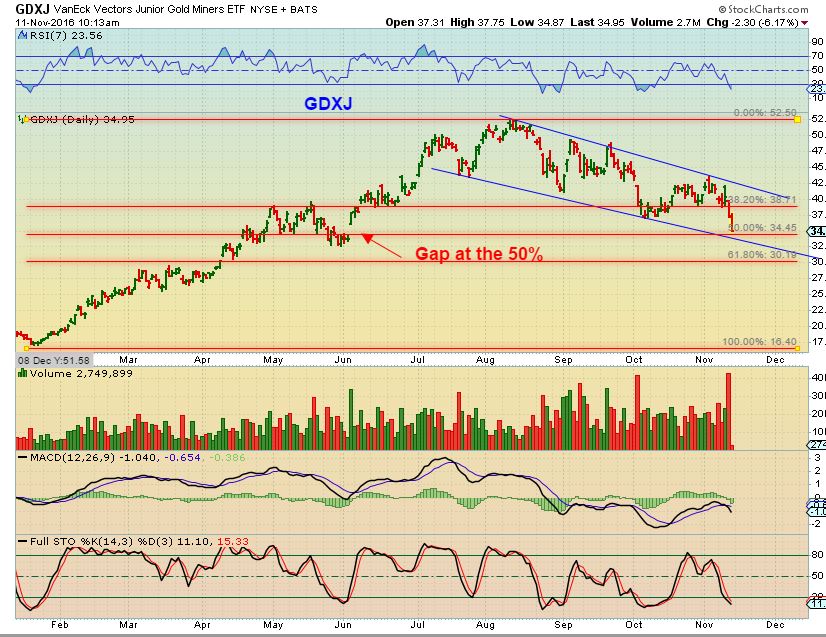
GDXJ – Same set up. 62 % pullbacks of an entire yrly move can take place in bull markets. 50% is excellent if it holds and we have a gap fill.
GDX – Capitulation drops often lead to lows and a bounce. We may drop this week and then see a reversal in the same week.
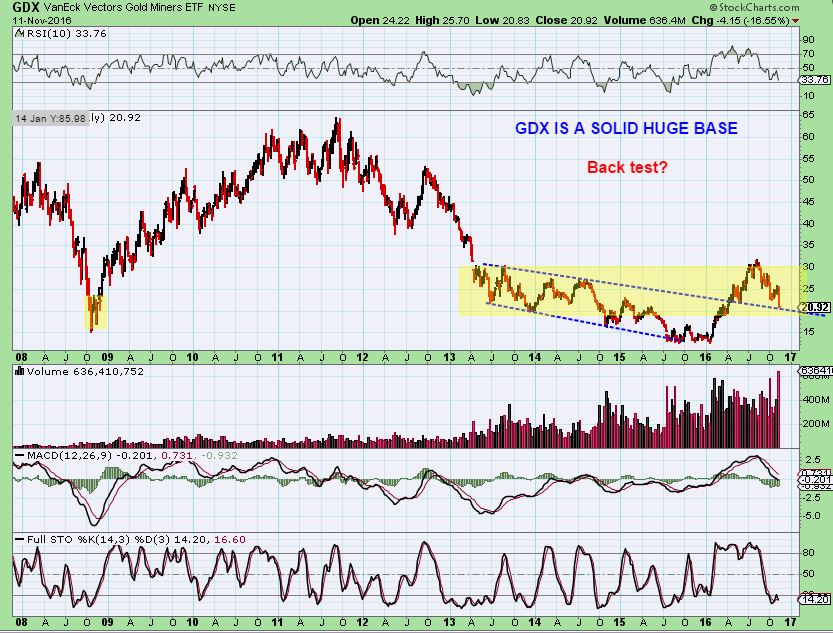
GDX – Is this a back test into a yearly low?
GDX – The dips in 2009 & 2010 were not steep, but the ride higher was much bumpier. They were 38% pull backs. This one has been steep from July, but it was also quite a straight up shot from Jan to July.
MORE RESEARCH AND FACT FINDING HISTORICALLY
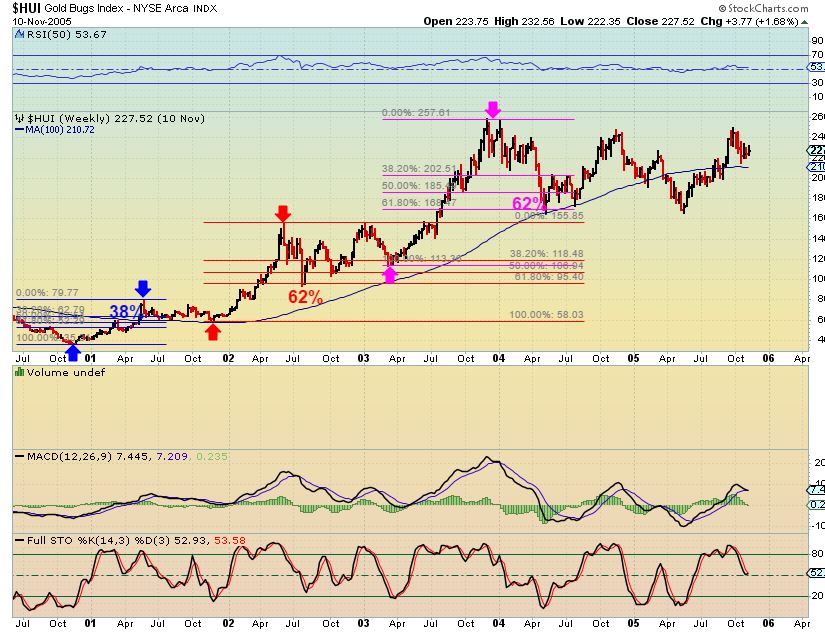
HUI FIBS – The HUI did put in steeper drops in the bull run, even 62% pull backs. Those must have concerned many buy & hold investors. This is a weekly chart. Notice that 2004 drop fell for 4 straight weeks into a 62% pullback. I’m sure many questioned the bull then too.
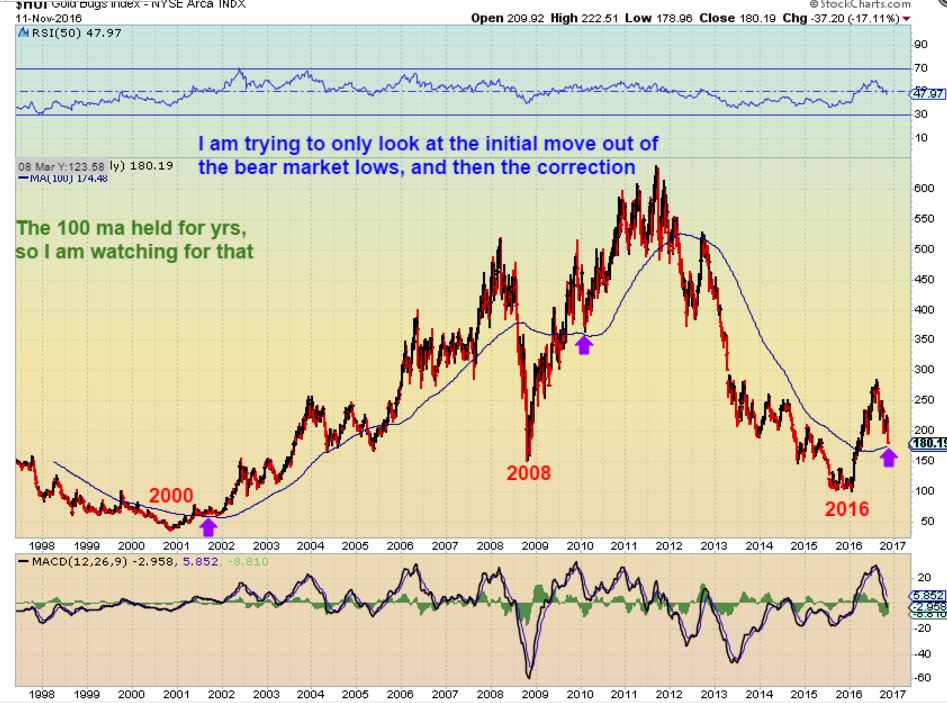
HUI – Here I am ONLY looking at the first part of the move out of bear market sell offs. In 2001 and 2010 the 100ma acted as support. HUI 174 is where the 100ma is now. Notice that that steep sell off in 2010 looks a lot like the one we have now.
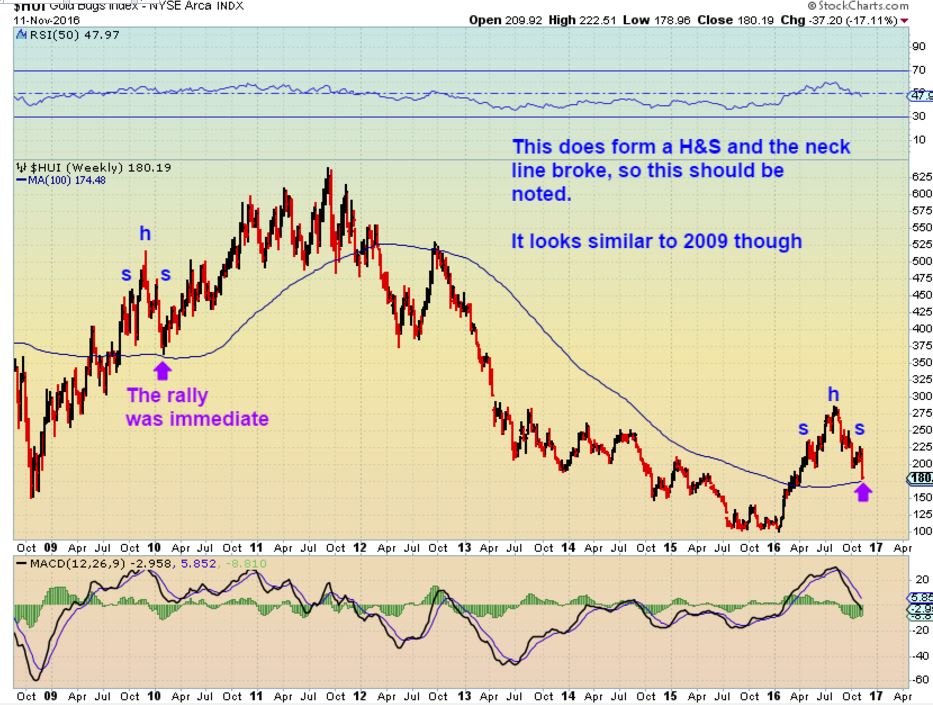
HUI CLOSE UP- I see that H&S and it does concern me since the neck line broke last week. HUI back above 200 will negate it, so that is something to look for in the coming weeks.
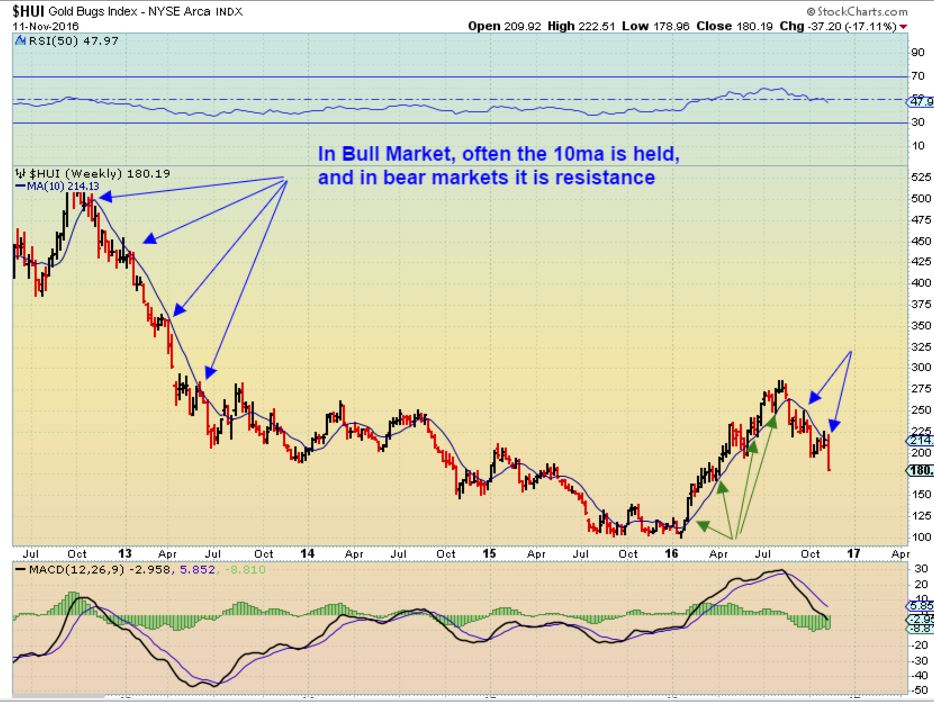
HUI – This bothered me and I will be watching this too. The 10ma is now acting like resistance at each daily cycle high. We broke above it after the Election results, and I was quite happy about that. Then the drop started the following day.
Is this Sector ‘Finished’? It’s time to look at the reasons why we can still be bullish.
Miners are reporting earnings that are beating last year and showing signs of recovery. Are they all now crashing down?
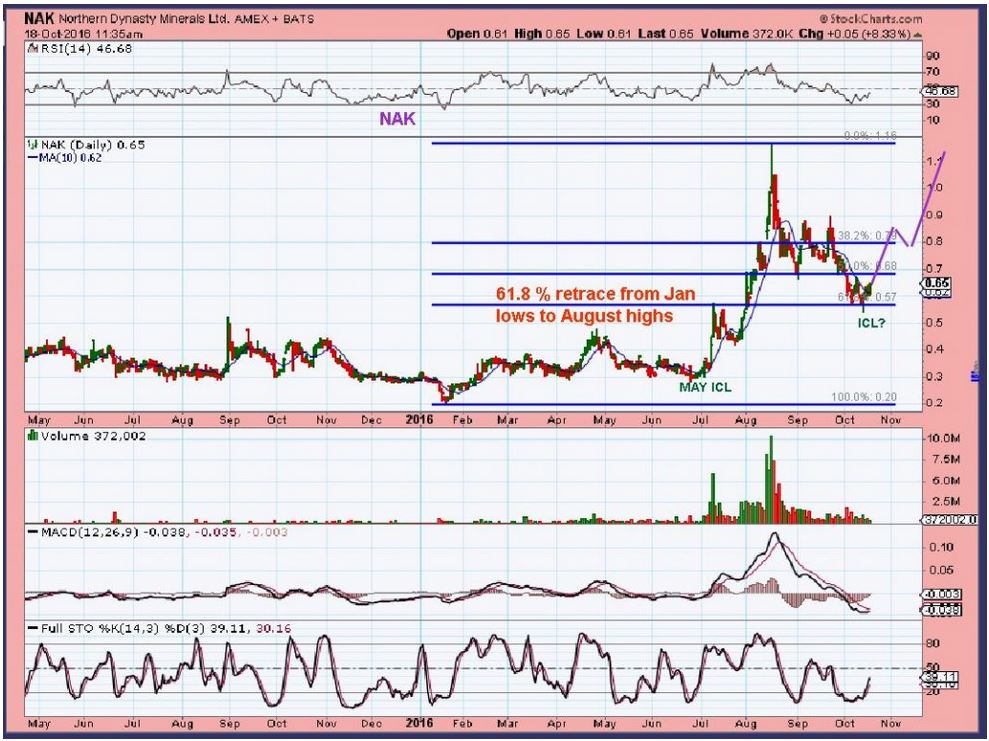
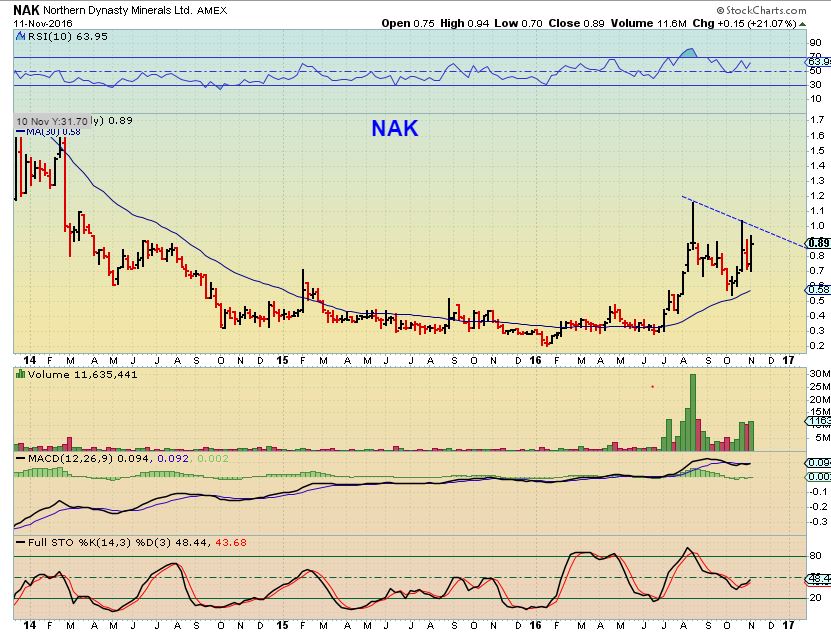
On OCT 18th, NAK hit the 62% retrace point ( like GDX is now). People hated owning NAK then ( like Miners now?).
NAK – NAK turned higher off of that 62% drop and is still recovering.
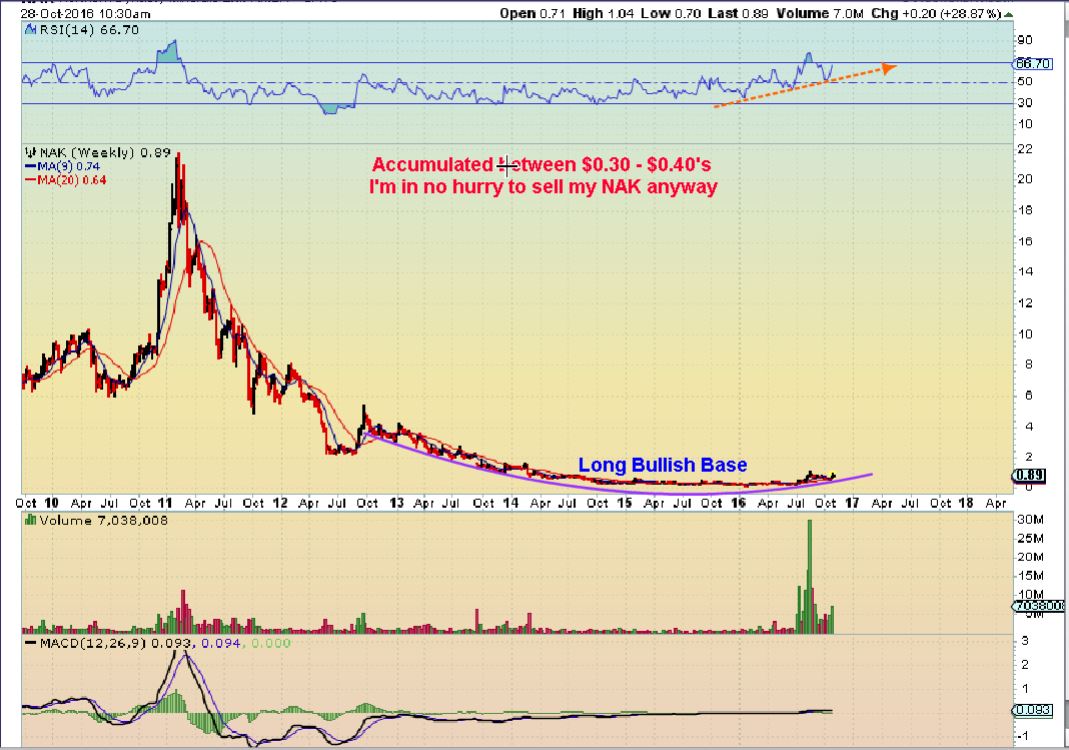
NAK – I drew this on Oct and I cannot say enough about the implications if this plays out.
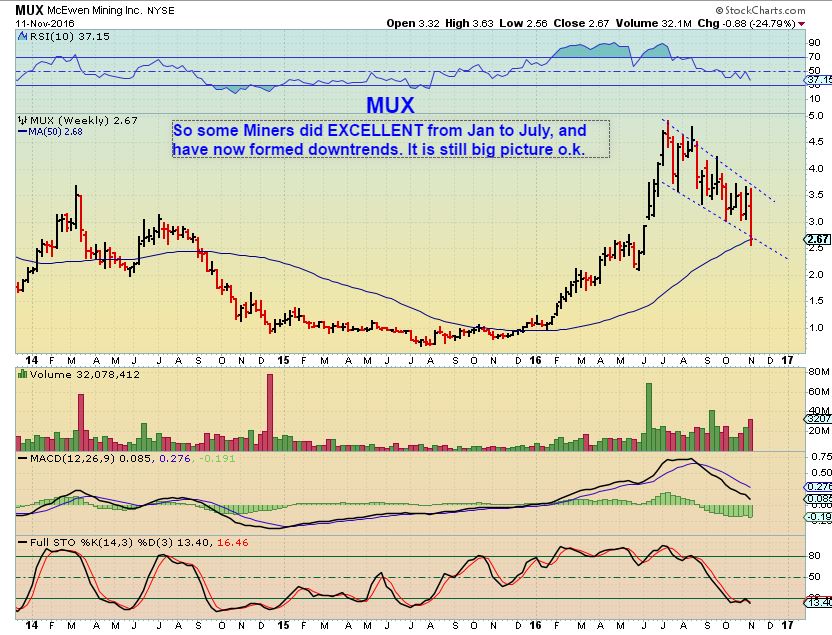
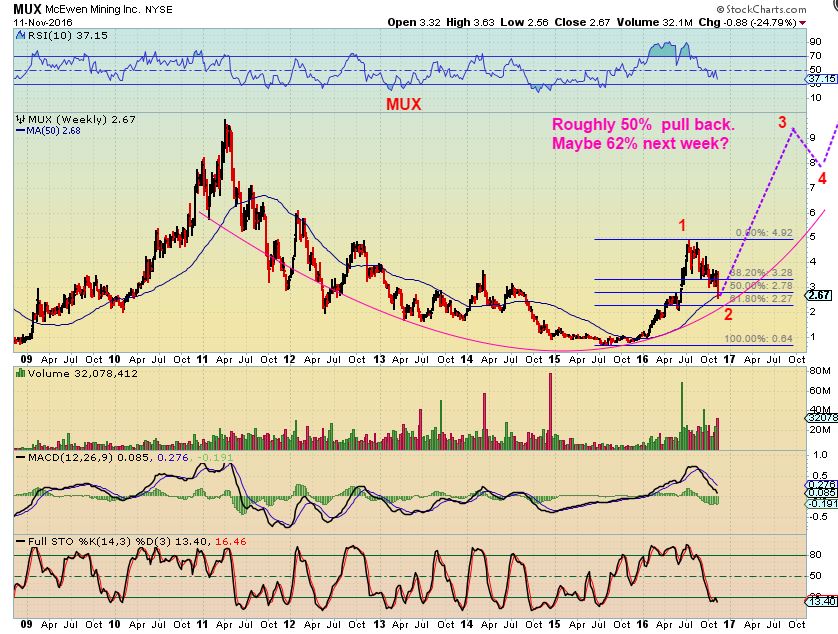
MUX – I broke a rule and did not allow myself to be stopped out of my MUX position above $3.00. I bought it in October, rode it higher to above $3.50, and yes, gave up more than just the gains. It is now at $2.67. It is often painful when I break my own rules. I didn’t sell because I expect a daily cycle low this week and also this chart of MUX shows it near what I expect to be the lows. I will sell the bounce out of the next daily cycle low if it doesn’t act correctly, but I expect that it will go to almost $3.50 even on a bounce (overhead Trend line).
MUX – I also made a lot of money on the first run higher this spring, so I felt that I have some ‘House Money’ as a cushion. Not allowing my stop to take me out at $3.00 may hurt for a bit, but long term in a bull market can erase a mis- timed entry. A 1-2-3-4-5 type move would reap large returns.
CAN THEY REMAIN IN A BULL MARKET WITH THIS SELL OFF?
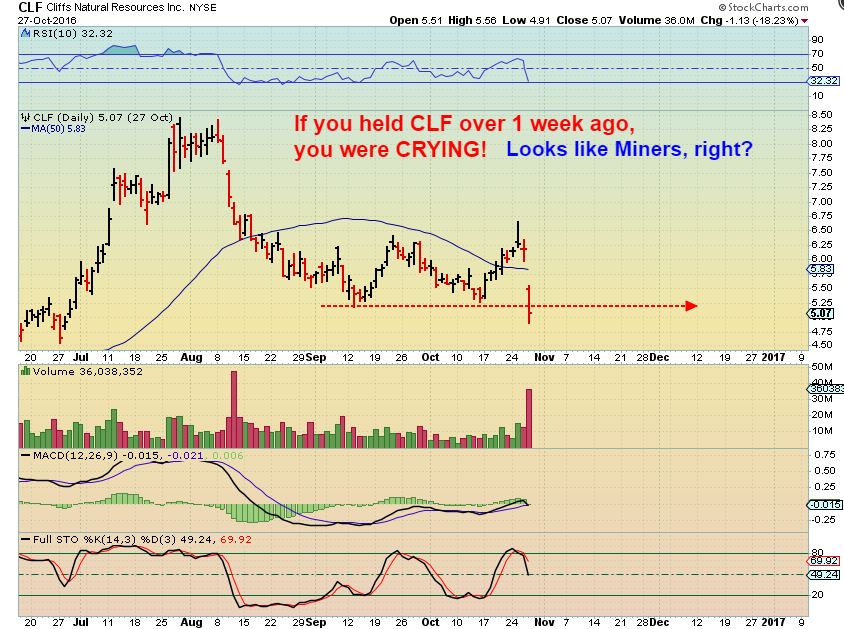
When I was posting how strong Steel and Copper looked, look at what CLF did.
If you owned CLF just over 1 week ago ( like Miners today) You’d be crying. Look at that volume, it looks a bit like GDX now. So is it hopeless? People are tweeting to me, “The Bear market for Gold obviously returned!” Look at this horrible chart of CLF a week ago, similar to GDX now.
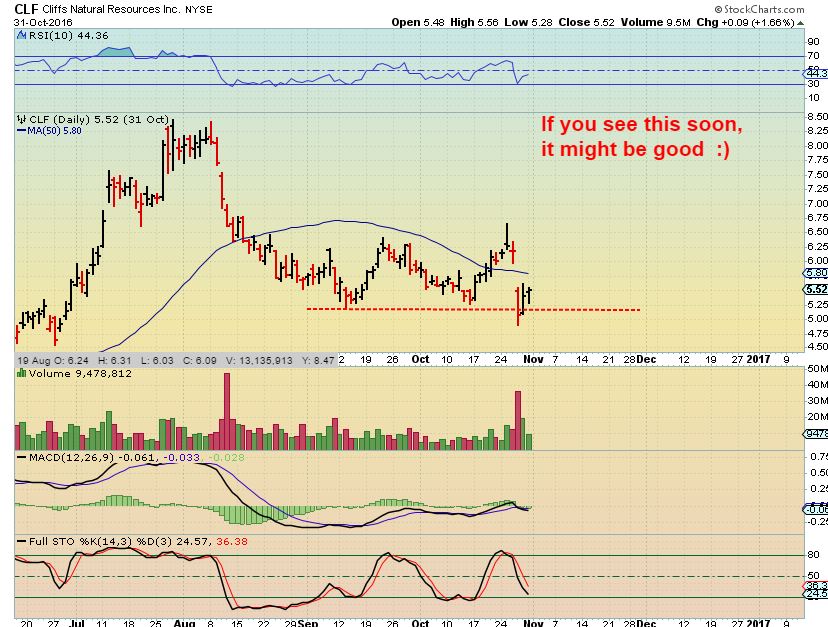
CLF – Will Miners sell off Monday a bit more, but start to recover the shake out lows like CLF did here? Was that a stop run in CLF, recovering a day or 2 later?
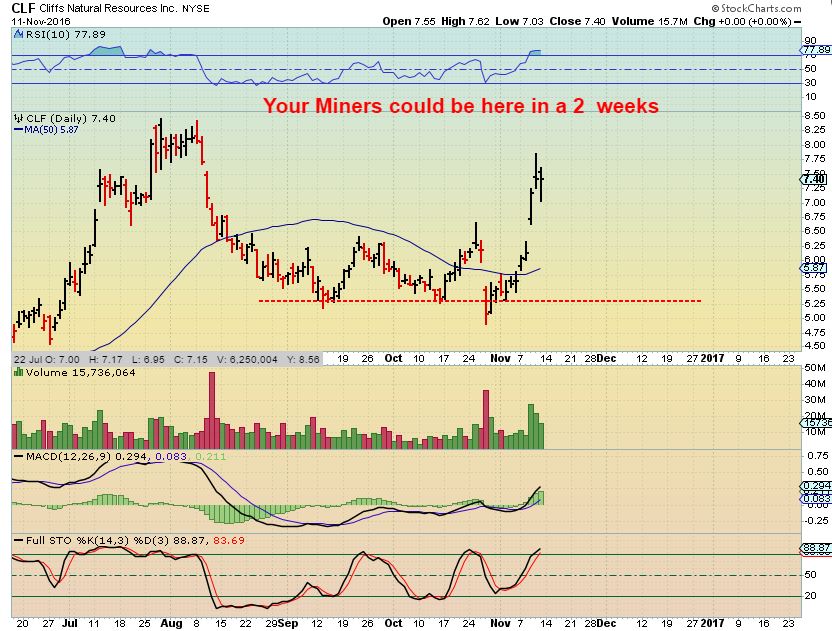
CLF – Is this possibly what our Miners are going to look like, going into the end of the year? A stop run to panic bulls out.
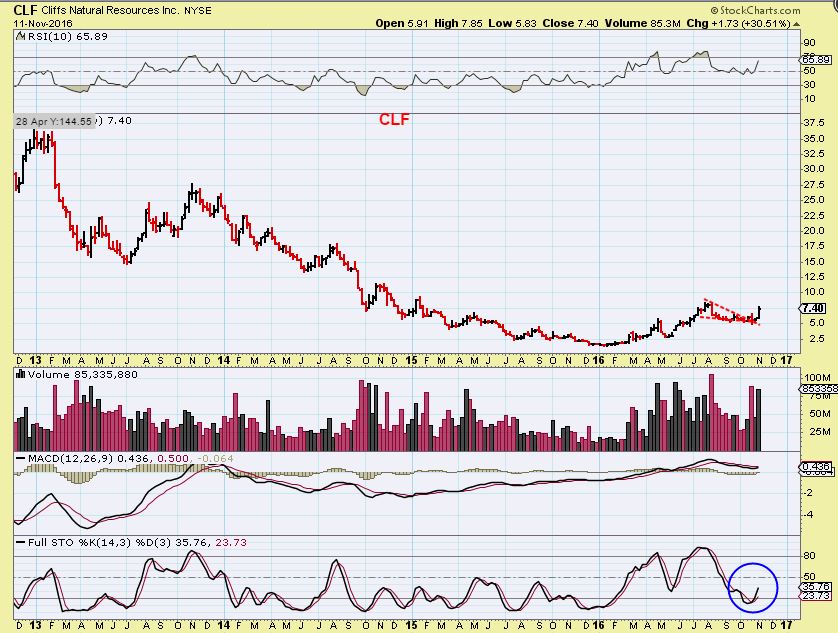
Calculating route: By the way, we made great money last spring on the run from $2 to $5, and CLF ran very strong this week. We may see a pullback on a daily basis, but CLF WKLY is still so bullish and oversold, even after that shake out. Do you see the potential?
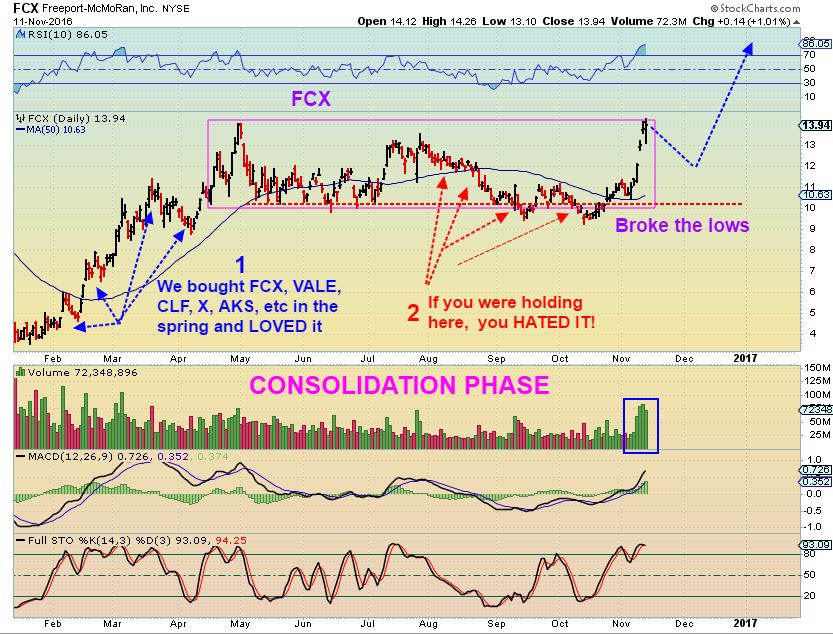
FCX – This is how bull markets work to shake off riders. A strong rally is followed by an consolidation and shake out. When everyone wants to sell, it can take off for another run higher.
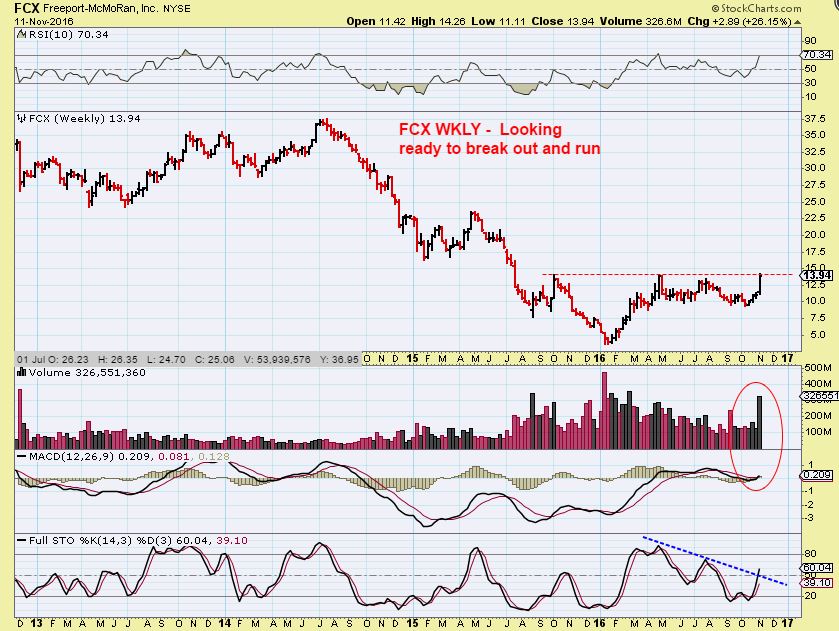
FCX WKLY – And yes, it is just about to break out with huge potential again.
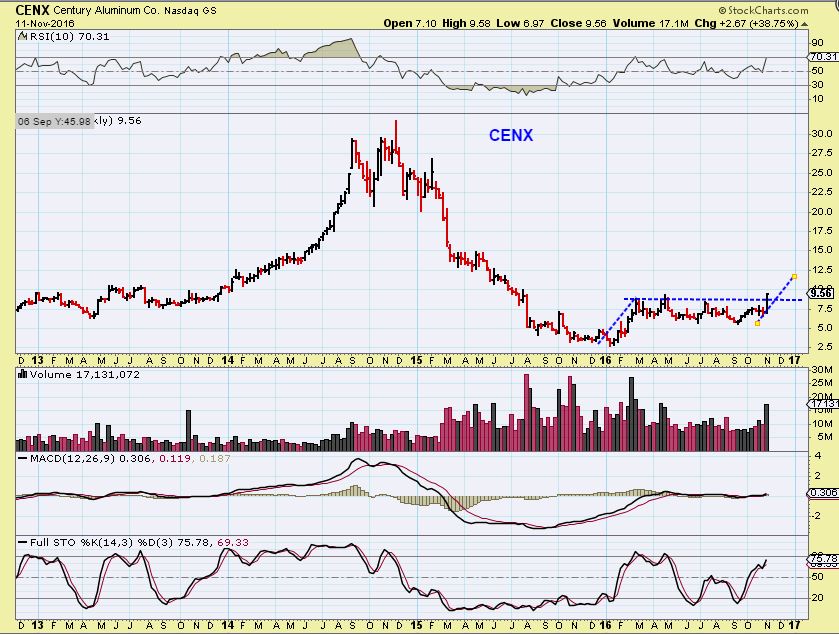
CENX – Ditto
So it seems that with the election of Trump in the U.S., we have a bull run continuing in the Metals sectors like Steel , Aluminum, and Copper, but what about Gold, silver and Miners? Is it time to recalculate our route with the election of Trump as the new U.S. president, or is that sector just doing a bullish shake out before continuing higher?
The Bond market seems to be calling out inflation, and inflation has been good for Gold in the past. Also rising interest rates have been bullish for Gold in the past. It is possible that Big Money ran the stops on those shorting gold by pushing it higher by $50 on the eve of the election to stop out the shorts first, and then flipped short to run the stops on the downside? We may be witnessing a huge shift from weak hands to strong hands, a flush out before the Precious Metals sector begins the next launch higher. Look again at the chart of CLF and FCX. They changed from sell off to rally in no time.
A ‘wave 3’ of 1-2-3-4-5 was shown here in September. In my opinion, wave 2 should be ending soon. I remain bullish in this sector at this time for reasons shown in the many charts above, along with possible inflation and interest rate hikes on the horizon. As usual, Time will tell. Thanks for being here and enjoy the rest of your weekend.
-SALE-
THE SERVICE HAS TRIPLED IN SIZE SINCE LAUNCHING AND ALEX HAS GREATLY EXPANDED THE CONTENT PRODUCED. THEREFORE, MEMBERSHIP RATES ARE GOING UP AN AVERAGE OF 15% ON DEC 4TH. LOCK IN THE OLD RATE TODAY FOR LIFE, BEFORE DEC 4TH. AND TO CELEBRATE OUR 2ND ANNIVERSARY, GET 10% OFF THE FIRST RECURRING PAYMENT TOO.
Chart Freak Premium – Limited time promotion.
Chart Freak members receive up to 5 premium reports per week covering a wide array of markets, as this public post illustrates. Come and join the ChartFreak community as we trade the new Gold Bull Market and various trending sectors.
~ALEX
.


