Archive for month: January, 2016
Miners are moving higher as expected. Granted, they aren't exactly acting like the above picture, but lets look at some charts and see where some opportunities may be.
EGO - After basing in a tight inverse H&S type base, EGO is just breaking out above the 50sma now.
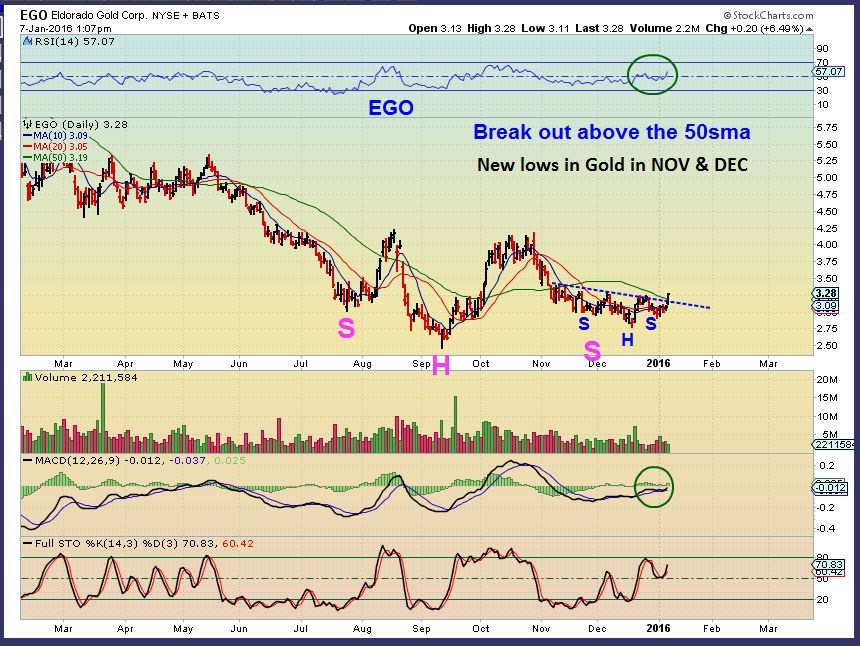 Read More
I dont regularly watch CNBC, but I was in the waiting room today and CNBC was on and I actually saw them reporting that North Korea tested a Hydrogen Bomb and caused the markets to sell off. I guess they dont use charts? Was todays sell off sudden and unexpected?
.
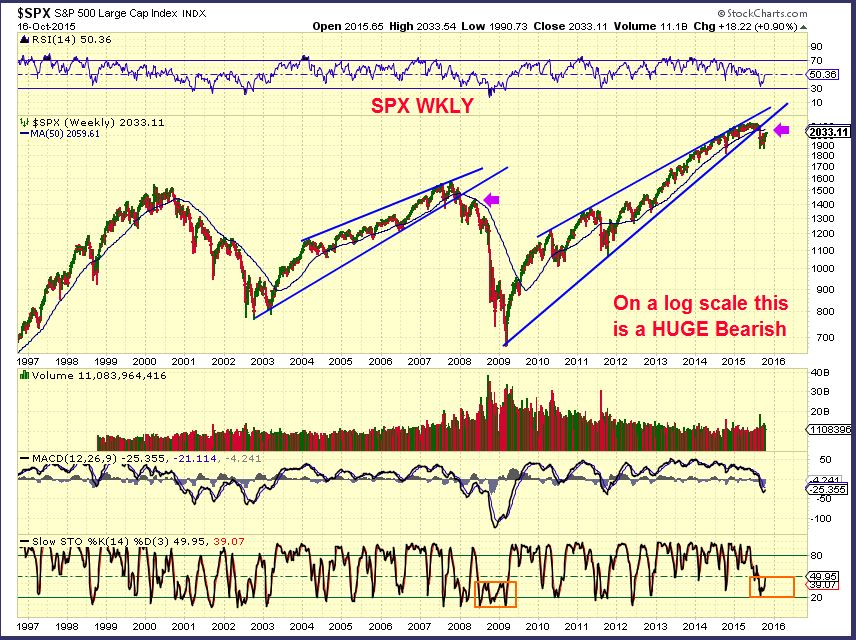
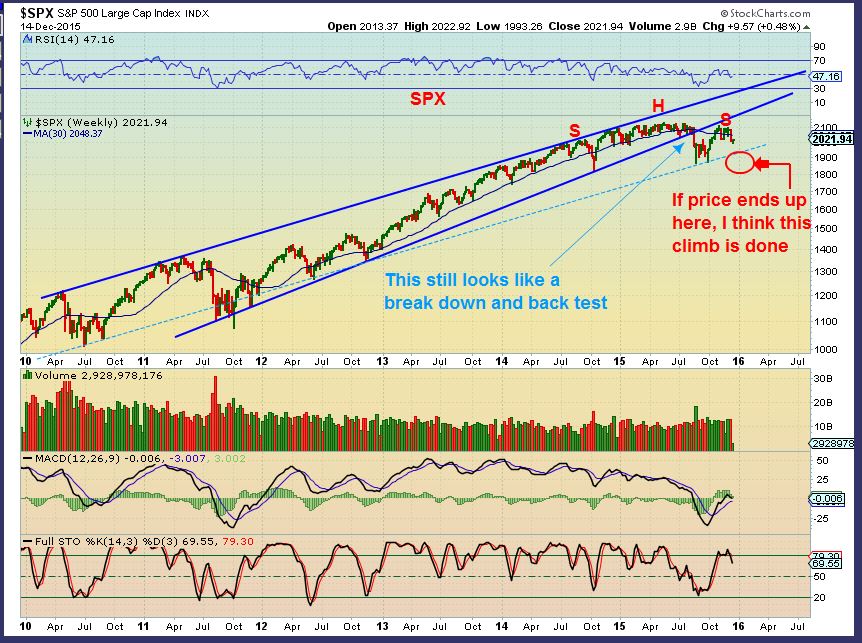
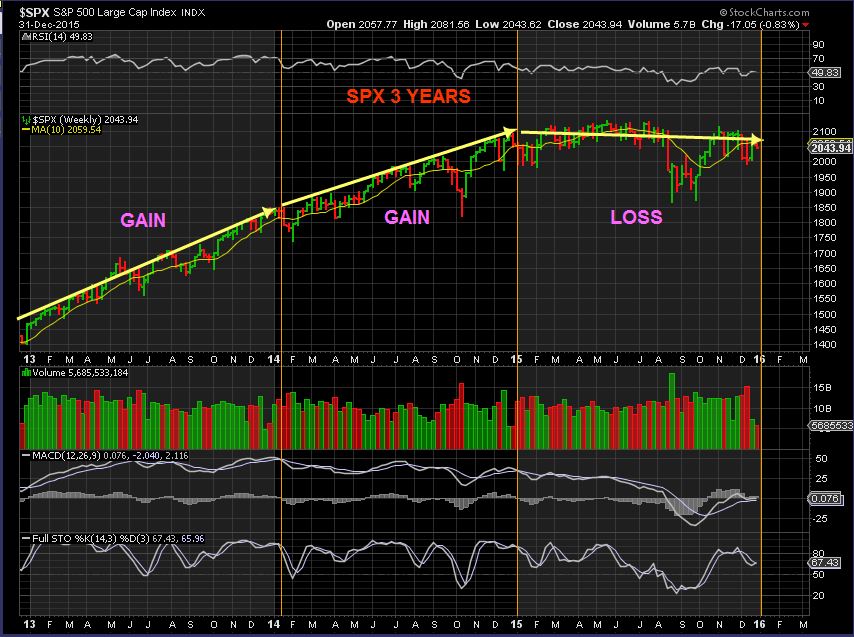
SPX - We've been discussing it for months here at Chartfreak. This Dec 31st chart showed that the SPX hit the top of its trading range, lost the 50sma, and was likely heading lower into 2016.
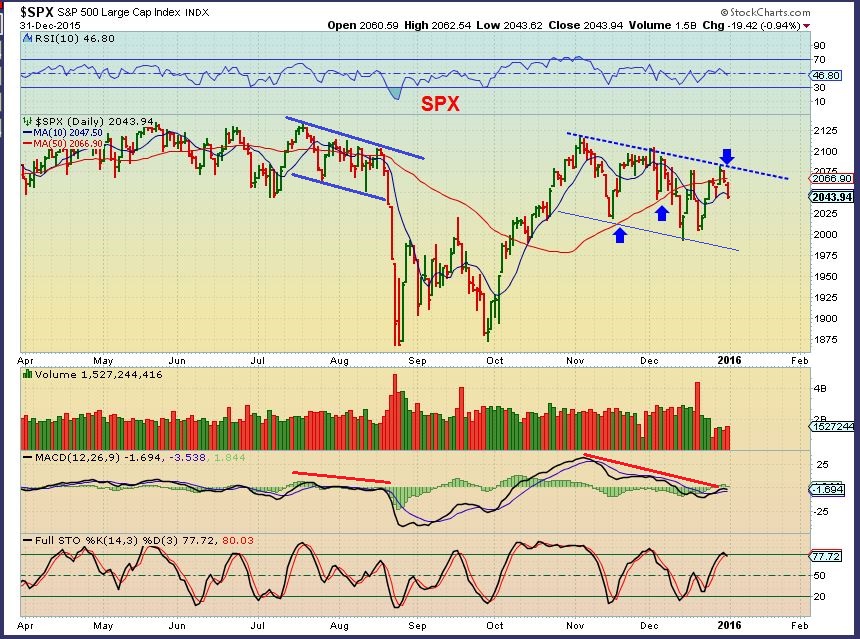
Now lets take a look at potential targets...
Read MoreThough the long term views remain the same here at Chartfreak, the short term views do get a bit hazy at times. For Shorter Term Traders, we look for immediate low risk trade set ups, but some shorter term things are a tad unclear. I will show you what I am thinking is likely, but please remember that in times of uncertainty, cash may nor be NOT a bad thing. Patience may even save funds for future trades. 🙂
SPX - As mentioned yesterday, we could be at support but this remains weak looking and even with a bounce we see overhead resistance that should be noted.
Remember that in the NASDAQ I pointed this out...
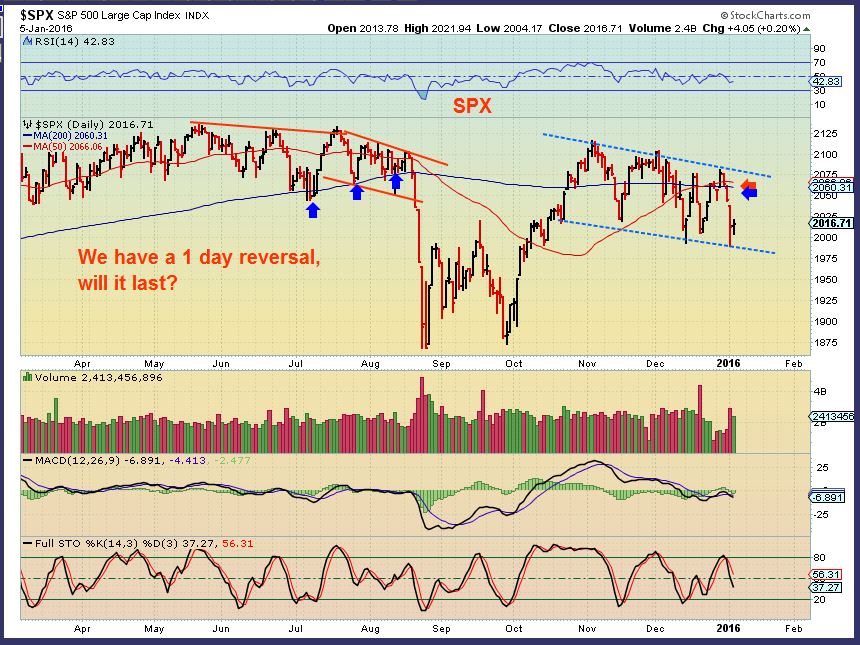
Read MoreDay 1 of 2016 was actually what we have been expecting. The question is , will there be follow through?
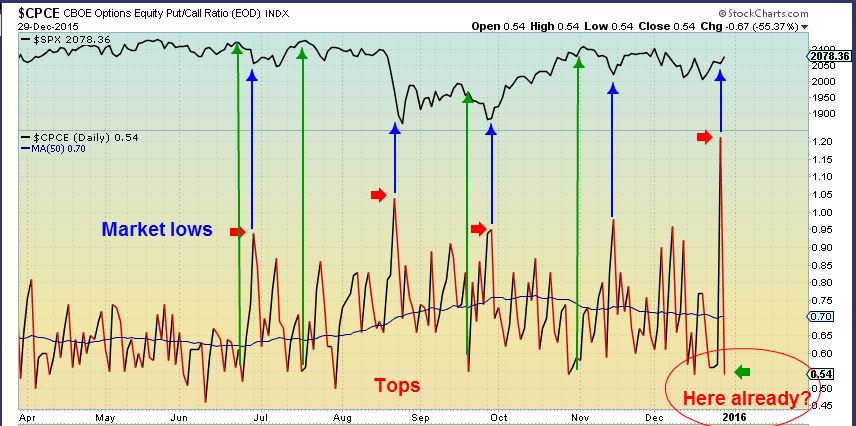
On Dec 30th , I showed this chart to point out that I had expected a drop in the markets. Look how rapidly the CPCE dropped ( bearish). After yesterdays drop in the markets, the CPCE currently reads .80 - so that can be close enough for a bounce, but the CPCE also could move higher as seen on this chart. That means further downside is also possible today. Lets look at more charts...
SPX - Yesterdays drop did rebound a bit near support, so we may bounce, but this can keep selling off.
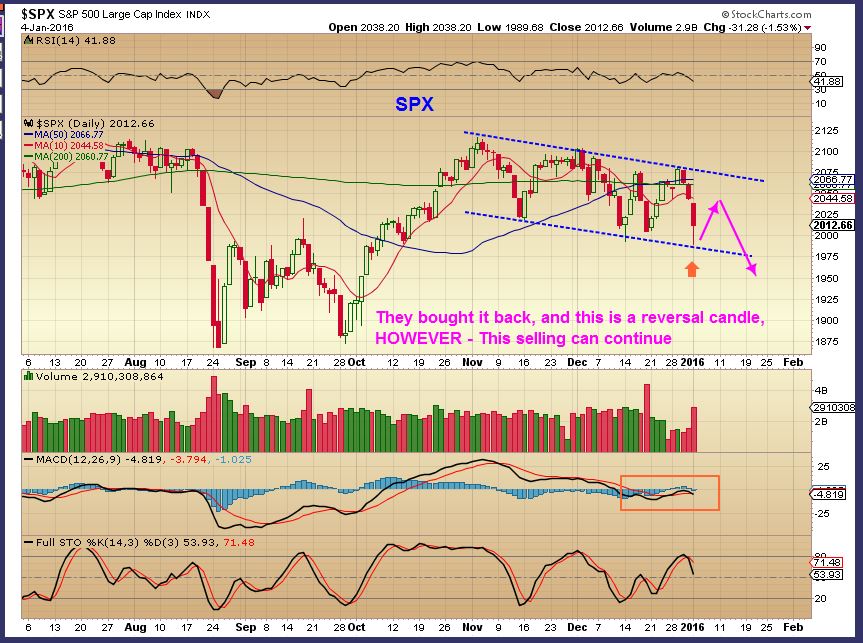
Overall this looks weak...
Read MoreIn recent reports we've been discussing some possible bigger changes in the coming year. Lets review the markets and see if these changes still appear to be setting up as we start a new year.
.
2015 was pretty much a sideways year.
SPX, DJIA, RUT, NYA- Posted a yrly loss in 2015. NASDAQ AND IBB posted small gains.
That alone is not signaling a change necessarily, so lets look at a few more things ...
Read More
Scroll to top