Archive for month: January, 2016
We saw quite a few reversals by the close of trading on Wednesday. Below are excerpts From Tuesday nights premium newsletter.
.
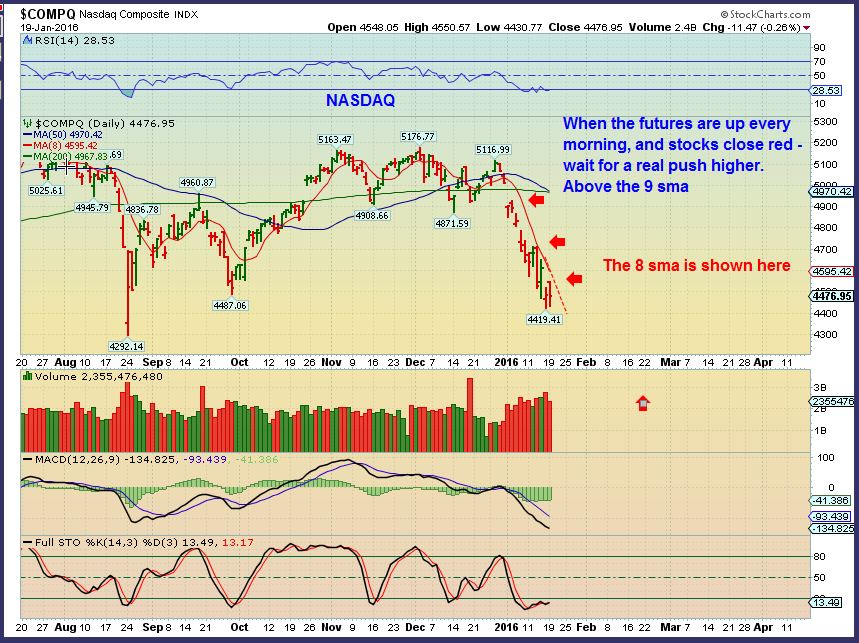
NASDAQ - The futures are up over 100 to 200 points each morning, but the rally fades. What to do? Wait for a reversal and a move above the 9sma to be safe.
Here is the SPX ...
Read MoreYes, Gold has a bullish looking set up, and miners not only sold off, but they broke to new lows. We will discuss that, but first lets take a look at the rest of the markets.
.
NASDAQ - The futures are up over 100 to 200 points each morning, but the rally fades. What to do?
Here is the SPX ...
Read MoreAs expected, we have seen quite the sell off in the general markets. Oil & Commodities have been selling off too. Gold , Silver , And Precious metals are holding up, but are they ready to run now, or will they sell off? I actually spent a part of this weekend digging in to older charts and making some new ones, so lets take a look.
.
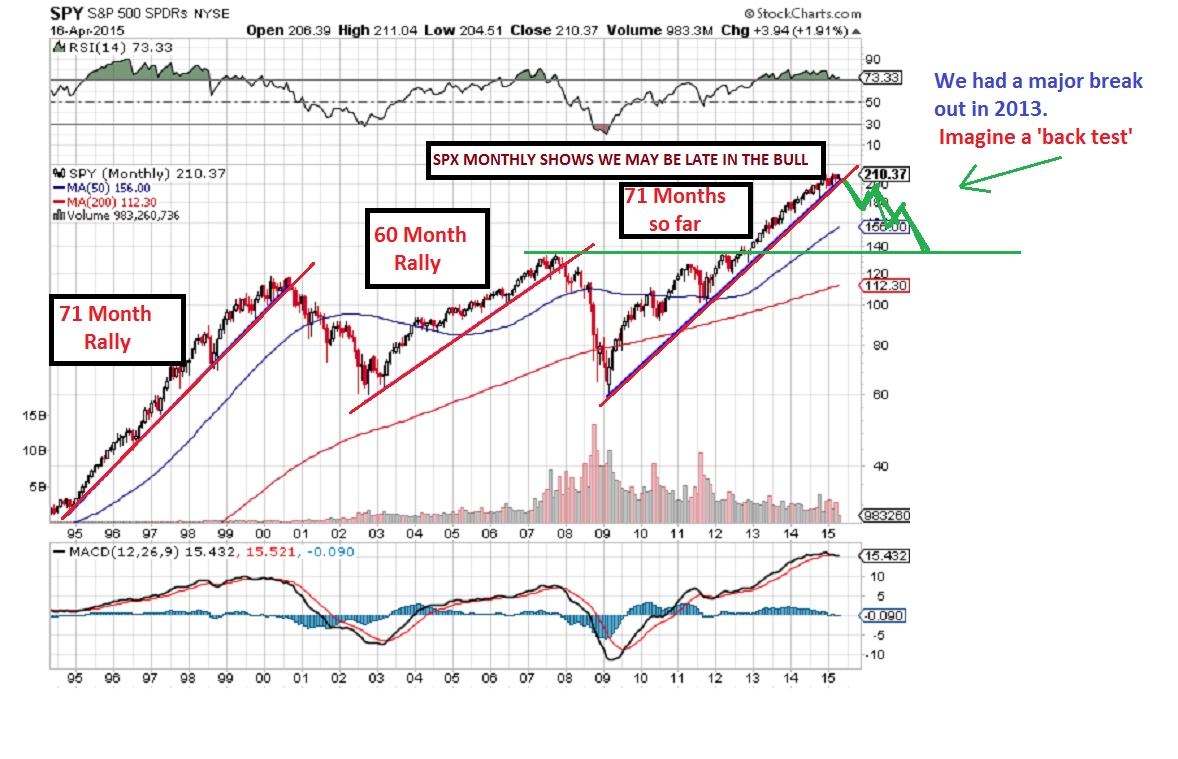
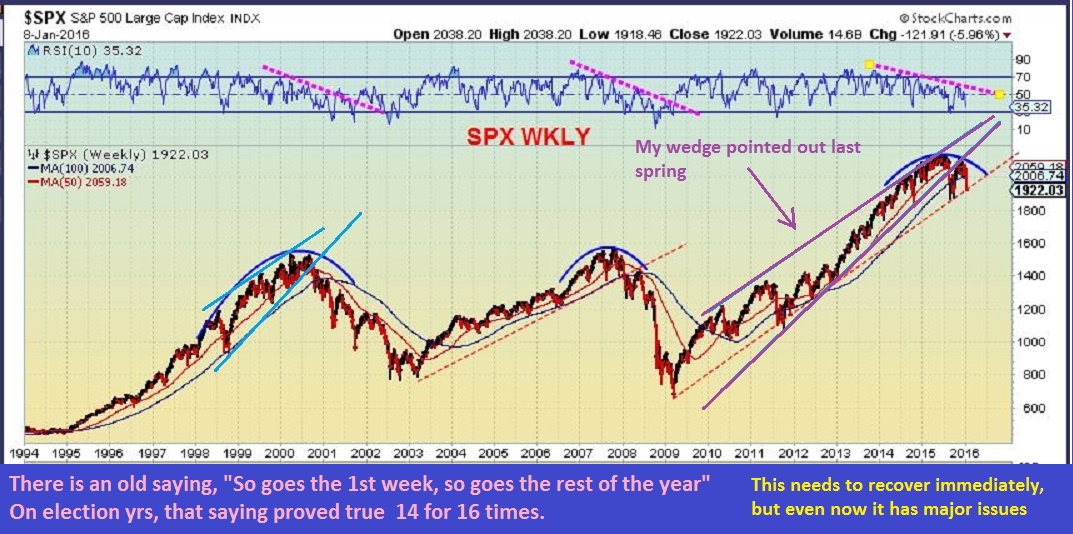
While digging into older charts, I actually found this warning chart that I posted in April of 2015, when I said I thought we were seeing that rising wedge forming. Also by counting the months of the Bull market, we looked to be late in the bull. I am re-posting it because it had a logical target to me at that time.
SPY - We topped in May 1 month later. Now drop to Test the break out?
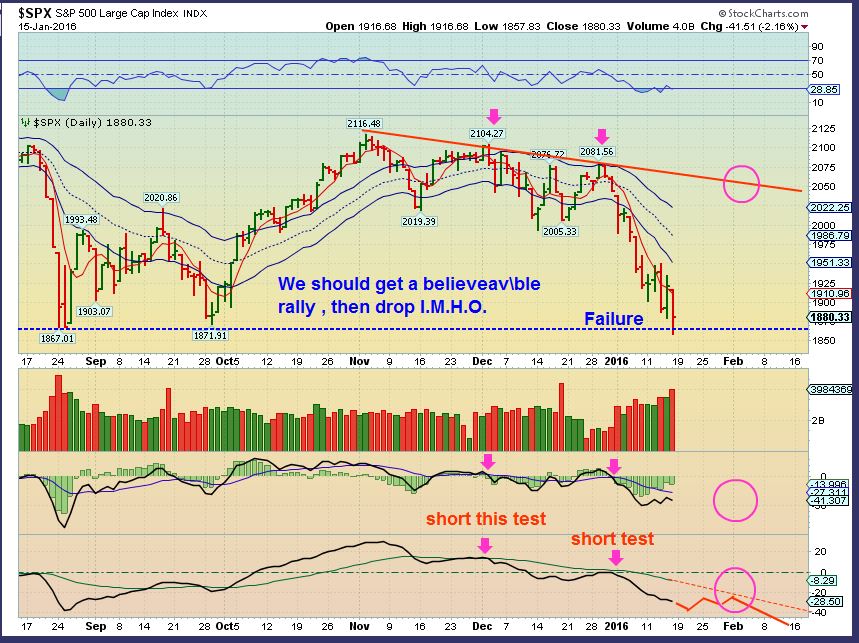
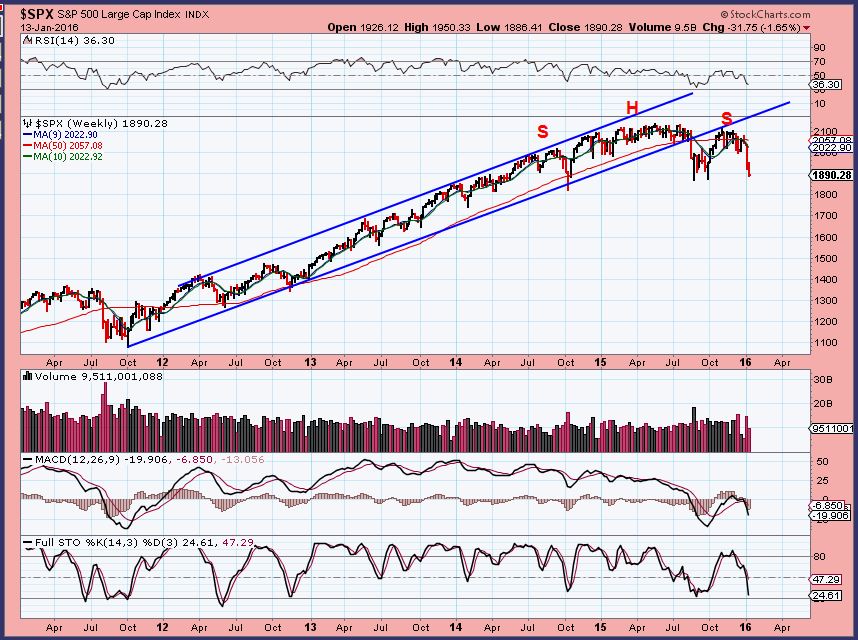
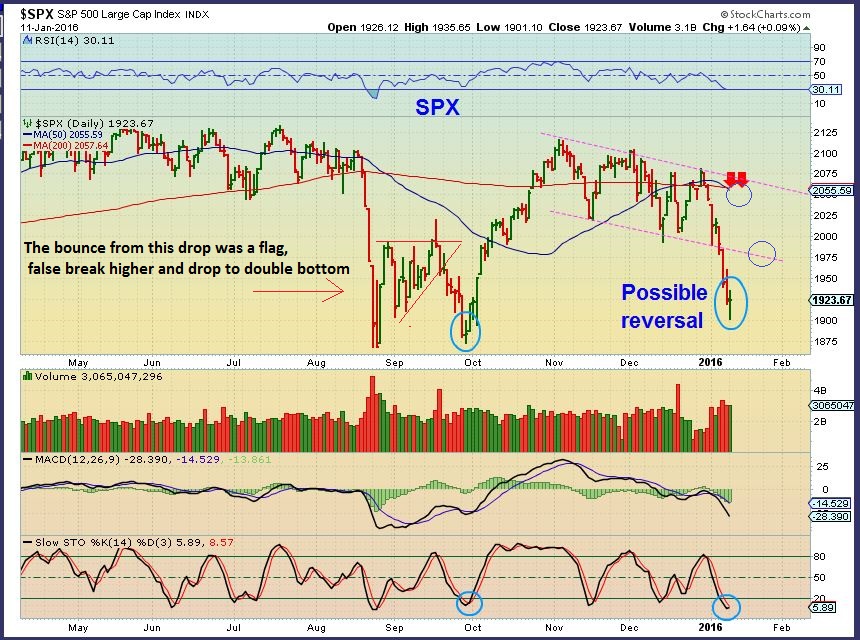
 SPX - We broke the Aug lows Friday and recovered. This is a failure, but we can get a solid bounce soon. Lets discuss a couple of possible scenarios . One is a flash crash right now, the other is a believable rally that rolls over eventually.
 Read More
Yesterday I saw a rather bearish development in Miners, so I immediately began doing research to see if what I was seeing was a major concern. I found something very interesting that happened in the past, and I will share that finding with you here, but first let me review Gold here.
.
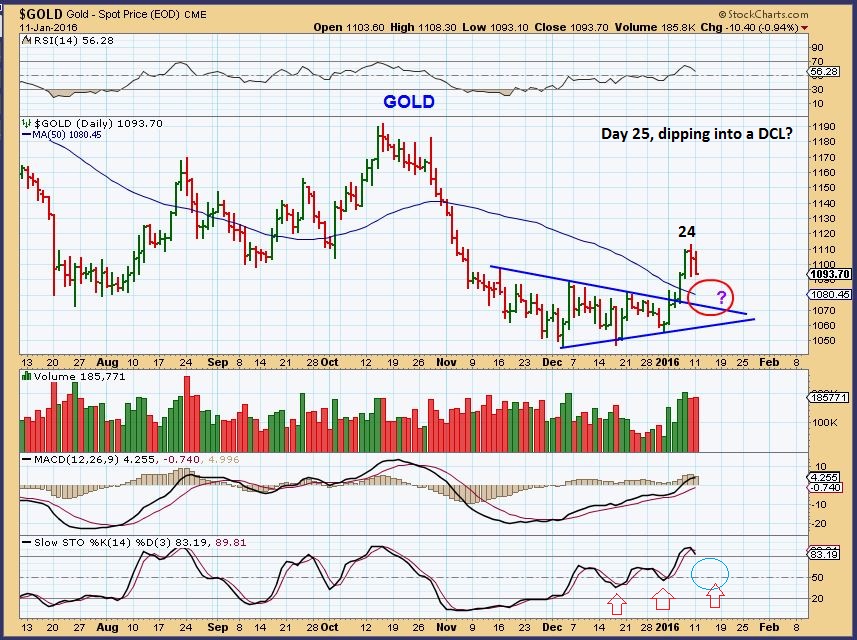
This was Gold in my last couple of reports, and I expected it to drop down and test the break out. As mentioned, Gold had a very bullish set up, and the C.O.T.remains bullish. Here is how it played out. I expected a back test.
.
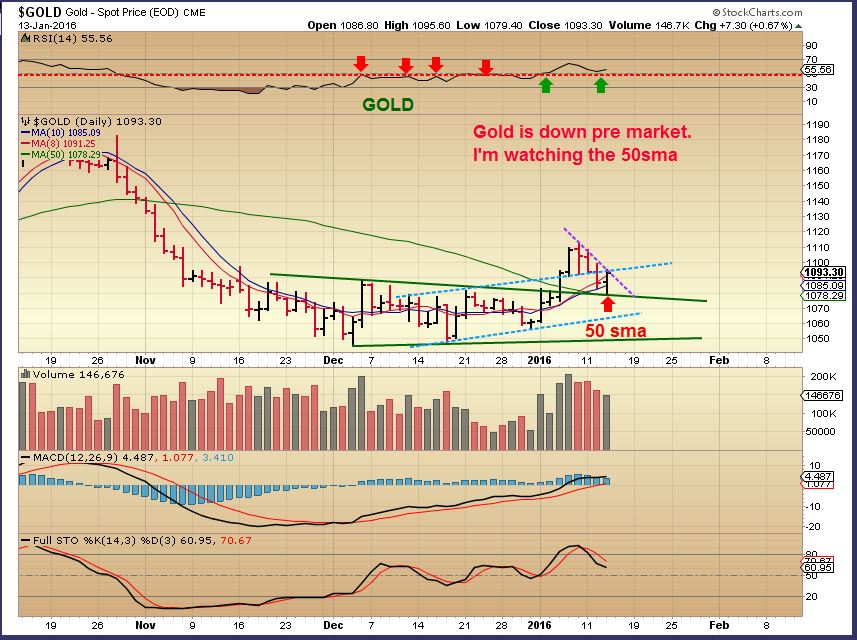
We got the back test, but Miners broke down as gold reversed higher. And with Gold then down pre-market, would this pattern hold up?
This was Gold at the close Thursday. We would like to see this triangle hold up, and so far so good.
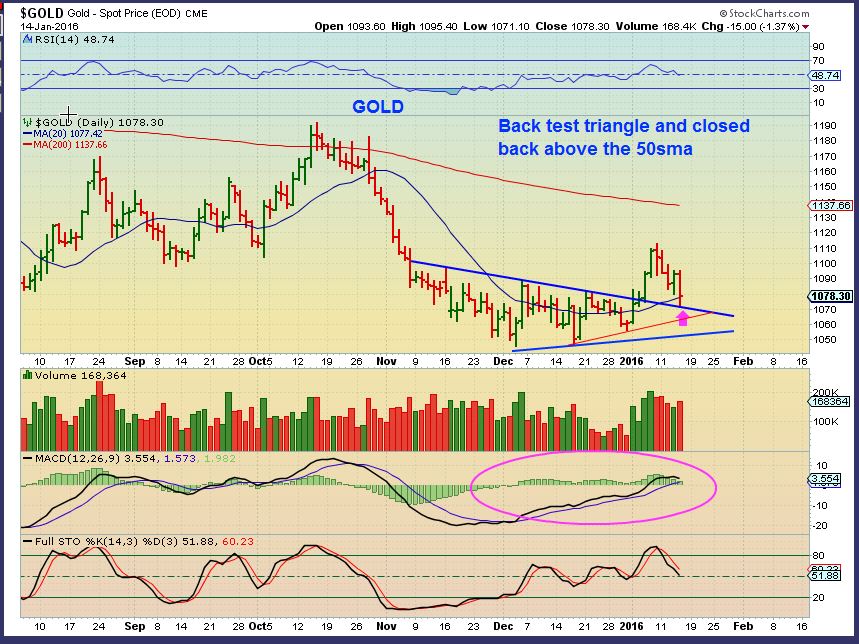
What about the Miners though? What did I see that was concerning, and what did I find that I thought was important to share with you?
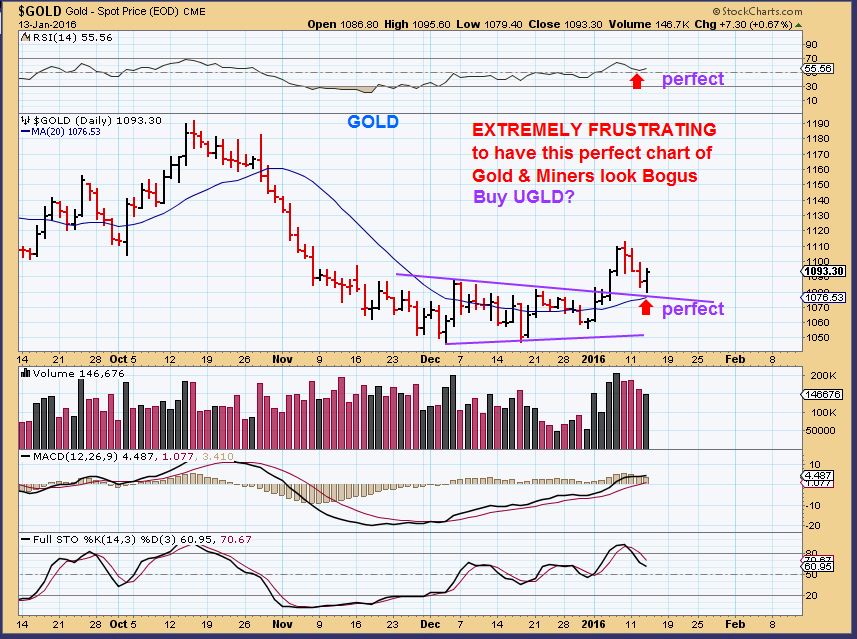
Read MoreIn my last public report, I pointed out that I expected Gold to back test the break out & 50sma area. I posted this chart.
We got a perfect back test as expected and reversal. This chart from Yesterday looks very Bullish, but Miners didnt react strongly.
Now Gold is dropping pre-market. What am I looking at today when it comes to Gold?
Read MoreI had this chart in my weekend report. After this weeks selling, it looks more and more like a reality, and not an illusion.

SPX CURRENTLY - I expected a bigger bounce this week, but the 2 day bounce was sold off yesterday. This is a break down and a back test.
 Read More
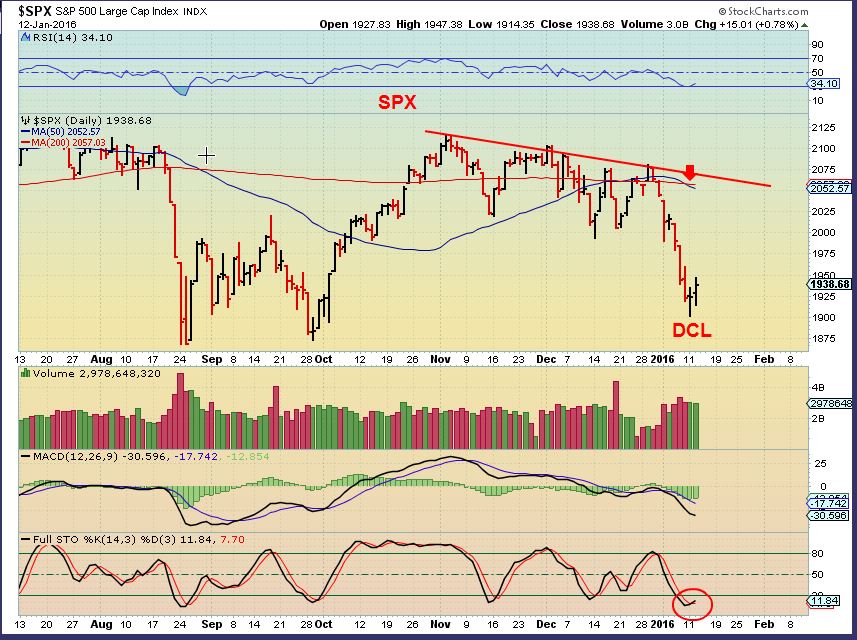
SPX - Yesterday I was pointing out the reversal candle and we were expecting a move higher, but would it be just a bounce?
SPX - We will get follow through, so traders can trade it, but at this point I do not expect a return to the Bull run. (See the weekend report for the big picture). Strong overhead resistance is pointed out, if the markets can make it to that area.
 Read More
We know that sooner or later the markets will bounce, but what should we expect? A recovery or just a bounce? Lets check out the charts...
.
SPX- There are points of resistance to be watched along the way. Look at the Aug - Sept 'bounce'. That first month was rather lack luster, but the surge in October was brisk. With a reversal on Monday, we may get out move higher immediately.
Read More Most people realize that you can't solve a puzzle by forcing together pieces that dont fit. As time goes by, however, various pieces do come together, and the big picture becomes clearer. That may be happening now, so lets look at some of the pieces of this big picture puzzle.
SPX WKLY- I had pointed out a bearish rising wedge forming in the SPX since last spring & last summer. After a break down this summer and back test, we had further selling as 2016 began. Is it done?
.
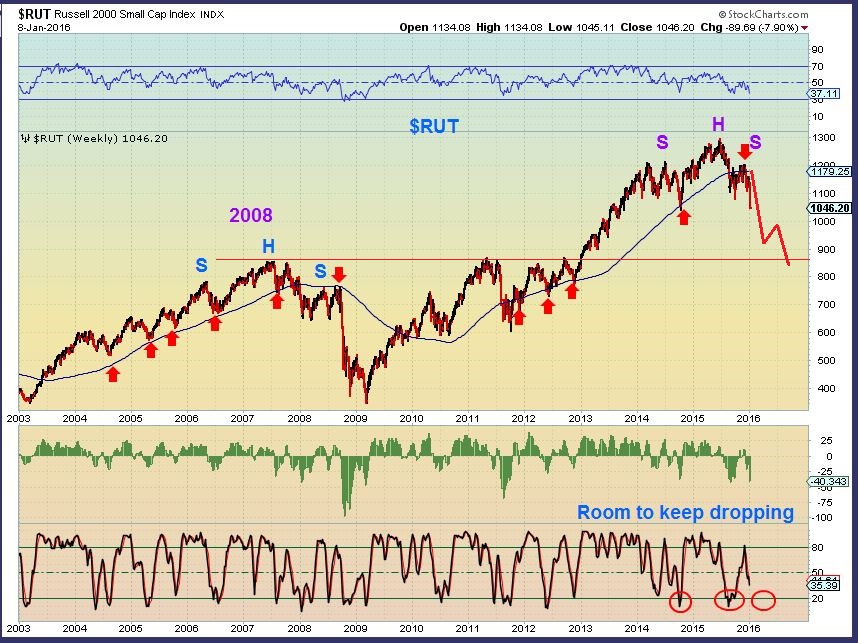
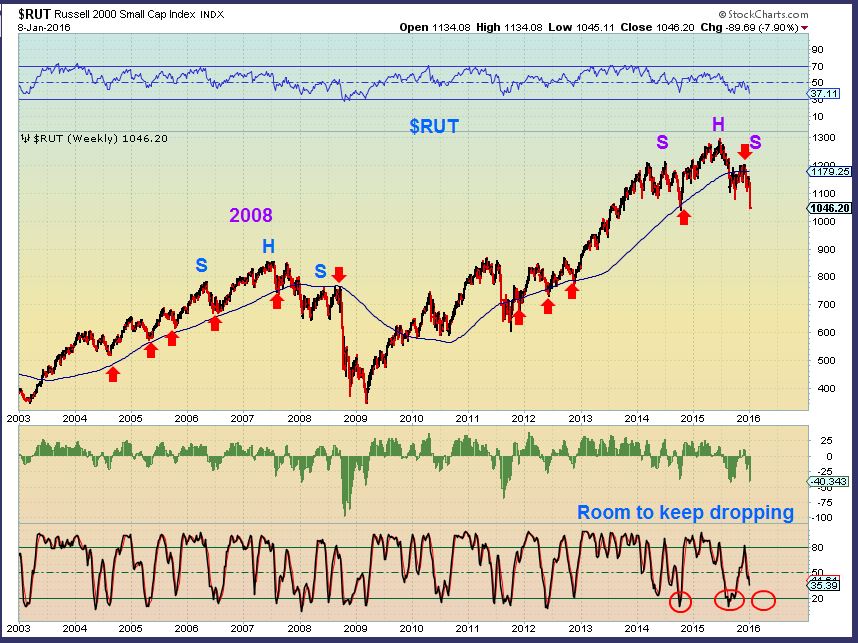
$RUT - The TRAN and RUT look to be starting lower highs and lower lows. We could get a bounce soon, but you can see that with further selling this could easily drop to the 800 area.
Might a falling market help Miners, or do they all fall together?
Read MoreAs time goes by, it certainly seems like the pieces of the puzzle are coming together to reveal the Big Picture that I have been discussing for months. 2016 could be a great year for some, painful for others if this continues. Lets review.
SPX WKLY
.
RUT - NOT VERY ENCOURAGING IF WE DONT GET MORE THAN A BOUNCE SOON
 Read More
Scroll to top