Archive for month: November, 2015
This was possibly going to be a slow week of holiday trading, with Thursdays markets closed in the U.S. and 1/2 day Friday. In some areas we actually saw some noteworthy changes. Lets take a look at our weeks activities.
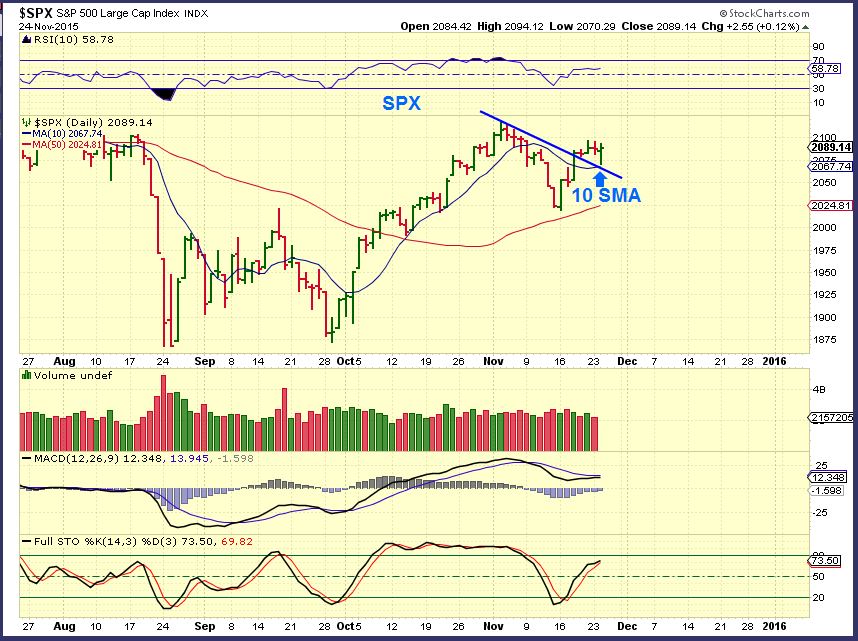
SPX - No change from what we expected, but we should see a push higher soon.
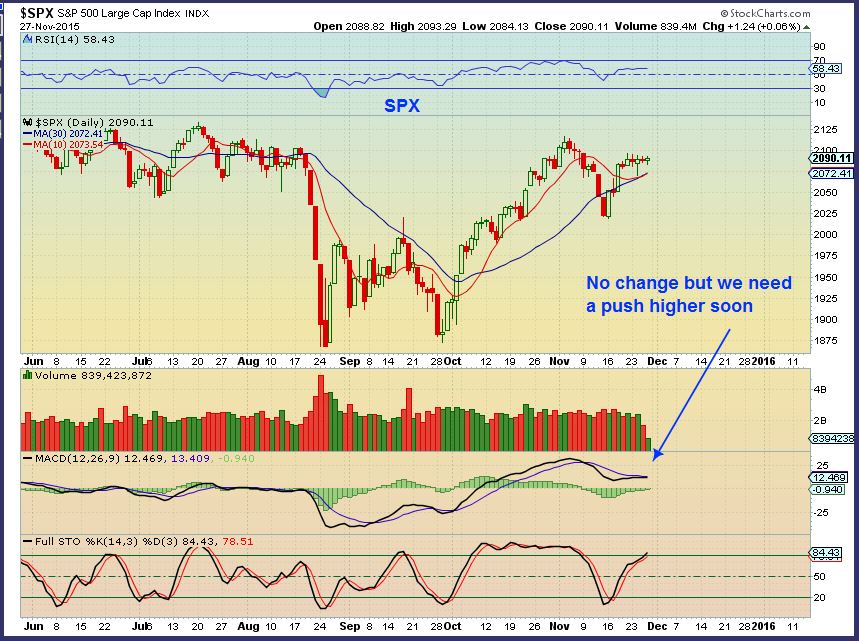
This is encouraging ...
Read More This is a holiday week in the U.S., so I would expect that the markets may begin to slow down as the holiday approaches. Lets review what took place Monday. There actually were a couple of noteworthy occurrences since the weekend report.
Read MoreWith the release of the Fed Minutes Wednesday, we got a good amount of action in the markets this week. Lets review sector by sector.
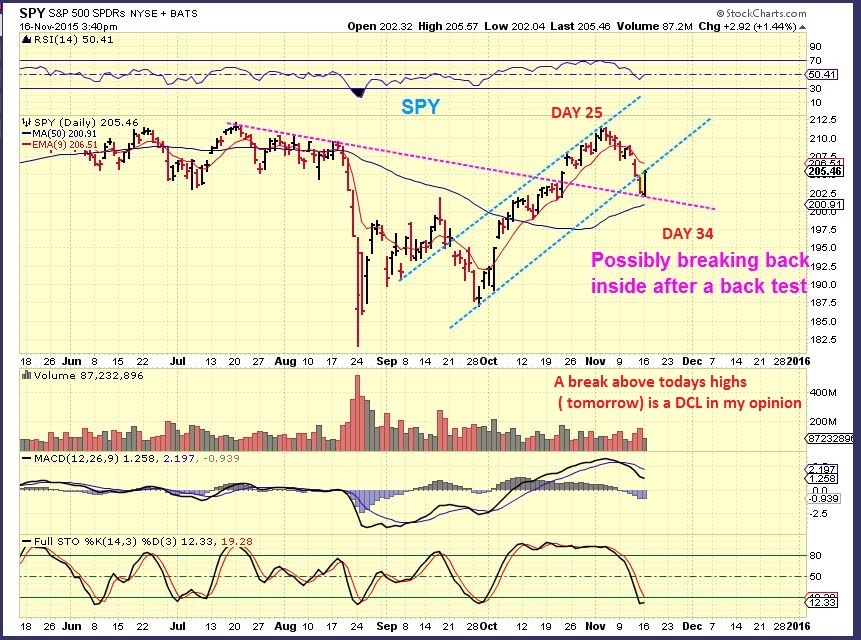
The SPY - On Nov 16, with a day 25 high in place, I expected a bullish break higher and a DCL to be put in place.
SPX Nov 18 - This was a bullish break out back above the 200sma.
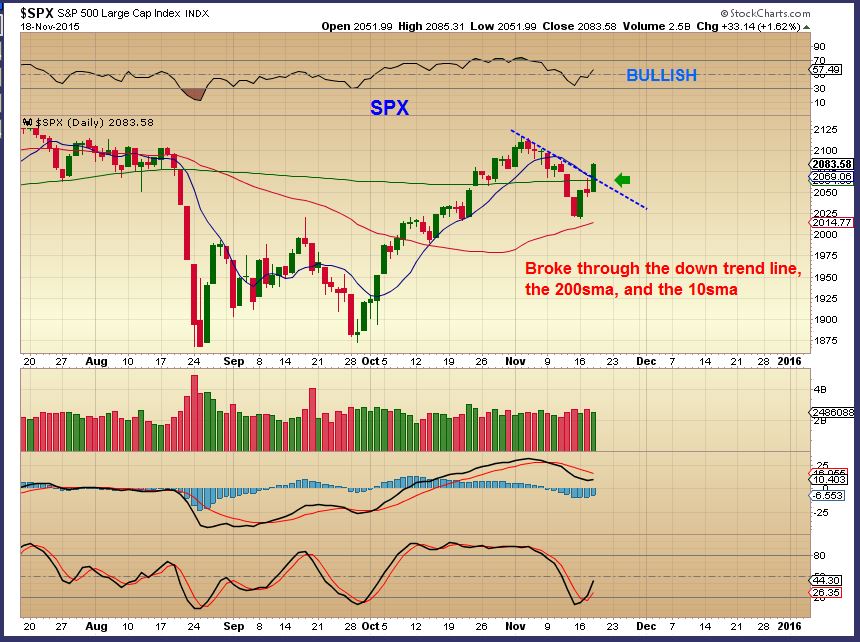
That was follow through after the release of the fed minutes. What can we expect?
Read MoreFriday November 20, 2015
Read MoreWe saw GOLD break to new yearly lows Tuesday and I read in several different places that people were going short for the drop below $1000 (Again). From what I was seeing, it was not time to be going short. I discussed that in my Tuesday night report and will post some of that discussion here in the public report.
GOLD SILVER & MINERS
This is the big story. With Yesterdays break down in Gold ( breaking the July lows and breaking to new yearly lows), many have gone short expecting their crash to $1000 to finally come in capitulation fashion. I believe that this will not crescendo into a crash mode at this point, so I would not recommend going short here.
.
2 possible ideas on my mind – we should quickly review both since we cannot tell at this point which one will occur.
I have mentioned both of these ideas already in recent reports, this is a review.
.
1. Gold will either find a dcl (Daily cycle low) soon and bounce. If we get a 4th daily cycle, that bounce will roll over, followed by another dip lower into final and much deeper lows
or
2. We will put in that deep trade-able low (ICL) and rapidly move higher from here very soon.
.
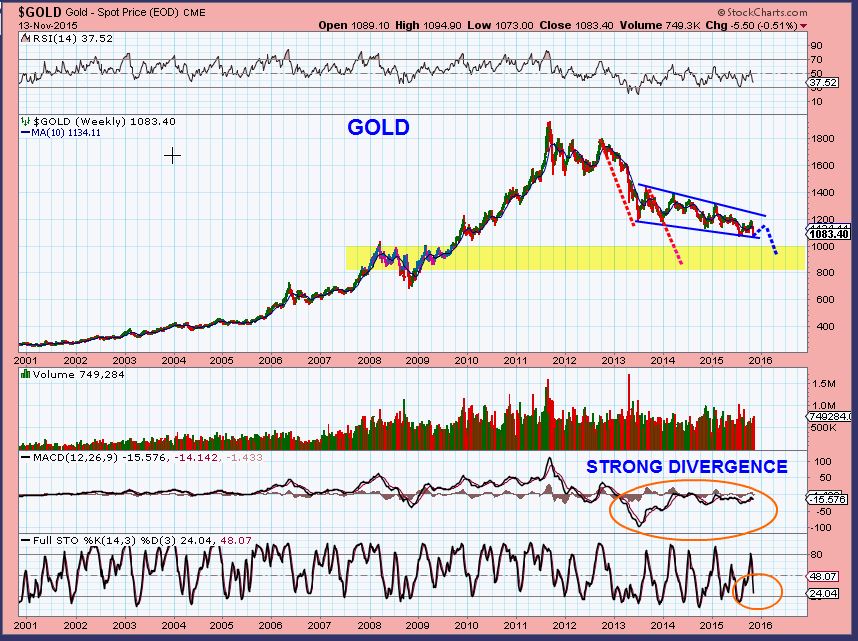
( 1. From above ) Timing-wise I wouldn’t be shorting because a daily cycle low in GOLD & MINERS is due. IF we only get that 4th daily cycle… That would produce a “Bounce” and my chart from the weekend report would play out like this. You could then short that bounce.
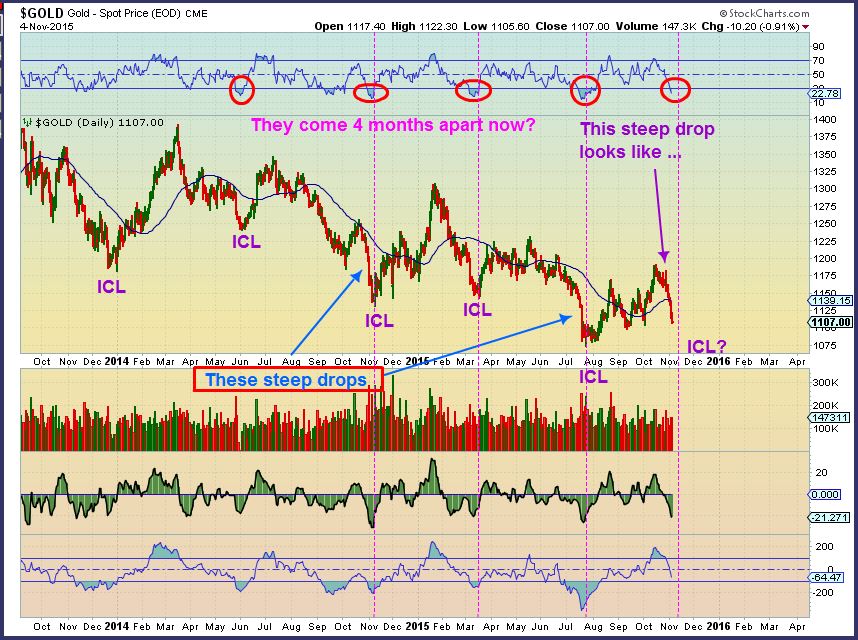
( 2. From above ) I drew this in my Nov 4th report. An ICL in mid November would match what we have seen recently. ICL’s have been arriving faster at 4 month intervals in very steep drops. You can see that we are now at the time that I pointed out as a time to watch for signs of a low.
Yesterday GOLD broke to new fresh lows. You can see that we are in the timing that a low is due to be put in place at day 32. It could be that ICL and we could then move higher for weeks. Now that many are shorting and the COT has been improving, this could be the case ( Wednesday afternoon is the release of Fed Minutes). We wont really know until the move starts unfolding. A 4th daily cycle would become weak and roll over as left translated by day 5-8 most likely.

GOLD CURRENTLY – We saw GOLD undercut last night and reverse higher. That could be the “test of the lows”. Lets see if it holds.
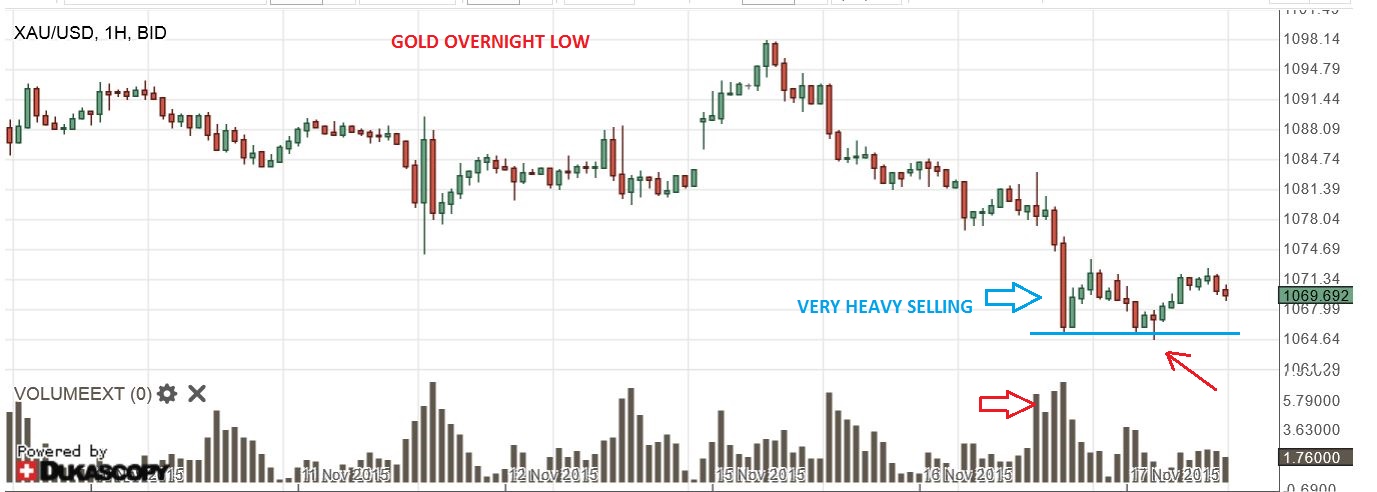
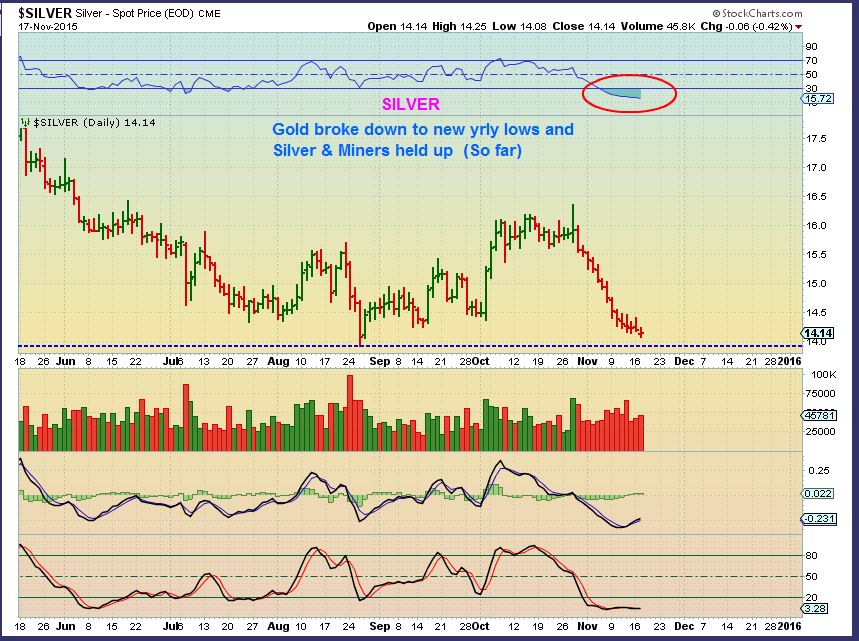
As GOLD broke down to new yrly lows, it is good to note that both SILVER & THE MINERS did NOT break to new lows (yet) . Silver & Miners usually lead moves down and up. Is this a sign of strength in the lead sectors, or will they play catch up in a final drop? We’ll know after we bounce.
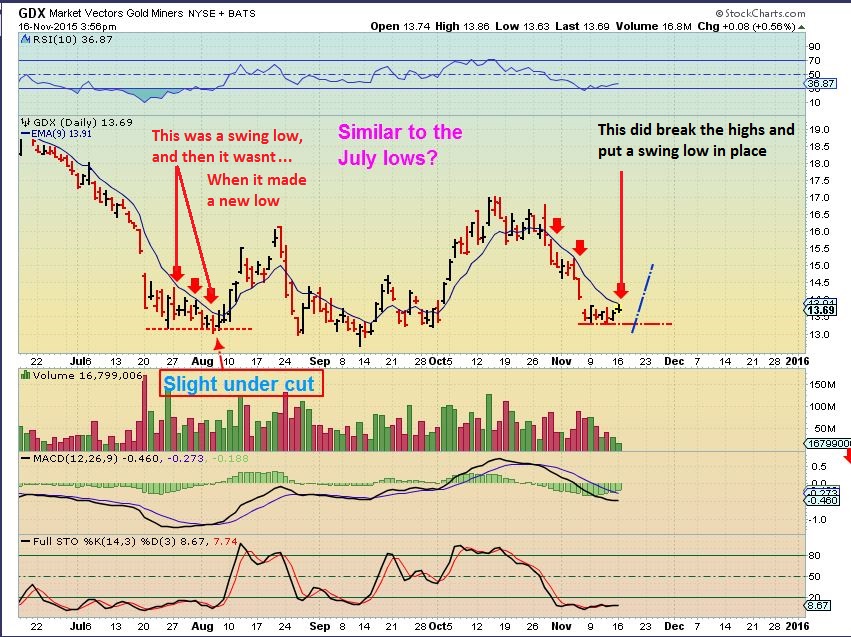
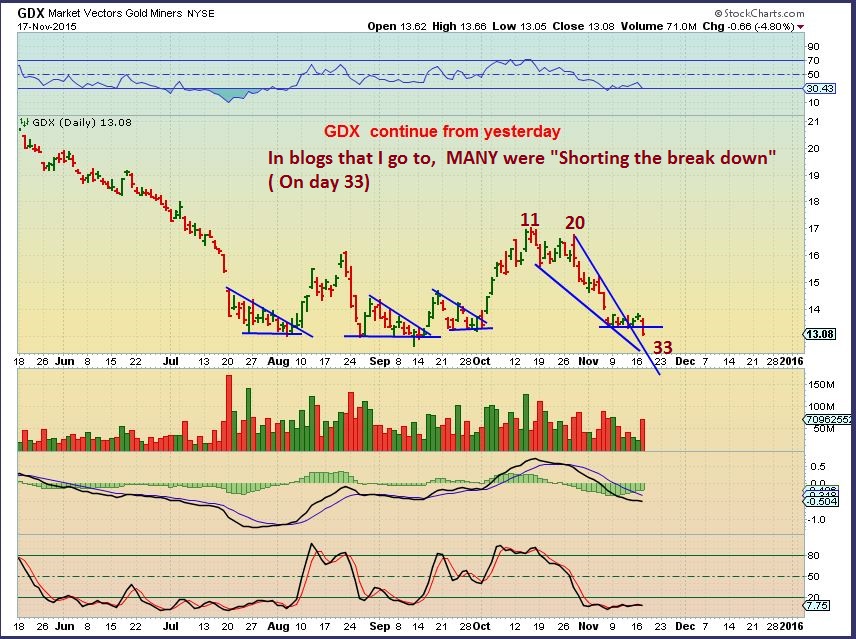
On the Nov 16 chart of GDX , I mentioned how we had a swing low in place in July, and then it got undercut (Shake out). I pointed that out so that if it happens again, we have expected that possibility and it doesn’t surprise us . We did undercut lows yesterday too. Lets review.
The chart from the Monday night report – read what was written on the left side about that low being undercut. Price was rejected at the 9 EMA Nov 16.
Another chart of GDX showed these wedges. I wrote in my report that these can drop and test the break out too.
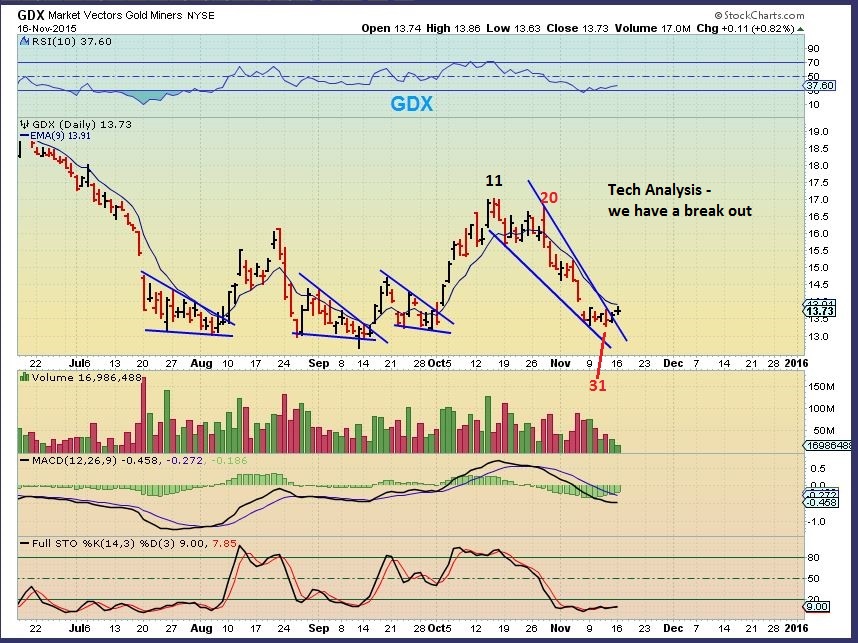
GDX yesterday – GDX can drop further, but on day 33 I personally would not be shorting Miners now. They are due to move higher.
In conclusion – You may want to try to catch the lows for a trade , but remember that if this is a 4th daily cycle, it will roll over soon ( And DUST may be the trade at that point).
What would GDX look like if it just bounces and rolls over? Does it fit the big picture view? Yes. A bounce & Tag would lead to the Dec Fed Mtg.
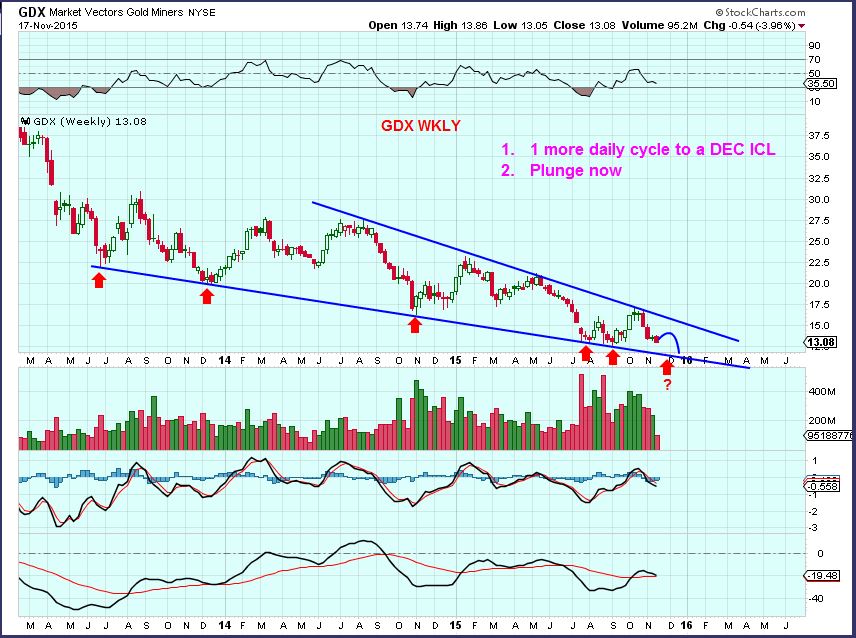
Today the FED minutes are to be released. On that Fed Wednesday Gold reversed lower quickly and started its sell off. We had volatility. Wouldn’t it seem odd that the release of the minutes would now cause a reversal and a run higher? We are due for a low though, and odd things do happen in these markets.
So at this point I am advising patience to see what happens after the Fed Minutes are released. Some traders will buy the reversal with a stop below the lows. For conservative traders, even with an ICL you do not need to catch the lows the minute that they happen. I will discuss other options in the Thursday report. Experienced traders can use the above report and the weekend report as a guide of possibilities to enhance their own trading style. As you can see from this report, there are still a number of possibilities that lie immediately ahead. Best wishes!
~ALEX
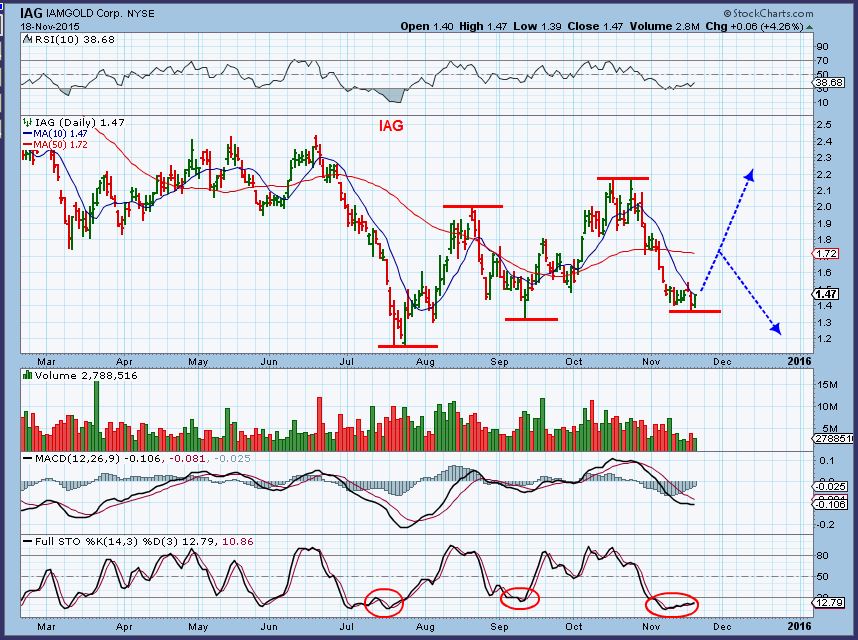
EDIT: We are currently experiencing the move higher in Gold & Miners that I was expecting. The above report is only part of the daily report for Fed Wednesday. I also covered the SPX, USD, WTIC, XLE, NATGAS, etc. A second set of eyes is often helpful in understanding the markets. If you think this type of analysis can improve your view of the markets, help you trade better, etc., I invite you to sign up for the premium reports. For only $37.95/ month you get 4 or 5 reports per week. When lower risk trade opportunities present themselves, I do point out ideas such as the below chart that was in this mornings report. The 2 arrows point out the idea of a possible bounce into a 4th daily cycle or a nice run similar to the one out of the summer lows ( With an ICL in place). Thanks for being here and best wishes in your trading!
The picture started getting clearer in many sectors of the market after the Fed Minutes were released Wednesday afternoon. Lets take a look.
SPX / SPY - Looking for an overhead follow through and within the timing for a DCL. The 200sma acted as resistance.
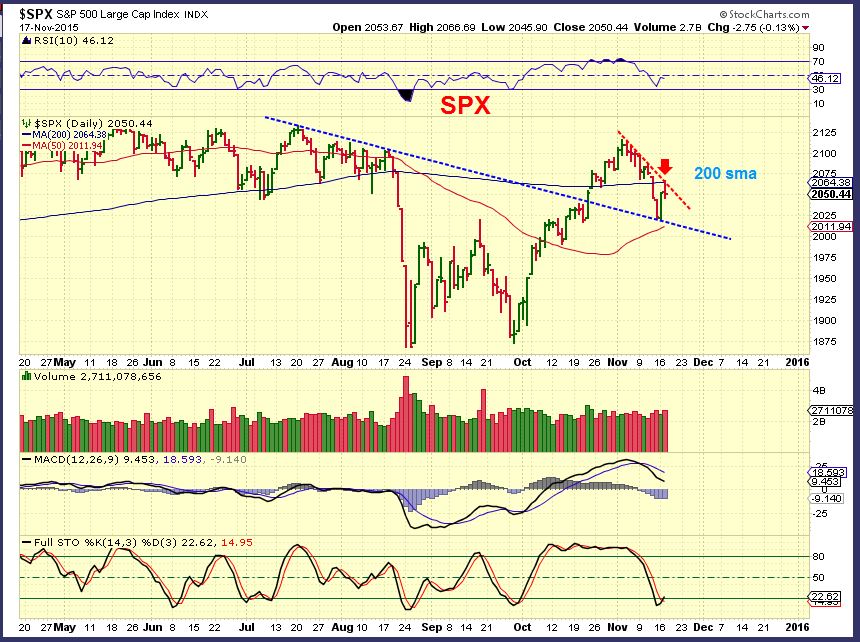
Bullish Break through, I expect higher prices and will watch how the follow through plays out.
 Read More
We saw GOLD break to new yearly lows yesterday and I read in several different places that people were going short for the drop to below $1000 (Again). We will discuss why I do not agree that this is the time to be going short. NATGAS remains interesting and OIL and Energy Stocks continue to have my attention too, so First lets look at a few other charts.
SPX - The markets stalled at the 200sma and a down trend line that I mentioned earlier. We could drop to the 50sma, but timing wise, we are due to go higher soon.This may be a pause before breaking above that 200sma.

The USD has been strong , but it may be due for a rest. Yesterday was a short term topping or reversal candle, but it is not a strongly reliable one. If the dollar is due for a rest, what might that do for the commodities that are now being heavily shorted?
Read MoreI wanted to do a quick update on the Oil and Energy sector that was included in todays premium report. It is interesting that as we see Oil selling off toward the Aug lows and currently forming Lower Highs and lower Lows, many Energy stocks seem to be more or less holding up and basing out . Lets take a look.
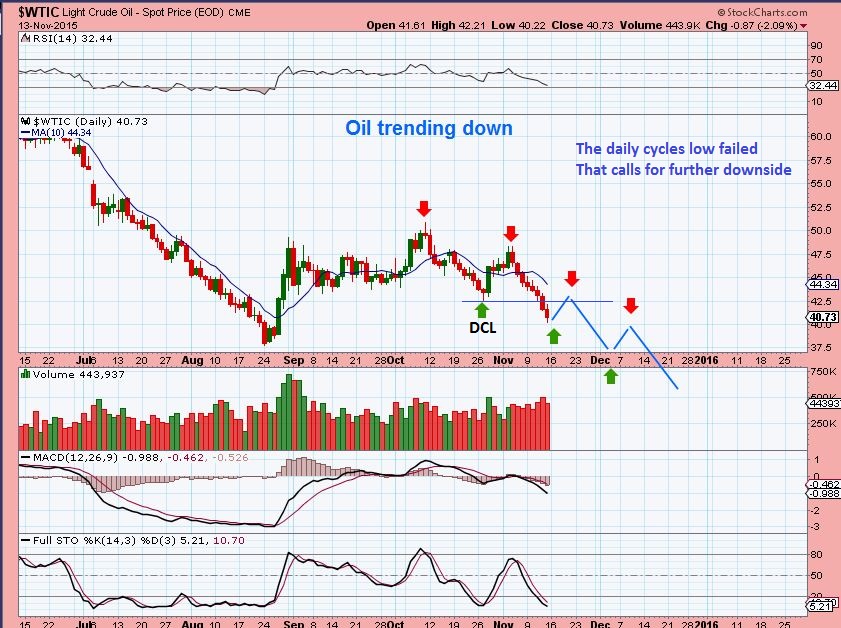
WTIC – Oil has been selling off, but it put in a reversal Monday. Will it hold? There were reports of “Oil trucks and Oil targets being bombed by France ” in response to the terrorist attack on Friday. This would be to target ISIS money ( Think “kill their oil supply”) . Wouldn’t that be Bullish for OIL? Possibly, but please be reminded that OIL is currently making lower Highs and Lower lows. Watch the Magenta line in the chart below for possible resistance when oil bounces.

From my weekend report: Notice that a longer term A-B-C-D Type move could target Oil in the high $20’s ( $26.09).
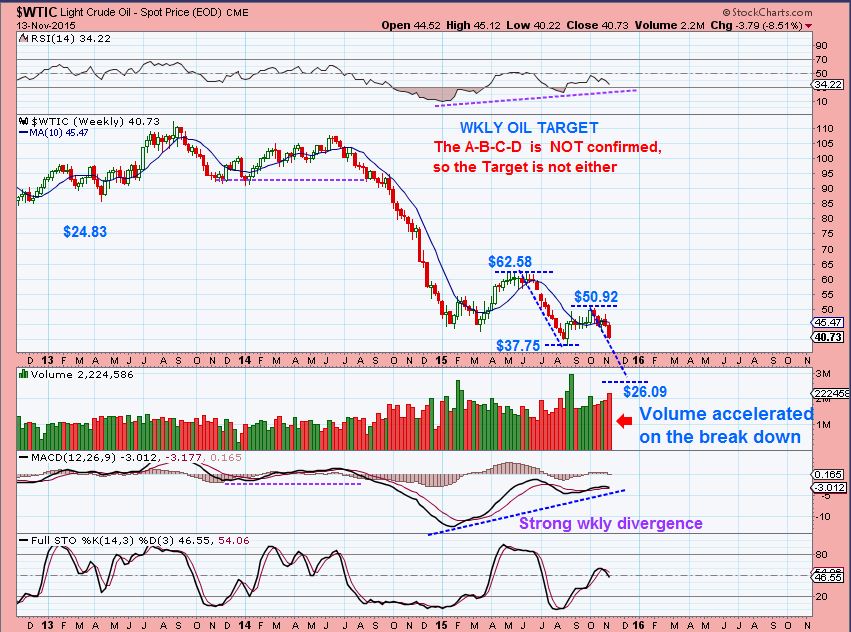
So Oils drop could stagger along something like this, with bounces along the way.
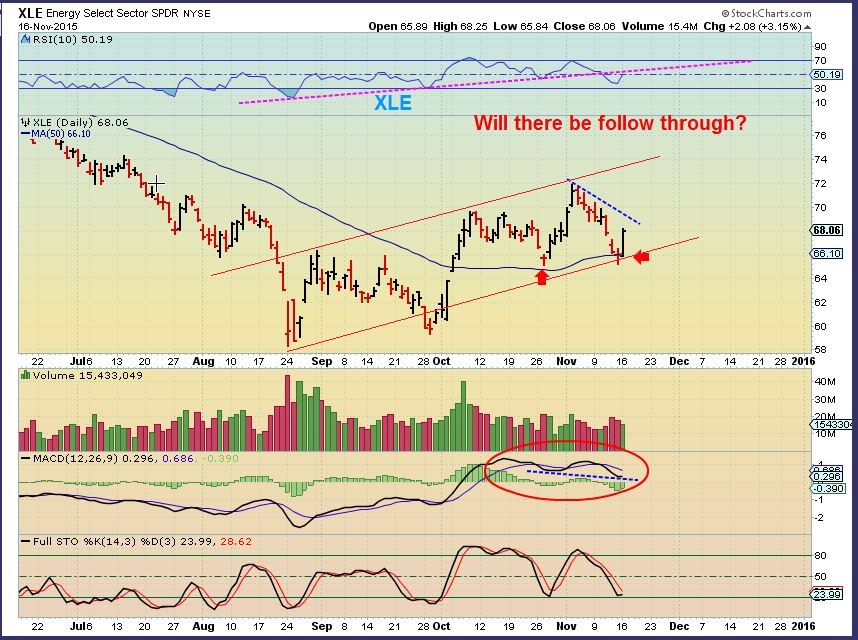
So with OIL down near August lows again, shouldn’t we would expect Energy stocks to be hurting too?
XLE – Notice that the XLE is not near the August lows like Oil. It didn’t look like it would stay above the 50sma with Oils sell off, but on Monday we saw a nice reversal at the 50sma.
I admit that it is a bit confusing seeing quite a few Energy stocks bottoming, basing out, and even looking bullish while Oil sells off. Maybe Energy stocks are sniffing out a coming bounce in oil.
So caution is still warranted with Oil making Lower Highs and Lower Lows , but some Energy stocks are looking interesting for the short term traders.
I repeat: Please see my OIL chart above again and the MAGENTA line . Then you can also take a look at some Energy charts like WG, ECA, ERF, CJES, BBG, BTE, SGY, CVI, LGCY, EXXI, ETC. Those charts and many more look quite trade-able shorter term. Buy support and sell resistance is one approach. Lets look at a few charts mentioned above …
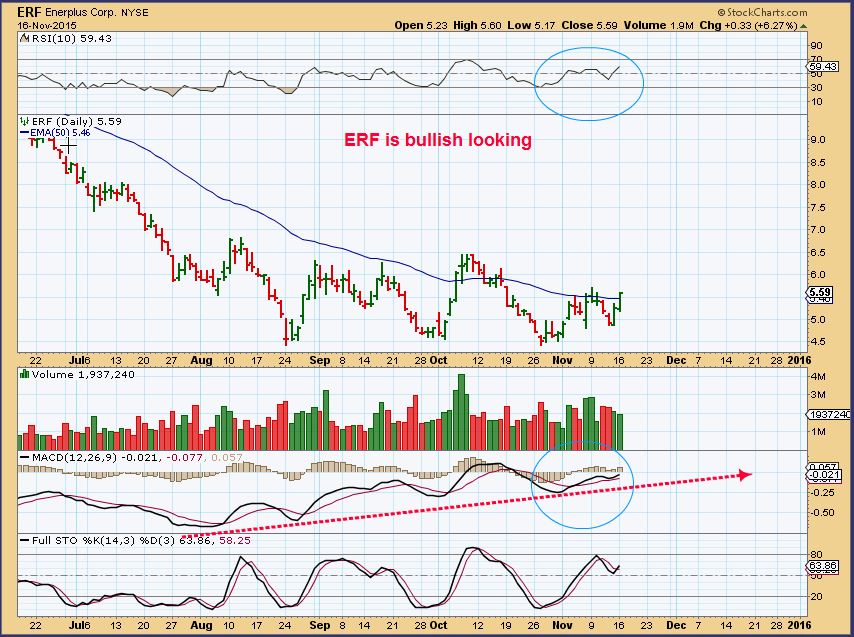
ERF – ERF moved higher Friday with OIL down and continued above the 50sma Monday.
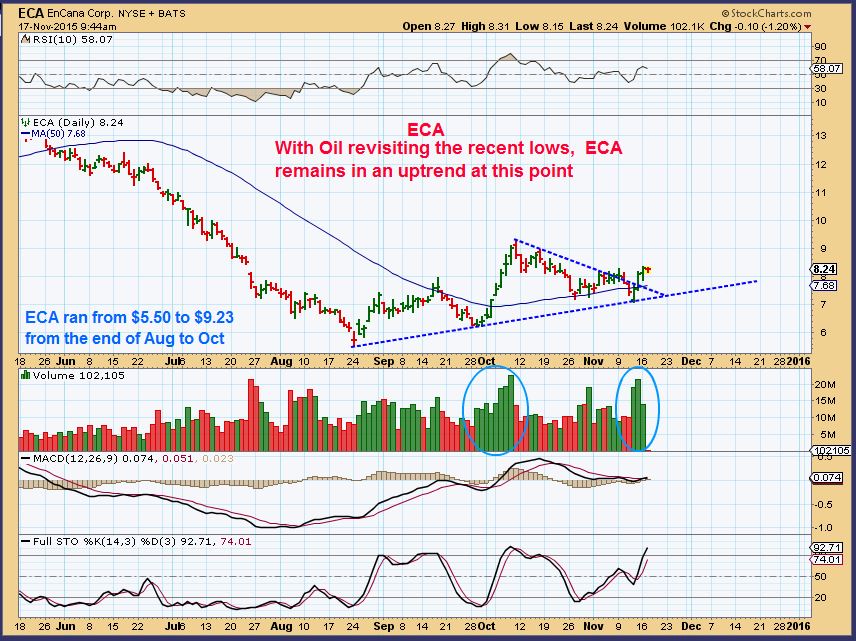
ECA – Almost ran up almost 100% from Aug to October, it continues to make higher lows here.
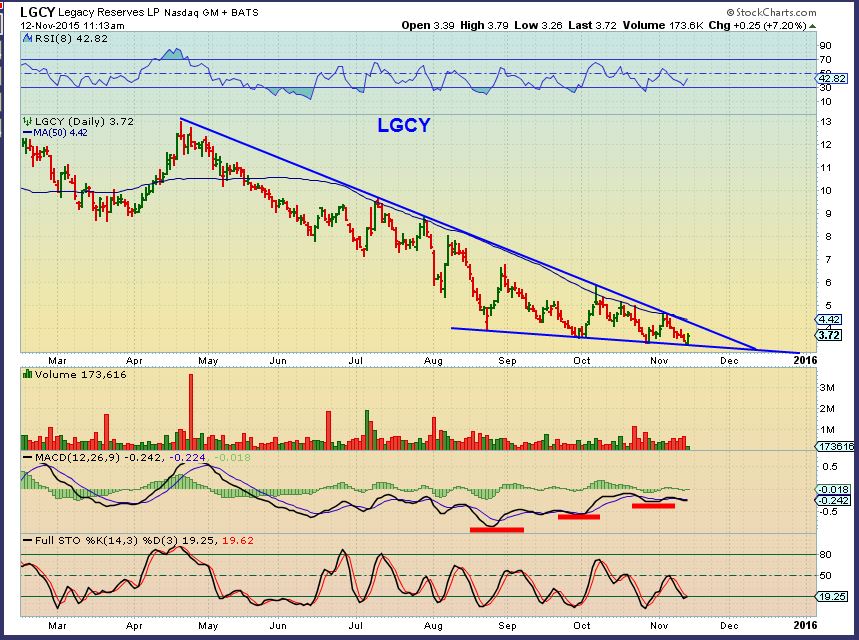
This was my longer term possibility for LGCY. It too is making lower lows, but it may be forming a bullish descending wedge longer term. It has reliable support and resistance at this point. One could monitor it going forward for a possible break out.
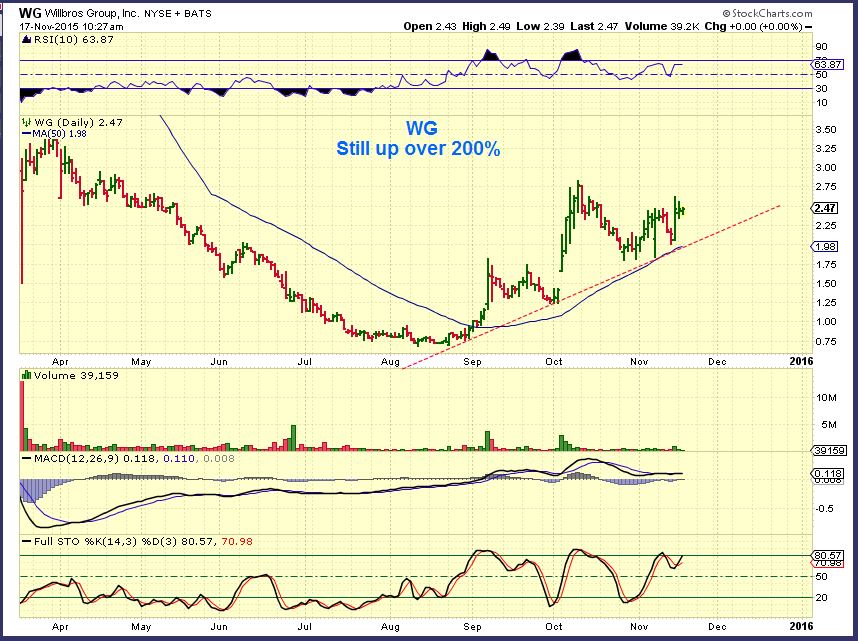
WG – After deeply selling off this spring, WG & CRK ran up over 200% from the lows. They have been consolidating gains instead of giving them all back.
So with Oil near the AUGUST lows, we see many Energy stocks and the XLE pulling back a little less. They are trade able for the nimble trader in front of his/her screen fairly regularly . If Oil recovers in the future, many of these stocks may be basing and should benefit with very strong gains over time. On the other hand, what if Oil does fulfill that A-B-C move to $26 ? Energy stocks may begin to experience additional losses, so always use stops and monitor those positions often. Along with regular market commentary, in the premium reports we have been monitoring this possible basing action in Energy and also in the Precious Metals sector. I am anticipating some meaningful lows in the coming months ( Or possibly last July for Gold? ). A monthly subscription is only $37.95 / month. If you enjoy following the type of analysis that you see here in the public section of Chartfreak, Why not join us and give us a try? I write 4 – 5 reports a week. Thanks for being here!
~ALEX
The Markets always have that Ebb and Flow action where they pull back and push forward. We have been in the timing for some change as mentioned in the weekend report, and today we did get those winds of change blowing through. lets take a look...
In the weekend report the SPX chart pointed out possible turning points, seen here.
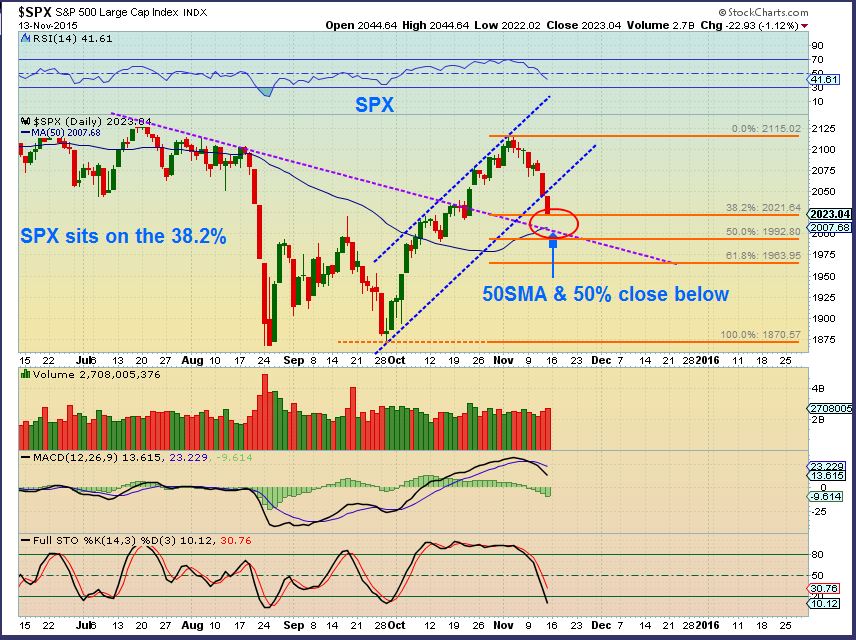
Here I am pointing out the action in the SPY, the day ended with 117 million. We are in the timing for a DCL (Daily Cycle Low, so I do believe that today was a DCL. If this pop drops ( to the 50sma?), I think support will hold. This is a buy with a stop below the 50 sma.
 Read More
Scroll to top


