Archive for month: November, 2015
This week various sectors actually made some moves that could affect the short and longer term outlook. Lets dig right in and review what has happened.
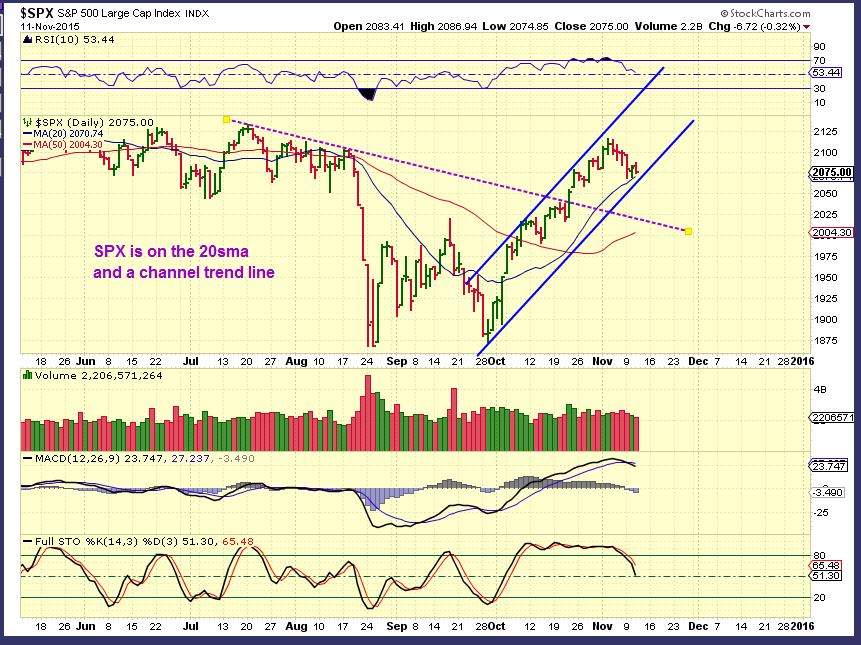
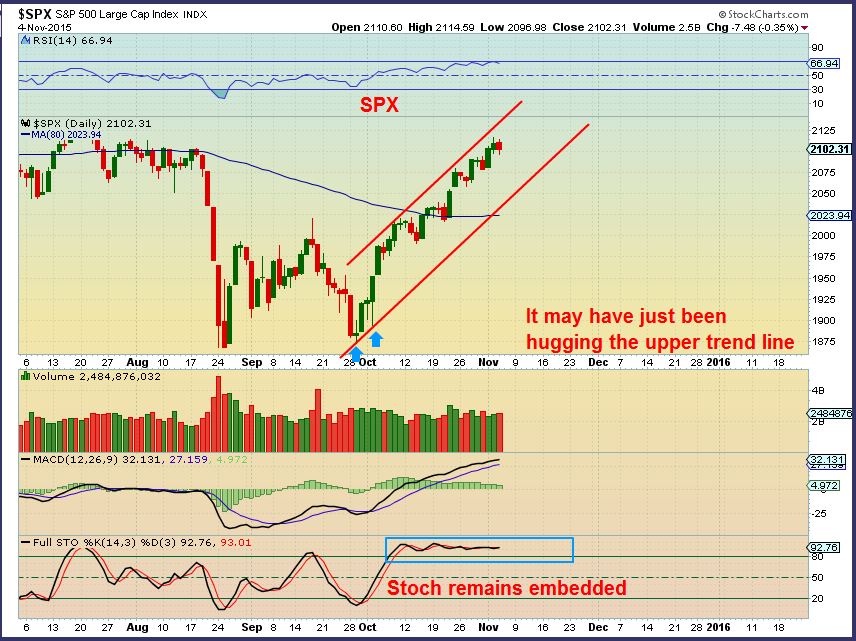
SPX - Expecting a pullback with resistance at former highs, this is wedge was posted and a possible channel could form.
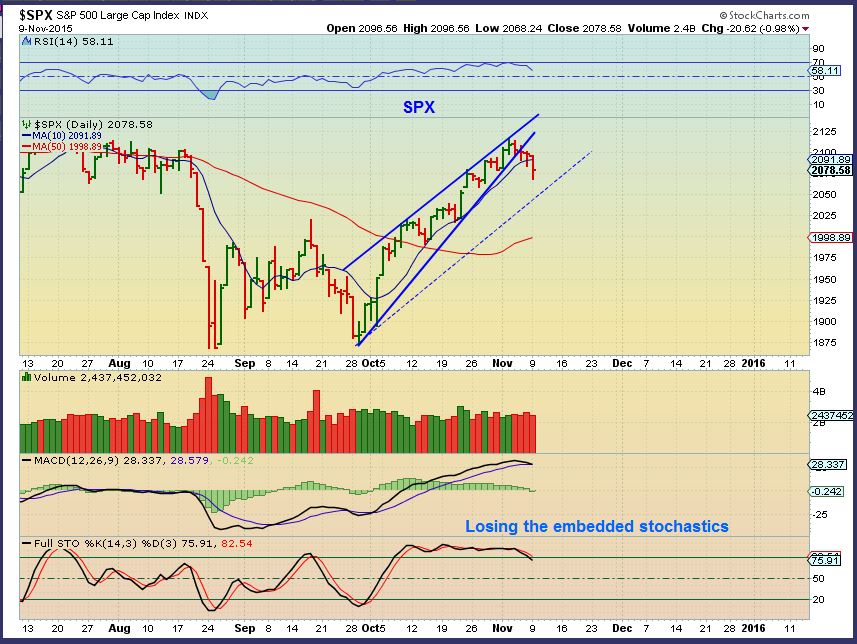
SPX - The channel has been broken, but thats not bearish by itself yet. The SPX tagged the 38% retrace. We could even fall further this week to the purple dotted trend line for a back test. This is also the 50% retrace and the 50sma is there, so good support could be found just below current price. I do expect a bounce soon.
This is not bearish at this point, but let me show you something a little more concerning here...
Read MoreAs I begin writing this report, it looks like OIL may be ready to bounce here. I wanted to take this time to examine the evidence and discuss my recent expectations in the Oil markets.
WTIC - Nov 11 this was our picture of OIL. Please note the $42.58 . Oil was not acting the way that it should early in a 2nd daily cycle and the high volume selling was noteworthy.
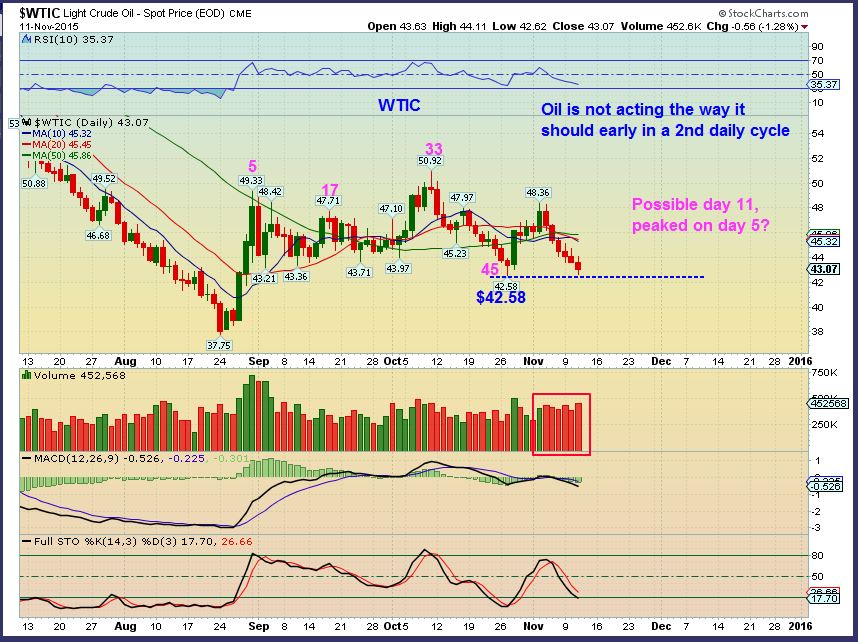
Now lets take a closer look on Nov 12 and discuss the implications.
Read MoreI wanted to discuss OIL a little later in this report this morning, since it is acting a little weaker than expected. We'll start with our market review.
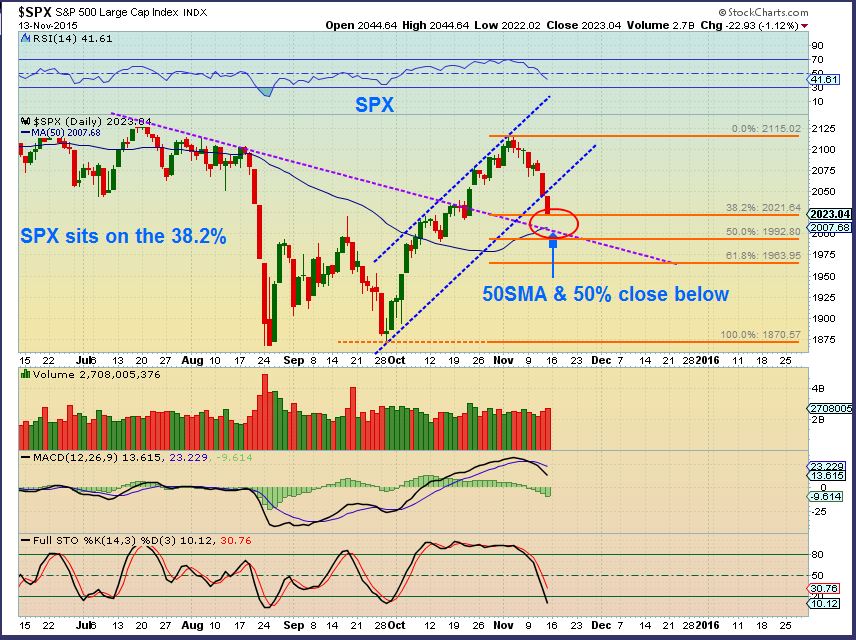
We expected a small pull back in the markets, and this chart showed where the Fib #'s would be. There was also a channel included.
We have reached that lower channel line and the 20sma. That could act as support, but the above chart also has the 38% Fib # at 2022 and we also see the 50sma and the purple break out in that area. That means the selling may not be over yet.
 Read More
There was no significant change in most of what was covered in yesterdays report. Draghi is scheduled to speak in London this morning, could his speech change things? It has in the past. For now, lets just do a review of what we've been looking for.
With a pullback due in the SPX, I drew this possibility yesterday. We could Tag the 50sma and lower trend line.
A reversal yesterday doesn't change the idea that we will still pull back, so I've added the fib #'s. We could bounce & still drop to the 50sma
Read MoreLets review a couple of ideas that we discussed in the weekend report in our premium section.
$USD - legitimate break out. This could have major implications for Gold, Commodities, and the markets.
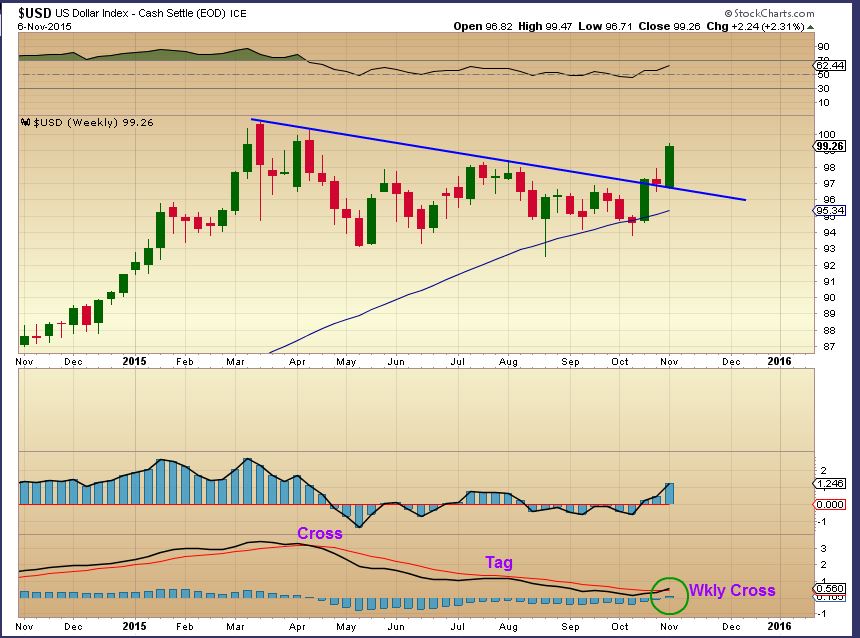
Lets look at the Dollar on a daily basis...
Read MoreAs mentioned in the weekend report, Gold & Silver have been selling off at a very rapid rate, and I think that they should be due for at least a bounce. I want to take a look at that idea in this report, but first a review of the markets.
The markets don't look bearish, but this possible rising wedge formed by Nov 4.
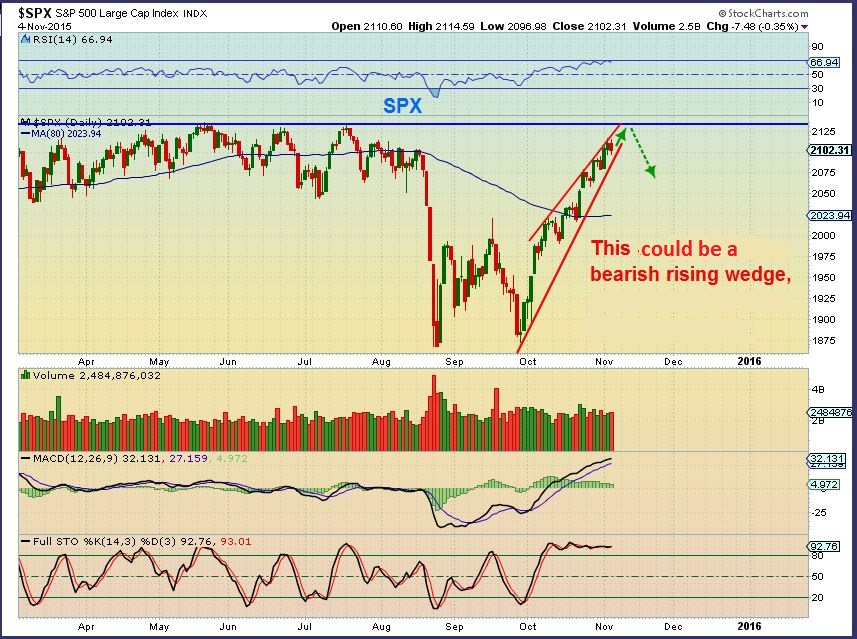
SPX currently- This does not have to drop too far, it could even go sideways.
Read MoreFrom the time of the Fed Meeting to the Jobs report Friday, we have had a lot of action in the markets. Action in the markets is what draws our charts, and we have an interesting mixture of charts to examine this weekend, so lets get to the 36 charts that I have prepared 🙂
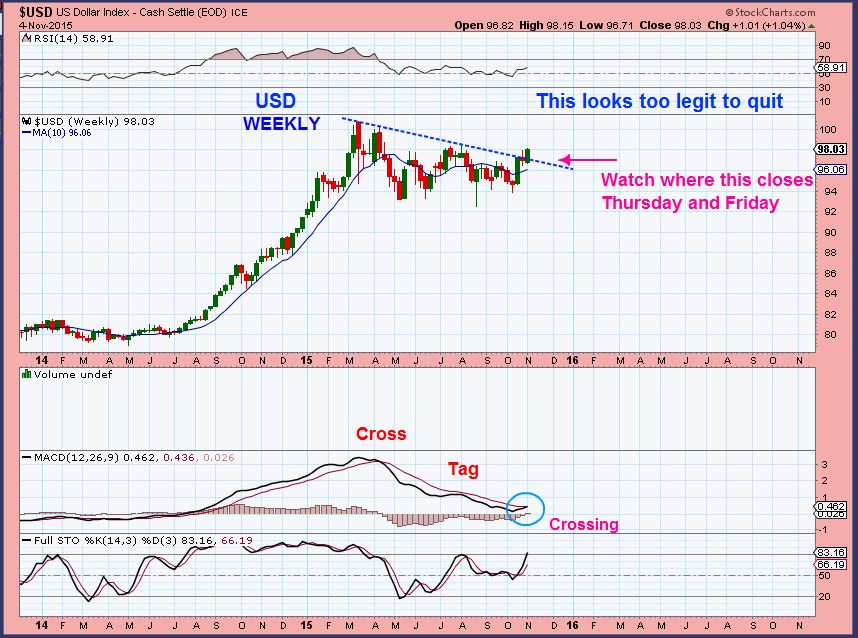
Lets start with the $USD WKLY. Nov 4 this looked too legit to quit, but we had to wait for Friday to see if out Dollar break out was real.
$USD - legitimate break out. This could have major implications.
Lets look at the Dollar on a daily basis...
Read MoreJobs Report, Flying Dollar, Diving Gold. Please dont forget Energy 🙂
Read MoreCount the Green days vs the Red days in Gold for the past 2 weeks, and you could say that it has been in free fall for a bit. We'll discuss that after a market review.
The SPX has been moving rapidly higher and recovering from the August - September sell off quickly. Since the former highs could offer resistance, we may see a drop with the jobs report .
Now I want to show you a chart of the SPX that really looks like a drop could come soon.
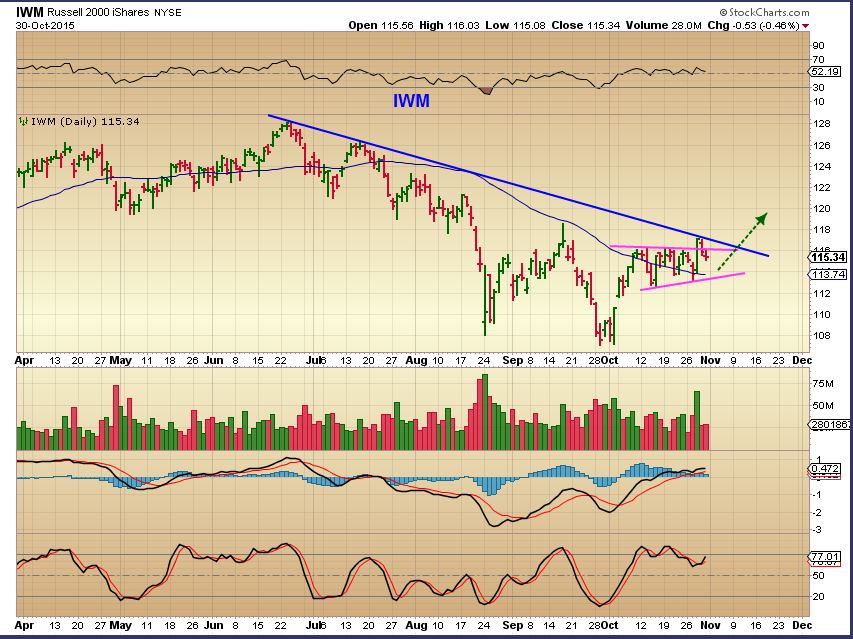
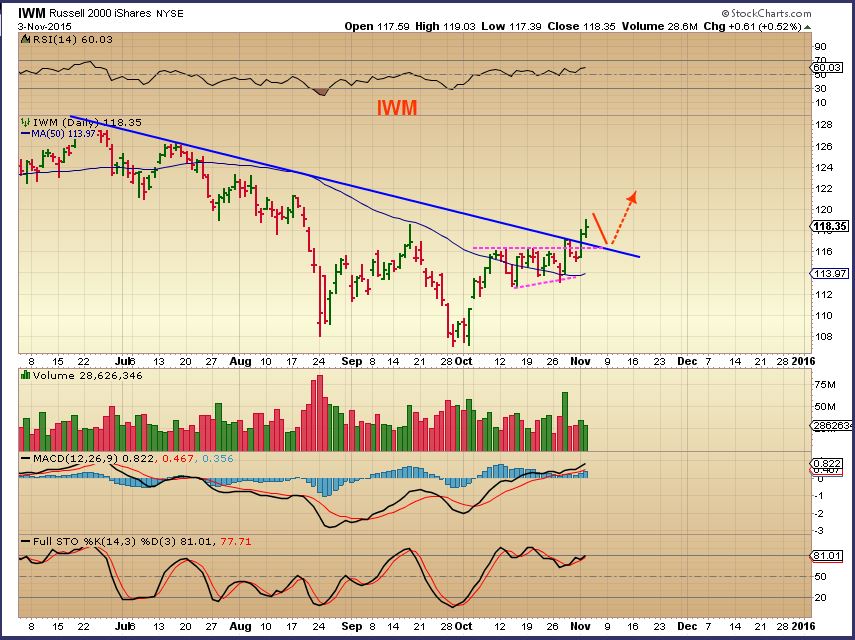
Read MoreI want to discus a few things in todays report, and then I will have a small ton of charts & Set ups in Energy and Commodities. I will start with the markets and their nice run higher lately. I did mention that the IWM, TRAN, and the IBB looked to be lagging a bit. IWM had a bullish set up and popped higher, but it hit another short term resistance area. I wanted to see a pop higher if it is going to possibly play catch up.
This was the IWM at that point on Oct 30. I expected a break higher.
IWM Nov 3 - We got he break higher ( Note: We may back test that break soon).
Lets look at the NASDAQ before we discuss Energy, The CRB, & The Precious Metals...
Read More
Scroll to top