You are here: Home1 / Premium
Markets are running, but I’m sure that everyone wants to discuss the light at the end of the tunnel. We’ll do our market review and then on to the Precious Metals.
.
SPX – I posted this Monday night, it looked like a pause in the strong move out of the ICL. A possible Bull flag.
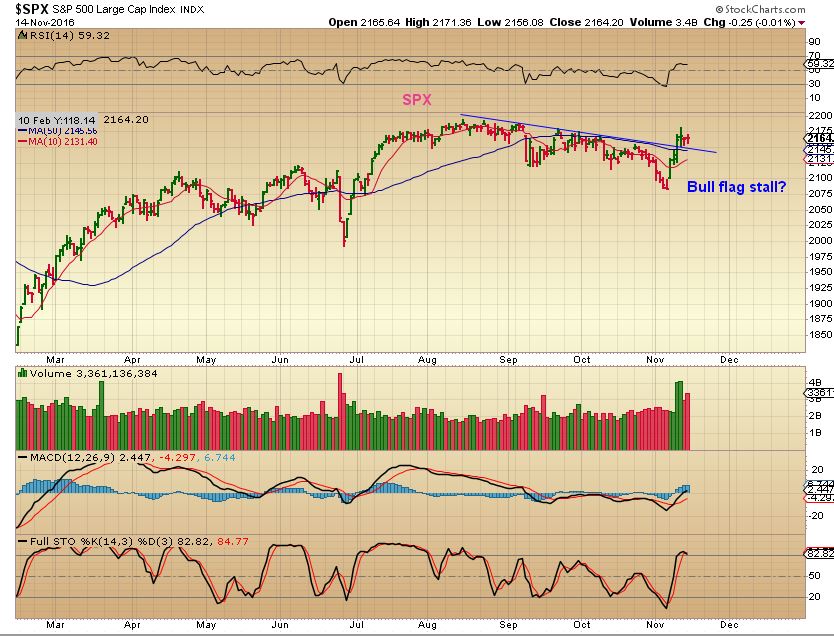
SPX – Tuesday it broke upward and this is only day 7. Bullish.
 Read more
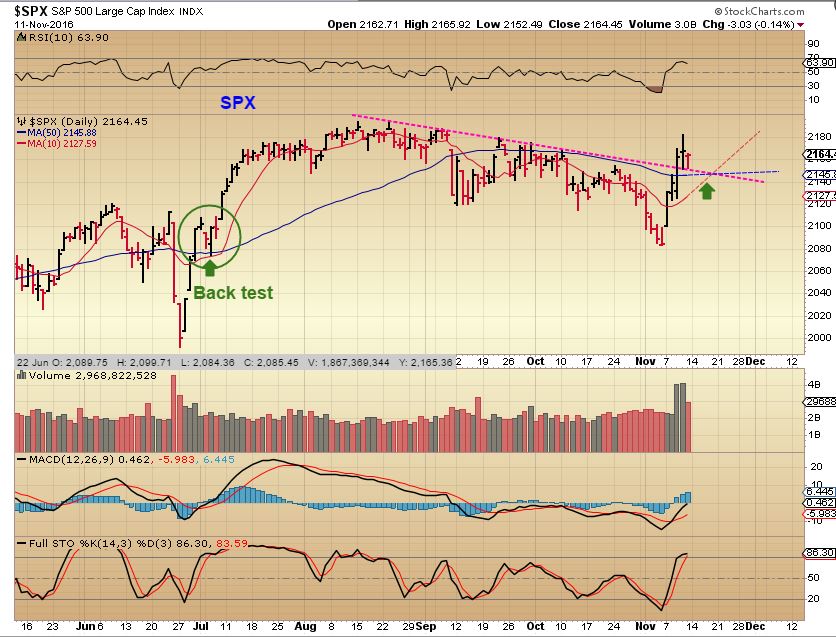
SPX – After an initial surge out of the lows, the S&P is stalling a bit. It may just be a pause before continuing higher.
Read more
Have you ever been driving along using your GPS and you decide that maybe you’re going to take a short cut to your destination? The GPS detects that you have left the designated course and immediately needs to compensate by announcing, “Recalculating Route!”. Well last week sectors of the markets took sharp detours right after the elections. Using over 50 charts, this weekend report will discuss the road we find ourselves on now.
.
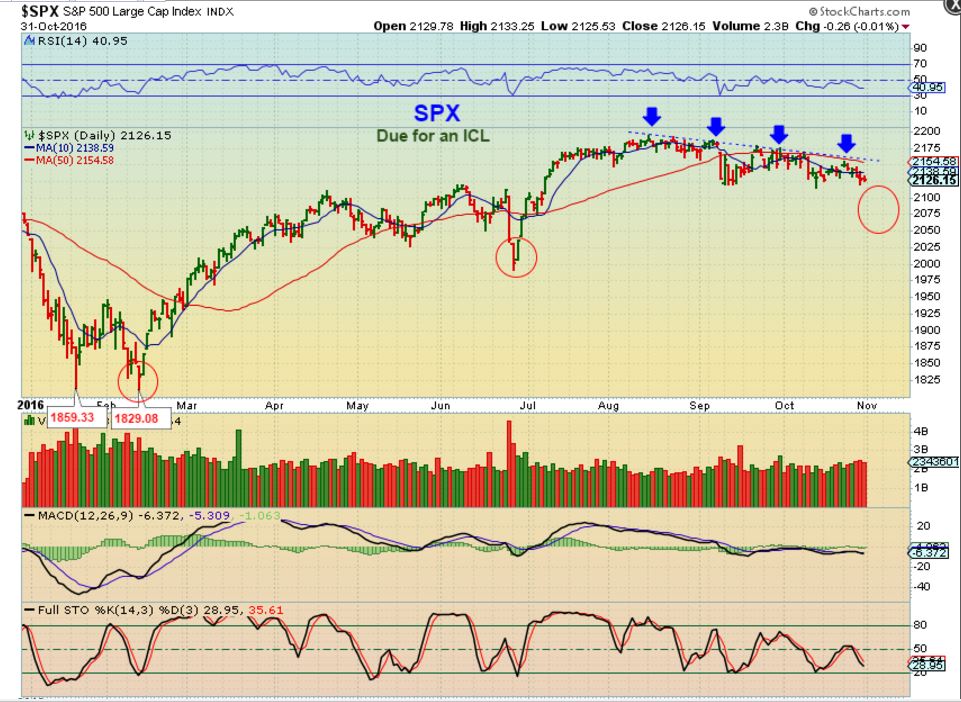
SPX – Nov 1st , Expecting a trade-able ICL, maybe in the 2070 area.
SPX – The ICL seems to be solidly in place, with a break out from the downtrend after the election results were in. Futures shot down immensely during election night, but the chart simply reflects the time that the market was open. Volume was huge after the election.
.
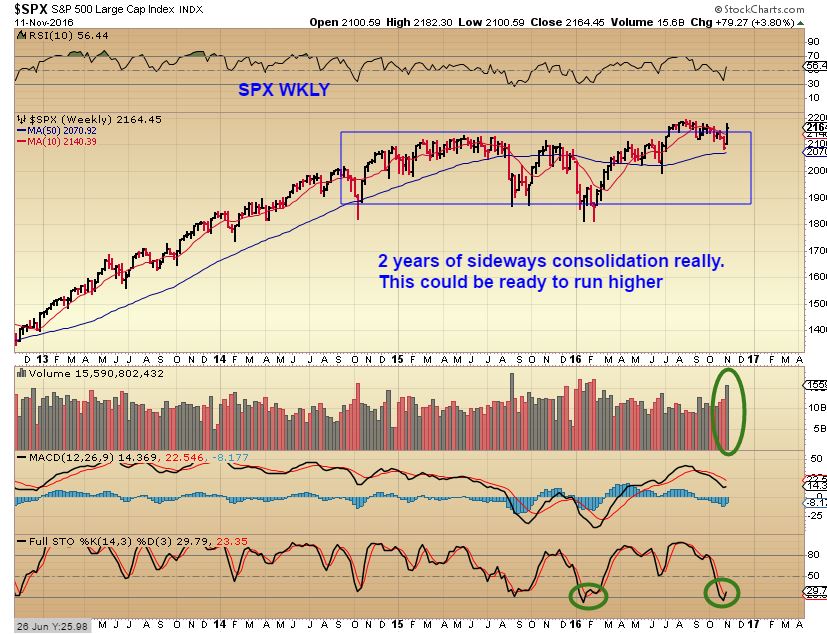
SPX WKLY – This could be a huge breakout from a 2 year consolidation, and it is oversold!
SO here is my current thinking…
Read more
It has been a crazy week, that’s for sure. Odd differences are appearing in the markets this week. Let’s get right into the report and you’ll see what I mean.
.
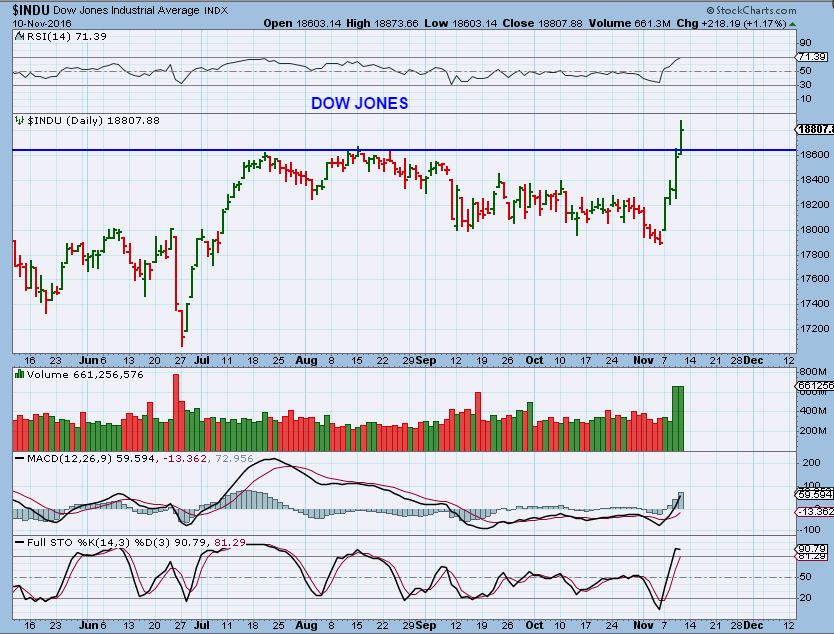
You probably heard about the Markets ripping out to new record highs if you were watching CNBC, and they were. This was the DJIA. The BKX ( banks) broke to new highs, the TRAN, RUT,IWM, SPX, and so on were rallying higher. This certainly looks like the start of a bullish break out.
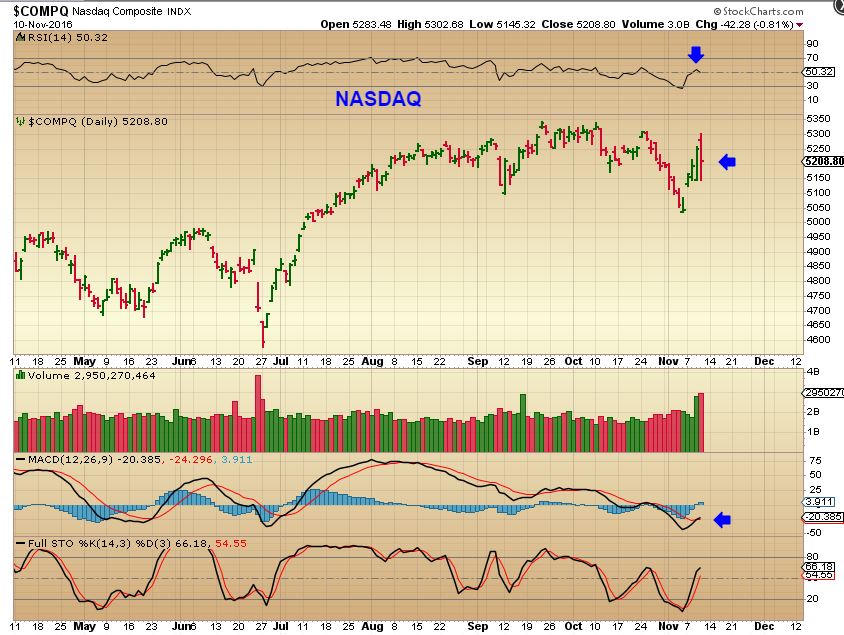
And then there was the NASDAQ. Hmmm, that was quite the reversal lower on Thursday.The Nasdaq closed down 42.
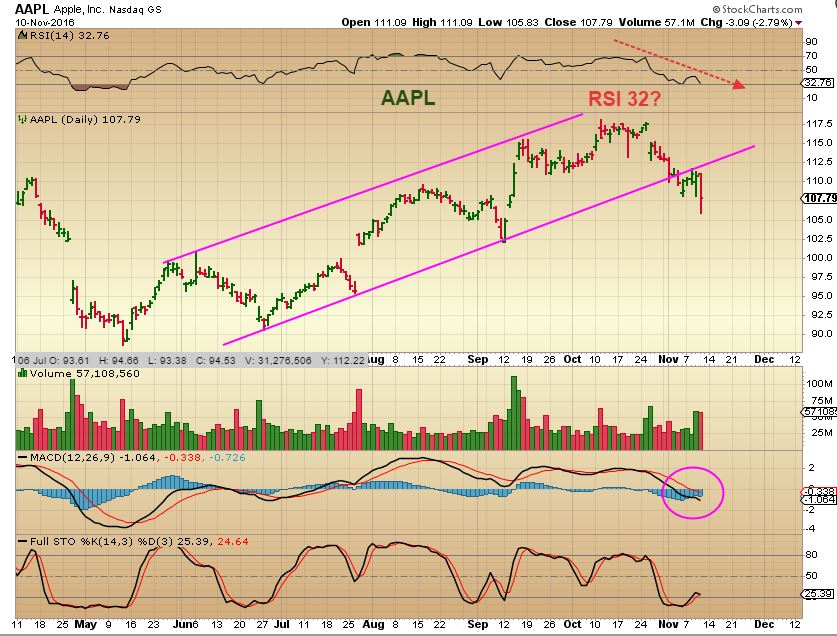
Lets look at a couple of our strong Tech companies. Hmmm? Apple?
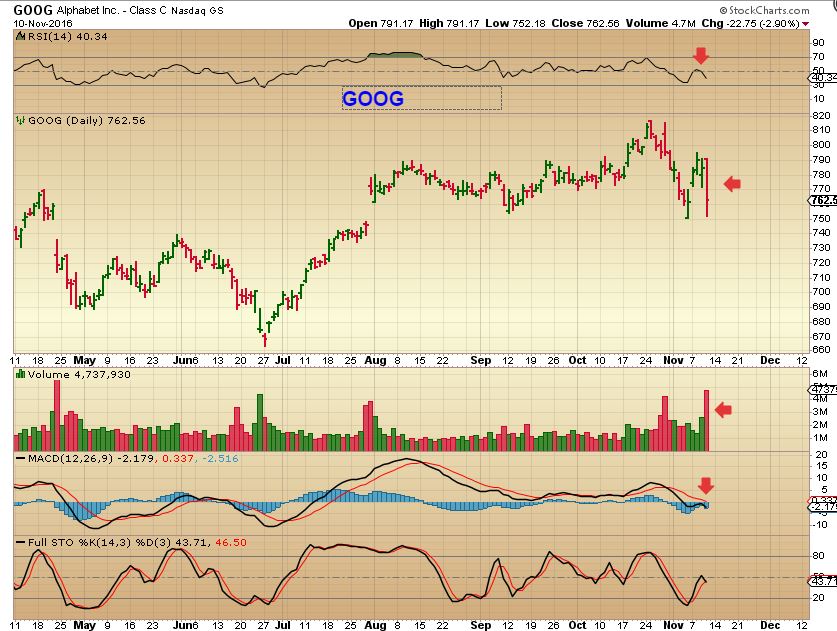
Look at GOOGLES RSI & MACD.
Read more
Well Wednesday was pretty crazy in the markets to say the least. Nothing has changed in my analyses however. I still think that we are seeing several Bulls ready to run. Let’s get right to the charts and see what we can discern from the extreme moves that took place Yesterday.
.
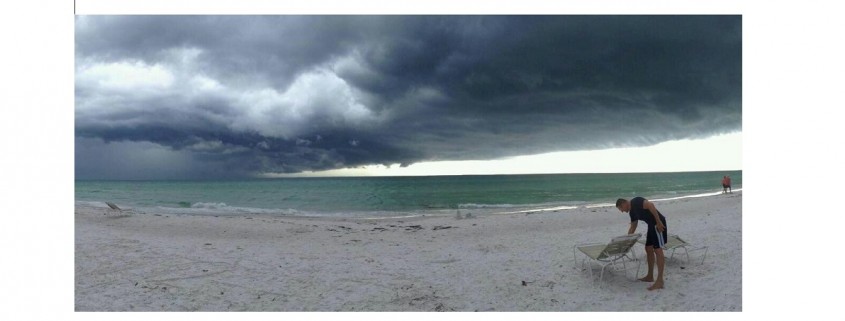
Sometimes when we are looking out over the horizon, we see what looks like a storm rolling in. Basically there is nothing that you can do, except to be prepared. It is normal to wonder, “Will the winds of change do a lot of damage?” “Will they just be a moment of unsettled turbulence with minimal damage?” “Will we have to pick up an abundance of scattered debris, or will this just pass by?”
We have been taking positions in the Precious Metals markets, so this storm may be just like riding the rapids for most of us, if things do not change by the morning. The General Markets, on the other hand, are taking a good hit tonight for those trading in that area. We just have to watch how things settle after the storm surge passes. Let me show you why…
Read more
So far things are playing out in ways that we anticipated. This should make the trades easier to enter. Lets review the Monday action in the markets.
.
SPX OCT 31 – Using cycle analyses, I have been expecting the SPX to drop into a trade-able low. The circled area was the expected target, a higher low and not an outright crash.
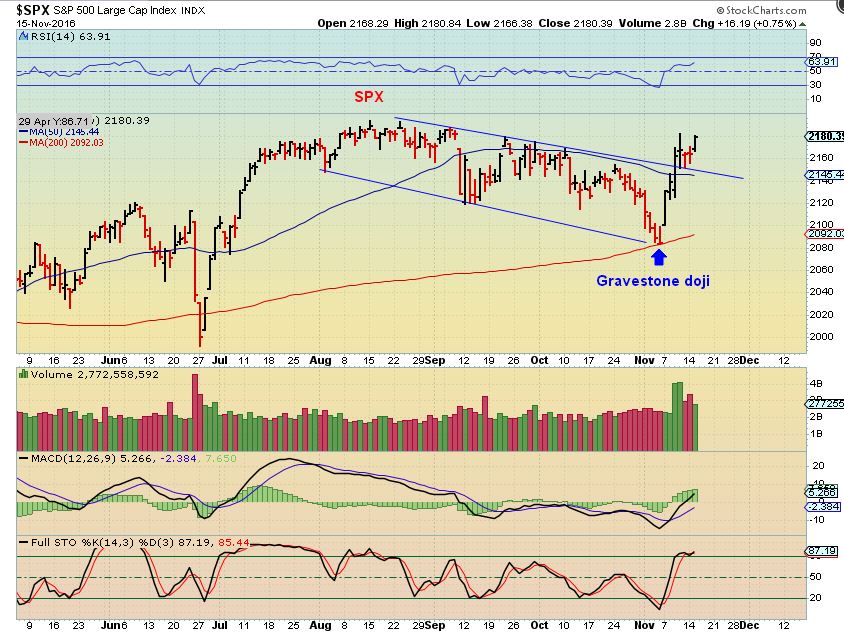
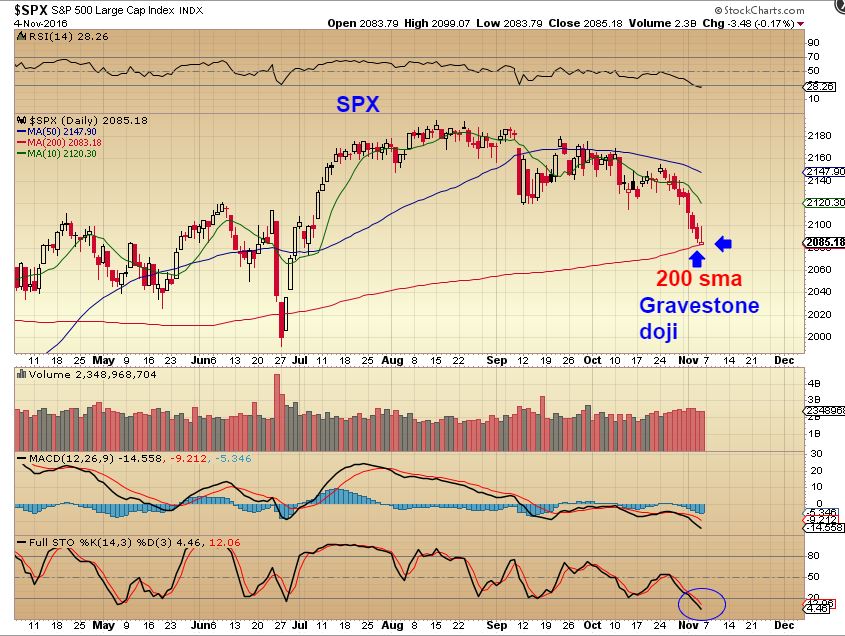
SPX – Nov 4th, This is a gravestone doji and quite often acts as a reversal candle after a sell off. Timing was correct and we were within that circled area. We would look for a reversal.
SPX Nov 7th – Monday definitely saw a strong move out of the lows by all indexes. The SPX broke above the 10sma and in the past, day 1 was not the end of it. I expect follow through and then a possible back test of the 10sma. We saw this in Februarys ICL and Junes ICL.

Read more
Welcome to the weekend report. It is another long report with roughly 30 charts, to build up your confidence. So grab your coffee and lets get right to the charts!
.
SPX – I have been expecting this dip and my target area shown here has been met. Do we see signs of a bottom?
SPX – Yes, this is a gravestone doji sitting on the 200sma. This could be the dcl, because the ‘ cycle-timing’ is right. We wait for a swing low and confirmation before entering, since it can drop below the 200sma as a shake out. Look at the selling here, 9 straight days of red high volume. THAT will change sentiment from Bullish to ” I dont want to be long”. We may get post election rally no matter who wins, and everyone will then say , ” SO & SO won, and that was good news to the markets.”

Read more
We go into a Fed Day knowing that there will be volatility. It doesn’t matter what my expectations are longterm, the short term volatility can be difficult for many. That’s why I wrote this on Wednesday morning before the Fed release when asked about Gold ( and miners)…
Read more
Scroll to top