You are here: Home1 / Premium
I have been covering the Big Picture in the weekend reports, and not a whole lot changed since the last weekend report really. That said, I will cover all of the market sectors that I usually do, and discuss the possibilities going forward. I expect this to me a week of increased activity (FOMC).
Read more
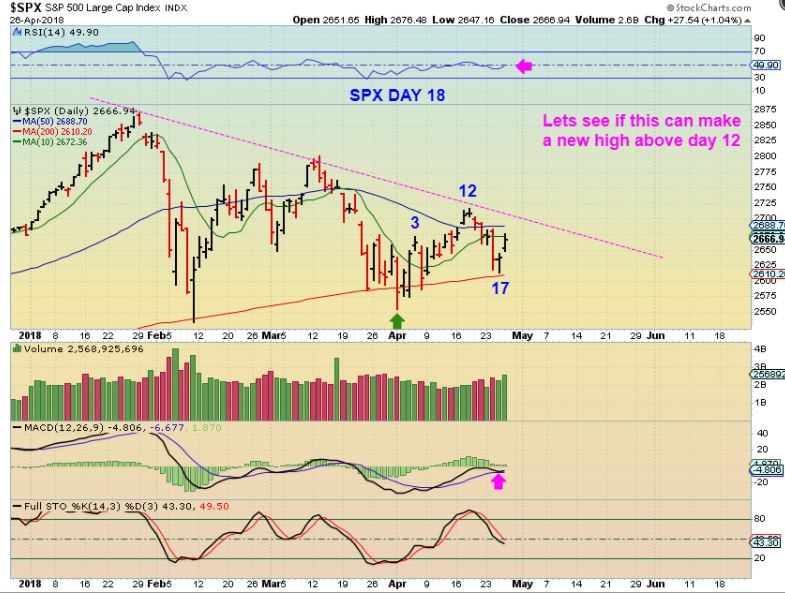
SPX – We have a swing low at what looks to be a 1/2 cycle low on day 18. The follow through will tell us the strength of the daily cycle. The 200sma acted as support, and volume increased off of the low. I willbe watching for a break of the down trend line & a new high above day 12.
Read more
It is earnings season this week and suddenly we are seeing the Markets sell down, even when reports do not seem that bad. Let’s do a quick review…
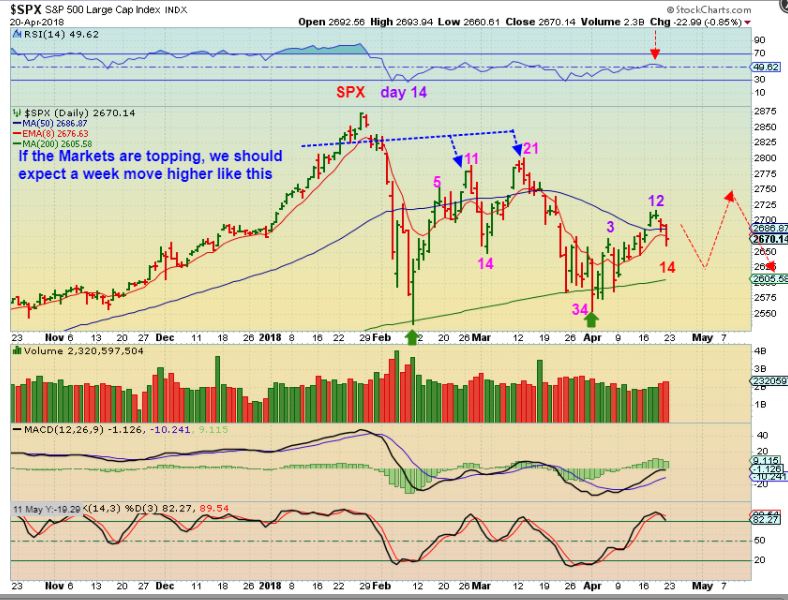
SPX APRIL 20– Last week I looked at the move out of the Feb lows and noticed a pretty drastic sell off on day 13 & 14 below the 50sma, so I drew the SPX chart with a similar drop into day 14, a bounce, and then possibly another drop.
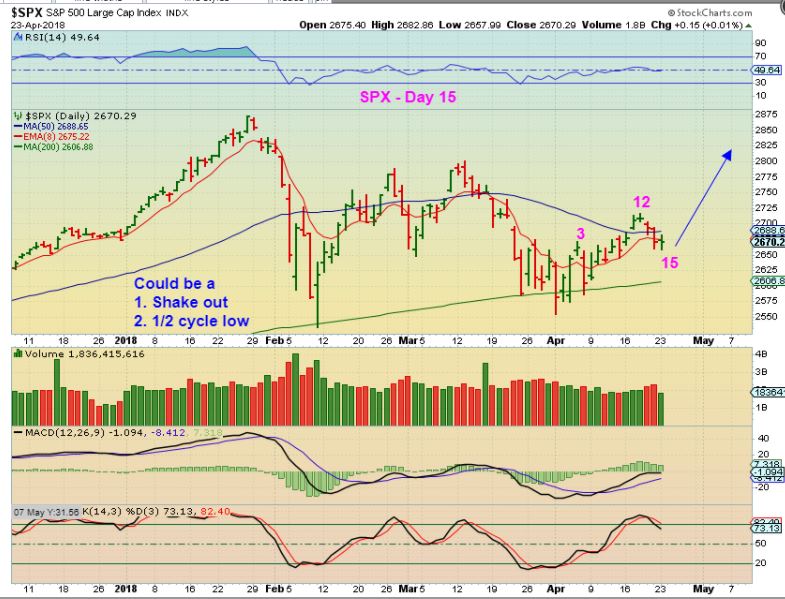
SPX APRIL 23 – Monday I thought that by day 15 we would get our 1/2 cycle low, and then a bounce higher. The markets were so strong in Oct, Nov, Dec, and Jan that I would expect them to at least make a double top, eventually running to the former highs. On Tuesday…
SPX – We are REALLY seeing a struggle here to gain some traction. 2553.80 IS CRITICAL in my opinion. If those lows break, this would appear to be a failed daily cycle.

And in addition to that, I posted this chart in the comments section yesterday.
Read more
With Mondays trading, we didn’t see a lot of change, and our expectations remain the same, so let’s do a Tuesday Morning review…
SPX – This should be a 1/2 cycle dip, and we need to see price break higher soon. I expect that it will back toward the recent highs, and if it does, this current action could look like a shake out at the 50sma. So far, the move out of the lows has been a sideways consolidation.
Read more
SPX DAILY – This is where the SPX stands with its cycle count. We experienced a bit of weakness at the end of last week, and you all know my Big Picture outlook. This could be playing out the way it was presented in the weekend report 3 weeks and also 2 weeks ago. On the chart I wrote week, and meant ‘weak’.
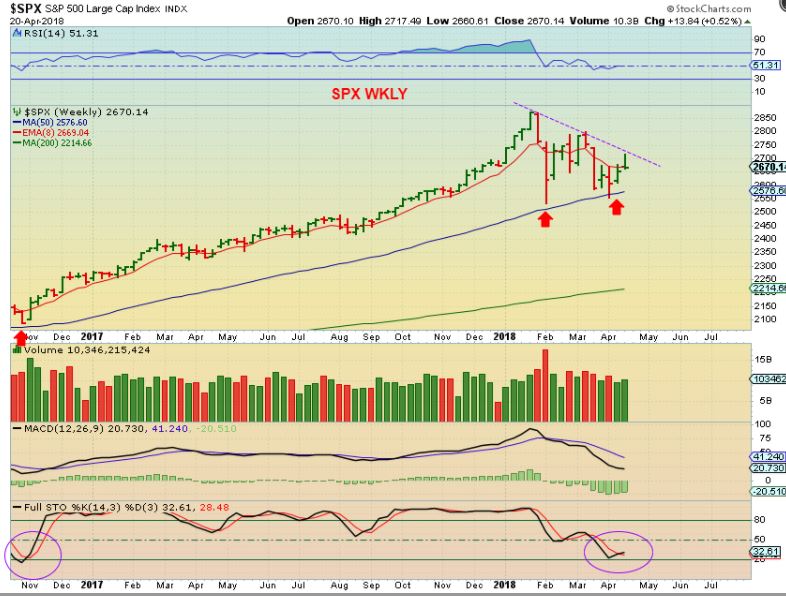
SPX WEEKLY – Nothing is wrong with the weekly chart at this point, but it was rejected temporarily at the down trend line, and I want to discuss the big picture further in this report.
Read more
So far in the markets it seemed like Everything had been taking turns moving higher, right? Aa a lean Green fighting machine, we’ve seen Tech, Biotech, Oil & Energy, Precious metals, metals and miners all enjoying a day in the limelight. All the charts are looking great!
….Or are they?
.
On a day when the NASDAQ had what would be considered a normal healthy pull back,
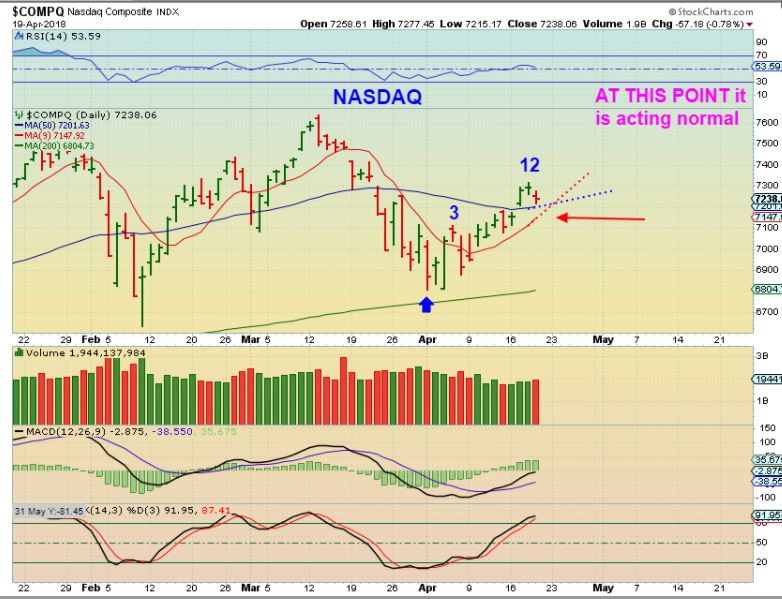
SOX ( Or SOXL) Semiconductors – Suddenly yesterday, behind the beauty cracks appeared.

Read more
It was another one of those days when it seems like almost every sector had green in it and stocks that were moving higher yesterday. Lets take a short review of a couple of different sectors and then discuss some of our current bullish set ups…
.
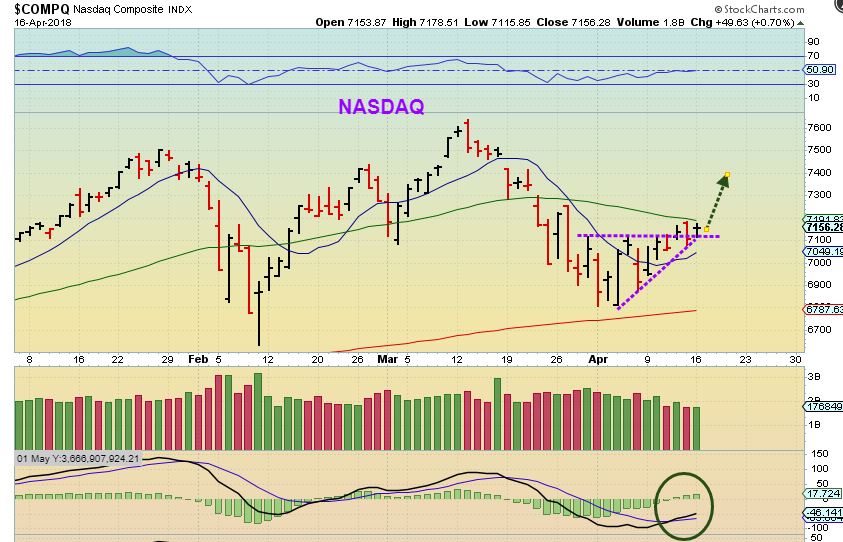
NASDAQ from yesterday – Early in the daily cycle count, I was leaning toward a bullish resolve of this battle at the lows. It was the most likely scenario due to cycle count and many of the stocks that I liked were holding up nicely.
Read more
NASDAQ – The general Markets were on day 10 of a new daily cycle Monday. The are pushing against the 50sma as resistance…
Read more
Scroll to top