You are here: Home1 / Public Blog Back in Dec, I noticed some interesting activity in the charts of 3D printer stocks, and pointed it out in my reports. Often after a large sell off, when selling gets exhausted , you get a period of short covering. Sometimes that can turn into a mini rally, but the inevitable pullback is to be expected . What can we look for then? Is there a way to tell if they are a Buy? Lets review:
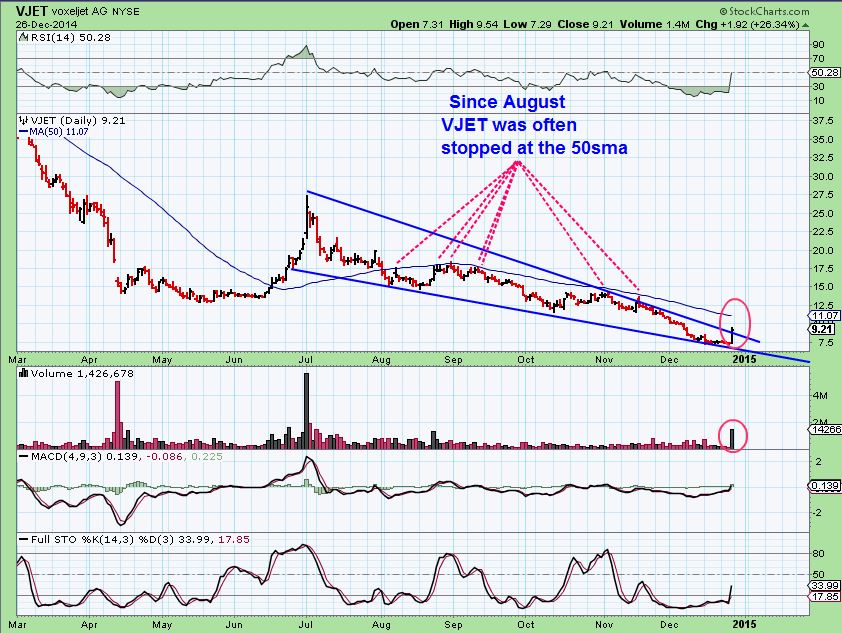
I noticed a strong high volume POP in VJET

SO I decided to look at other stocks in that sector and see if anything was interesting ...
Read MoreThe following is a portion of a ' Premium Report' put out Monday Jan 26. This is only 1/2 of the report, but should be helpful . To be honest, I initially only made small profits on some of these trades at first. I had to leave town after the New England Storm , and since positions are volatile at the lows , I cashed out & re-entered later when I could monitor them. I 've added a few updated charts too. Enjoy
JAN 26 ,2015
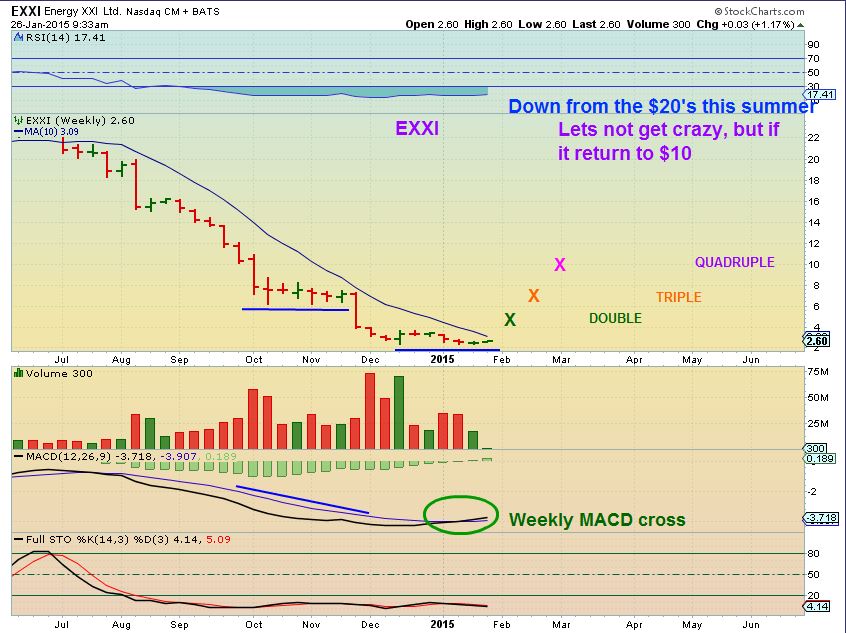
Let me start by showing you an Energy stock that got taken out to the whipping post. It is beaten down and has double bottomed. It seems like all of the downside ( At least for now) has been met. Risk reward is skewed toward less risk (Using stops) and more upside potential if conditions play out. Some of these stocks could just "Bounce" and do very well.
EXXI WEEKLY - Double bottom with a MACD cross? $2.60

Read MoreI have to be honest, I was recently looking at the markets and thinking that the apparent weakness was going to prevail. Recently I've been staring at the SOX and something is starting to pop out at me. let me explain...
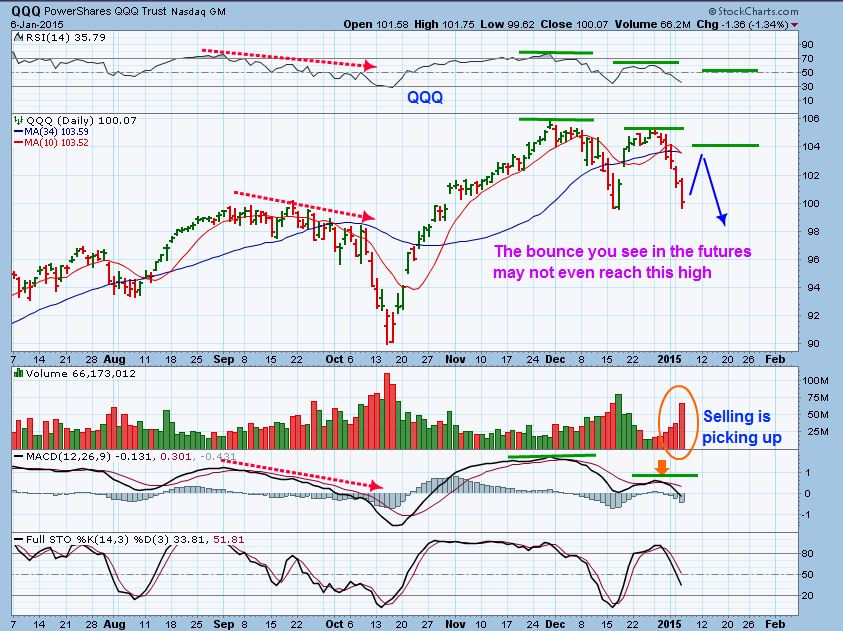
I had mentioned to my readers back in DEC that I thought I saw internal weakness in the markets. As the markets began to weakly bounce & Roll over, I then posted this chart JAN 6 and mentioned that though I expect a bounce here, I thought we may 'fail " at the 50sma. BUY THE DIPS might not work, and possibly a short set up .

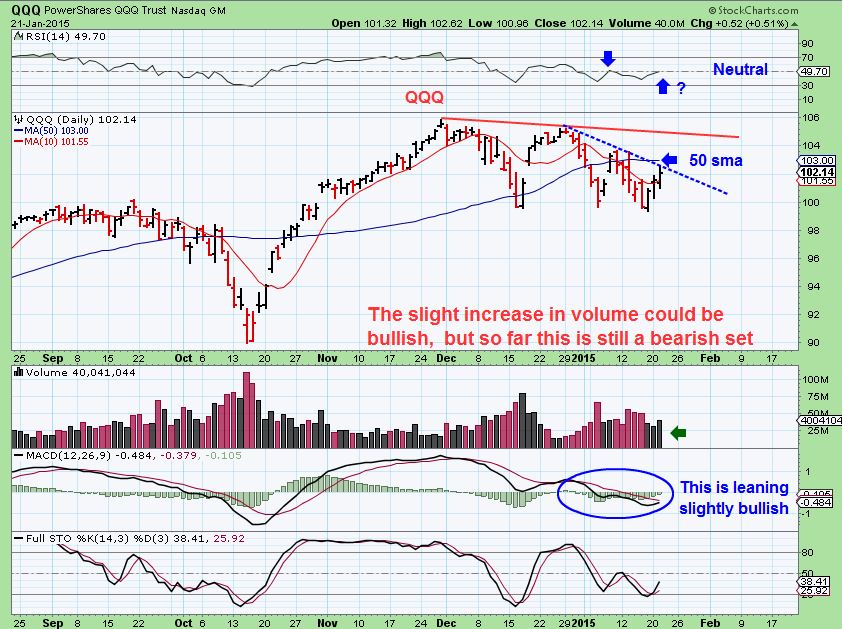
By Jan 21 the weak bounce had played out, I began to think we may get a good shorting opportunity, but wait for that ECB mtg.

But then I saw those SOCKS! No, not the multi colored array of Socks above, I mean ...
Read More
Scroll to top


