Dec 1,2014
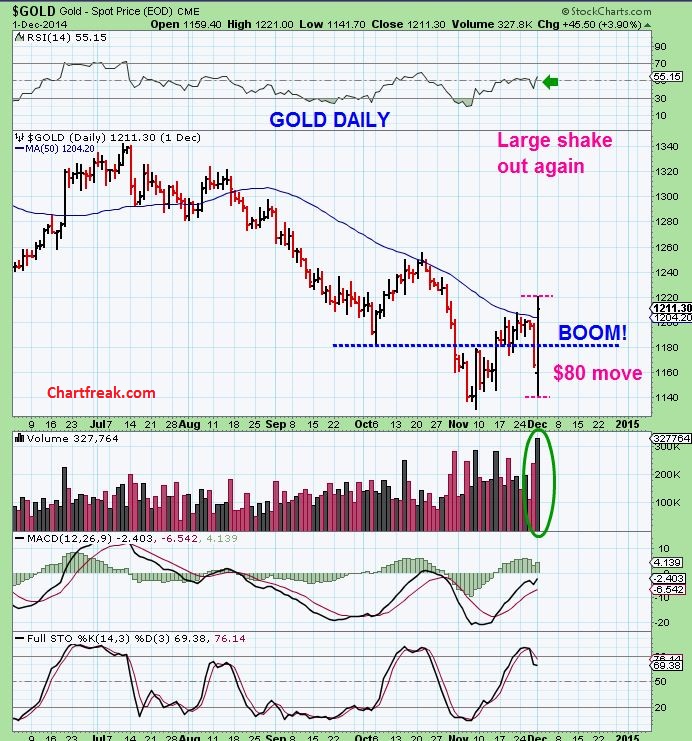
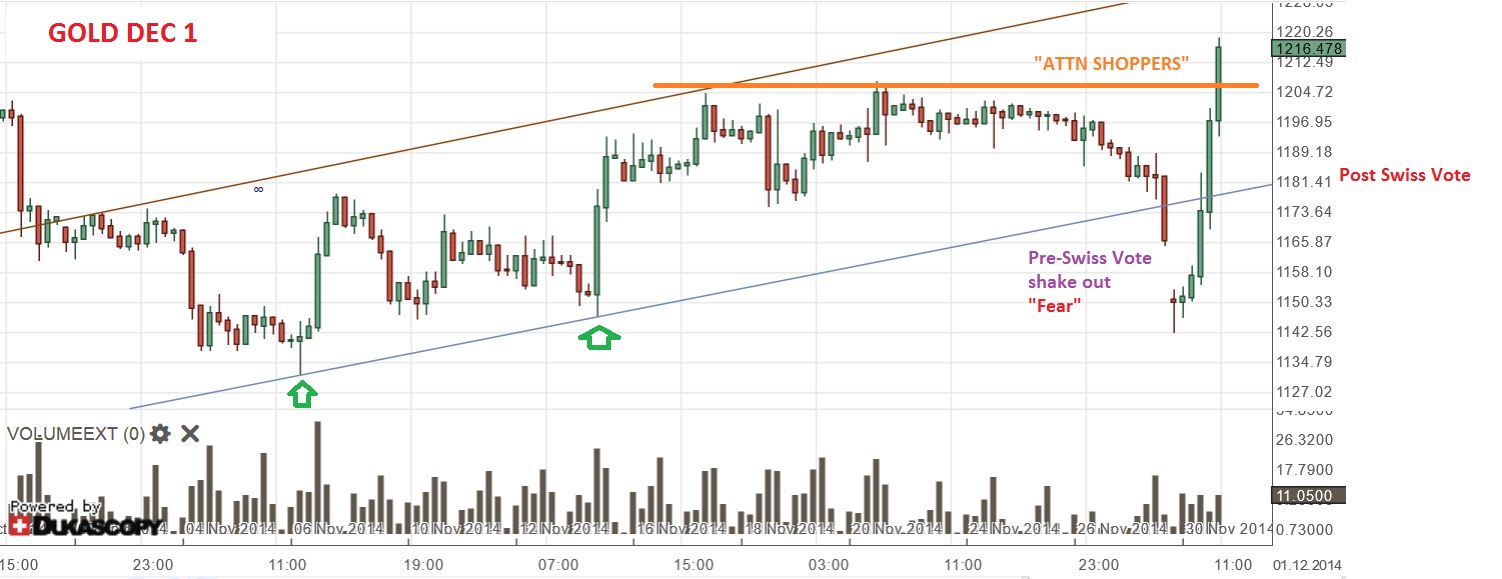
An Anomaly is something that deviates from the norm or the standard. When you see one, its rather hard to know what to make of it. Even though we have to "Expect the unexpected" in the markets, I must admit that Fridays HIGH VOLUME in Gold / Silver / Miners (And OIL / Energy stocks for that matter) took me very much by surprise. Let me say that I was Shocked when I saw that volume, let alone that it came in the form of a GOLD SMACK DOWN on a holiday. Friday was an anomaly for me. By normal standards it is usually part of a 4 day vacation type weekend when many 'pack it in' to travel & be with family. That Friday after Thanksgiving is usually a shortened light volume 1/2 day of trading . A NON-EVENT. When someone asks me "Are you still learning from the markets?" I give it a resounding "OH YES!" for just such occasions. lesson here, stay alert - stay frosty at all times, and if the markets are open....expect the unexpected!
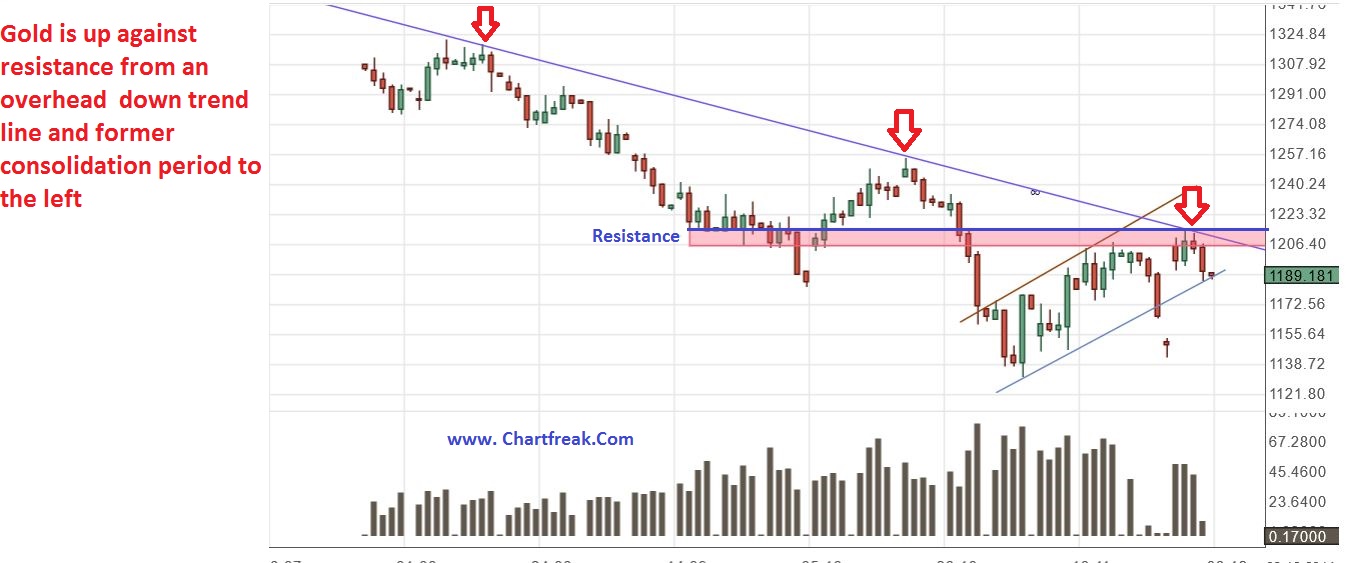
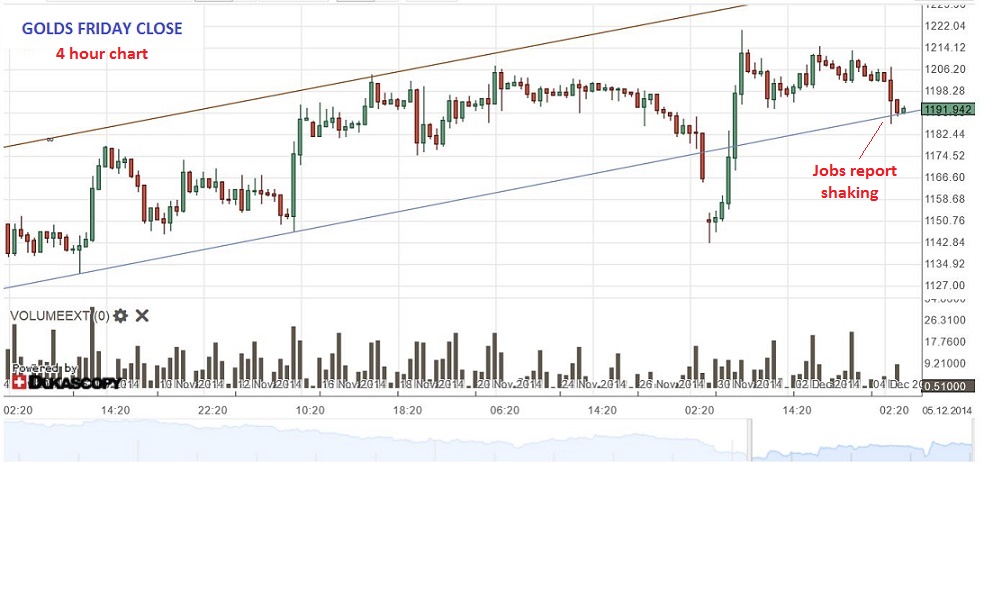
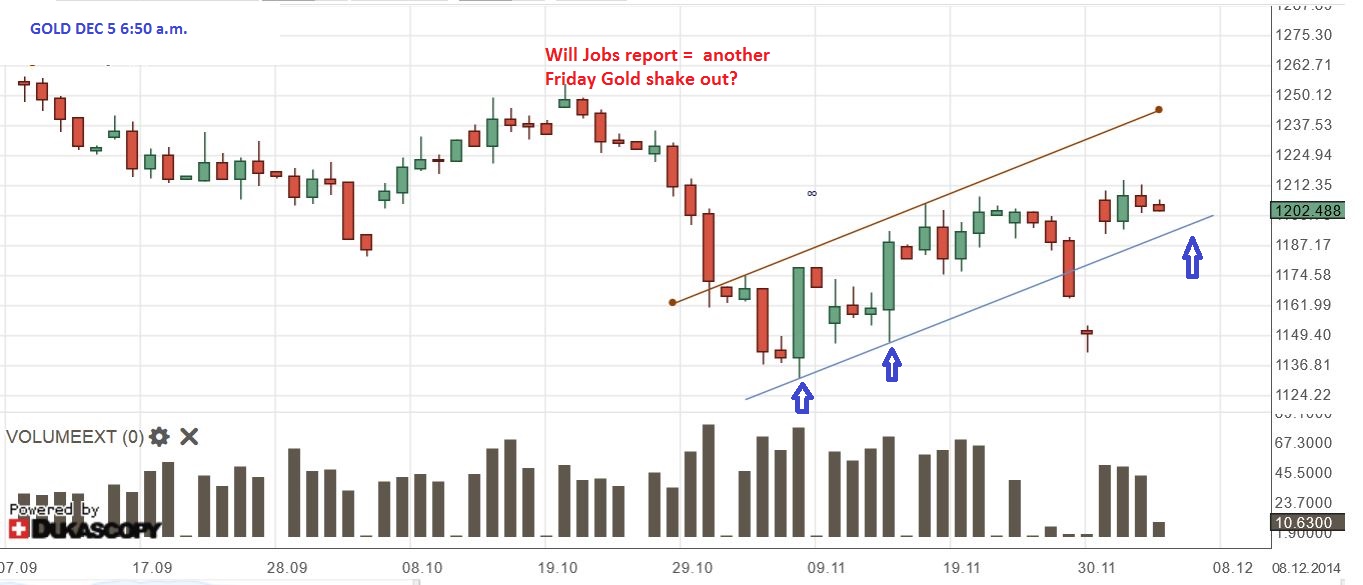
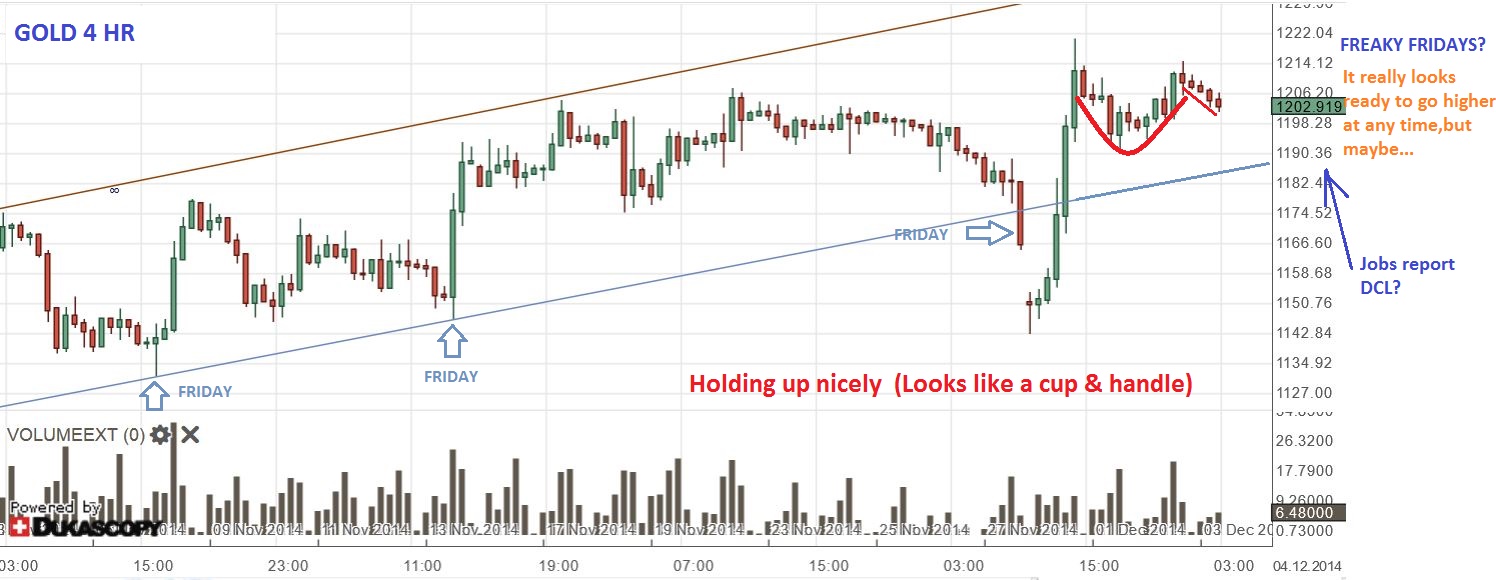
The Big question is , "What happens now with Gold? Are the recent lows doomed? Did the Swiss Vote ruin everything?" Lets review a few points and discuss
Read More

