Author Archive for: Alex - Chart Freak
About Alex - Chart Freak
I’ve been a full time trader for well over a decade and began trading in the late 1990s while working in management and sales at a well-known aerospace company. As my style evolved, so did my success, and it allowed me to leave corporate America to pursue my passion and trade full time.
Entries by Alex - Chart Freak
PUBLIC REPORT : Is Silver Really A The Weak Link?
February 3, 2016 /16 Comments/in Public /by Alex - Chart FreakI am not what many consider to be a Perma Gold Bull, but I do expect a 3rd phase of the 2000 Gold run to take place and end in a spectacular blow off top phase. That being the case, I also watch intently when we get these bear market lows for signs of a […]
Never A Straight Path
February 3, 2016 /56 Comments/in Premium /by Alex - Chart FreakThe twists and turns of the markets continue. There is so much going on , that this is like a weekend report, with 22 charts. Lets take a closer look.
.
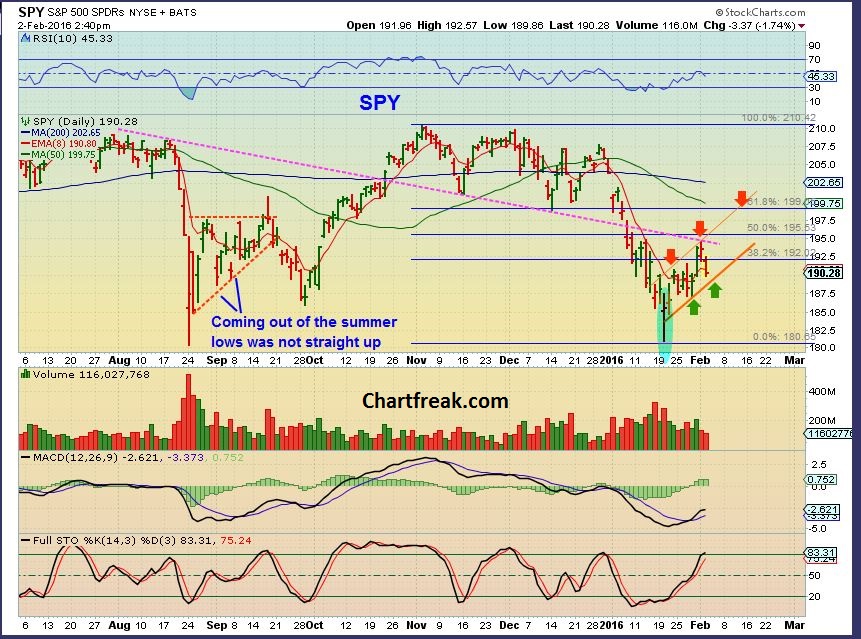
SPY - After hitting some overhead resistance , yesterdays sell off remains within acceptable parameters, however...
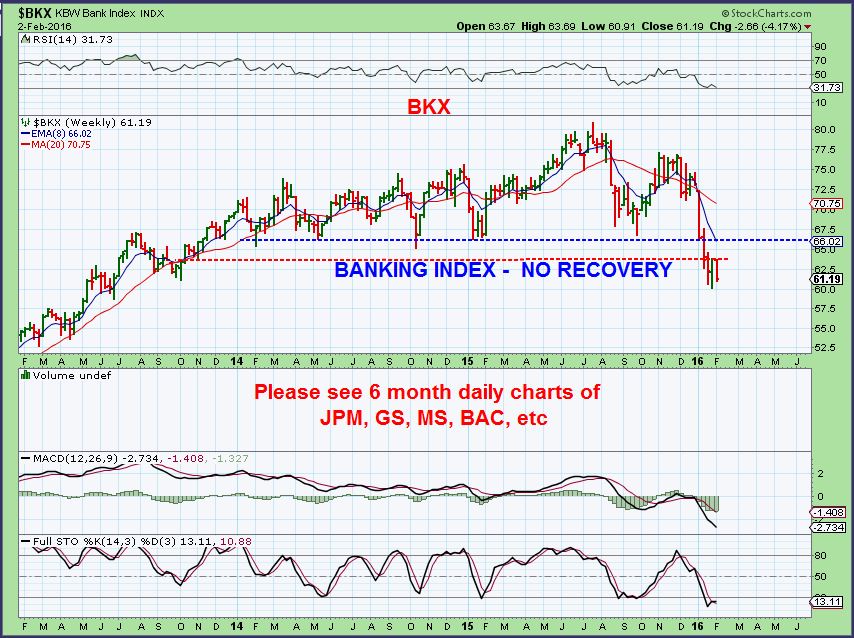
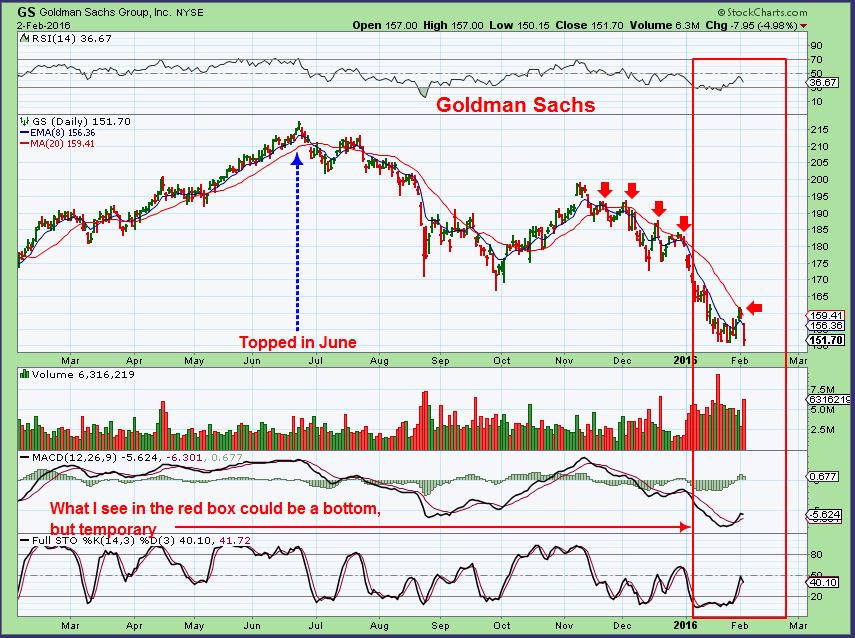
The BANKING INDEX still looks ugly.
This is GS for example.
Will markets keep rising with an ugly banking sector? Lets dig deeper...
2-2-2016 – Lets Check This Puppy Out
February 2, 2016 /81 Comments/in Premium /by Alex - Chart FreakIt has only been 1 trading day since the 2 weekend reports were released, but we can still check this puppy out and see if everything is as expected. To the charts!...
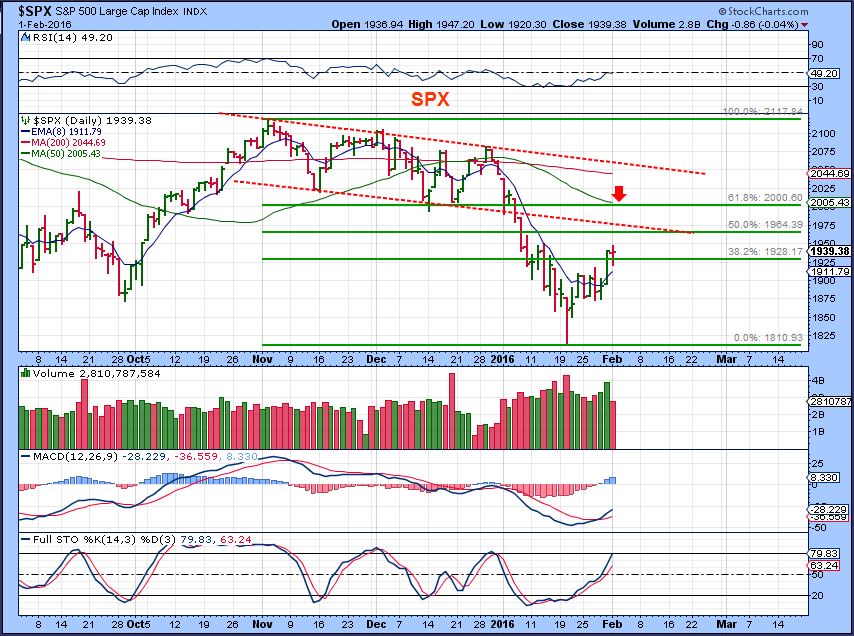
SPX - The markets sold off, but were bought back as the day ended. We still have plenty of time for upside to continue.
Public Report – Precious Metals Activity
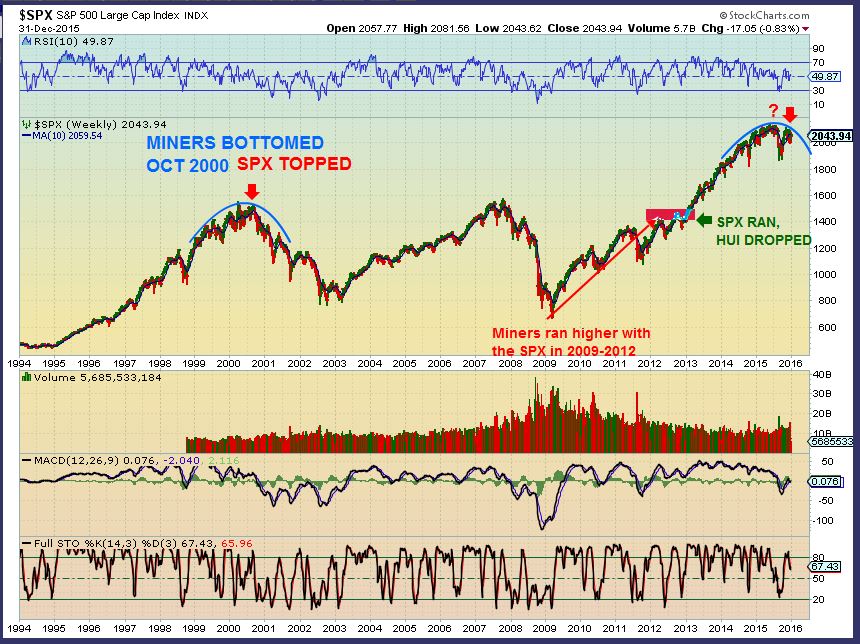
February 1, 2016 in Public /by Alex - Chart FreakWhen I drew this chart in December, I was pointing out that I expected the Markets to be topping and Precious metals to possibly be bottoming. Notice how the 2000 top in the SPX coincided with Miners bottoming. Also notice how much that 2000 top looked like the markets in December.
.
Well, we certainly did see the markets drop though out almost all of January.
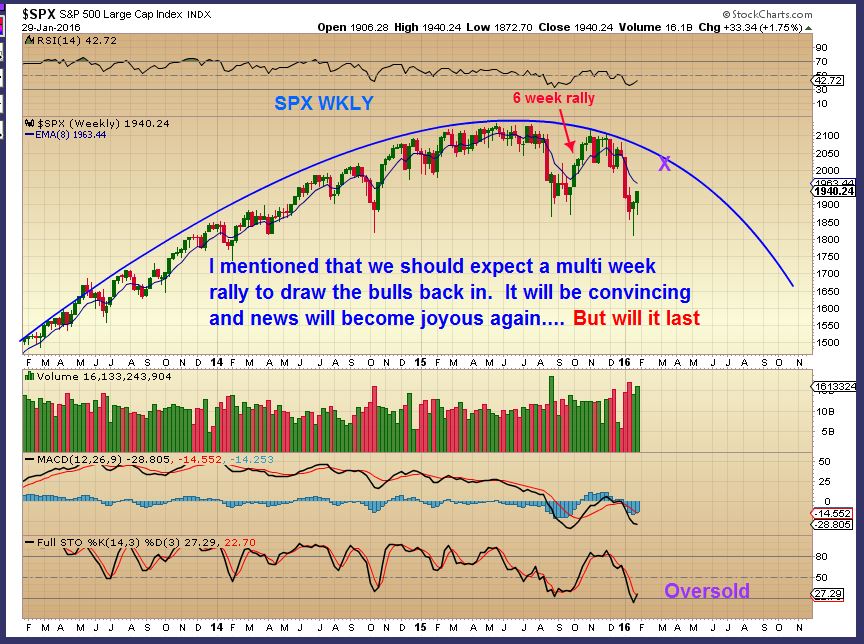
We had a 6 week believable rally out of the summer crash that got the Bulls long again. I expect that we may something similar now. But can we say that Miners bottomed, at least temporarily?
Lets look at Precious Metals
Part 2 – They Bought Something, Did You?
February 1, 2016 /35 Comments/in Premium /by Alex - Chart FreakOver the past few weeks , there have been a lot of buying opportunities. Long precious Metals, ETFs that allow you to Short the markets, etc. I have about about 50 more charts (in addition to Part 1 of this weekend report) to further discuss the buying opportunities currently forming. To the charts ...
.
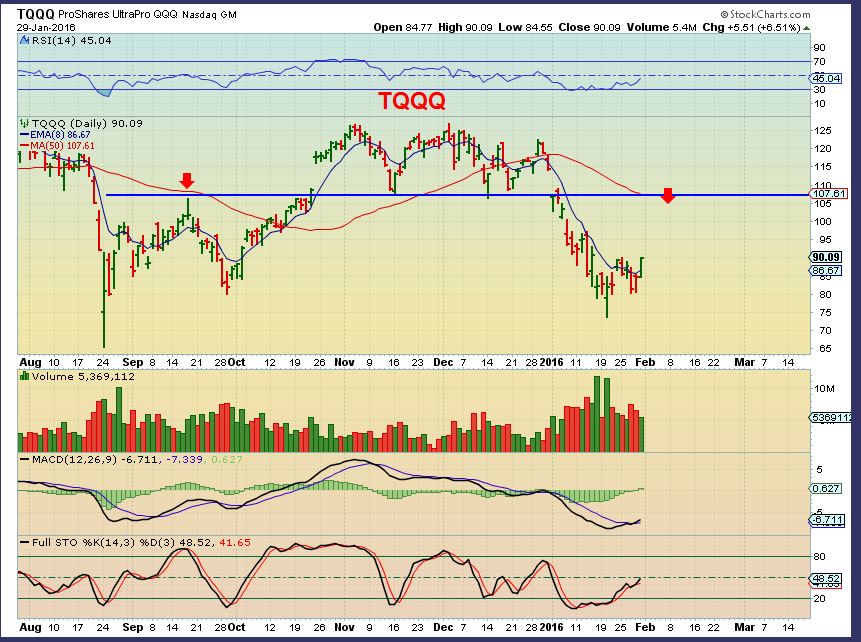
When The NASDAQ back tested that break...
You could have bought TQQQ low risk at $80 with a stop right below the lows. Since I think there is more upside, it is still a buy if you ask me. Especially if we get a dip in the markets. See also ETFs like UPRO, SOX, AND TNA
There is much more...
1-29 Wkend Report: It’s Adding Up
January 31, 2016 /42 Comments/in Premium /by Alex - Chart FreakWe are getting the follow through that we expected in many different areas of the Market. The small pieces of the big picture continue to add up. Will it continue? Lets check the charts! 🙂
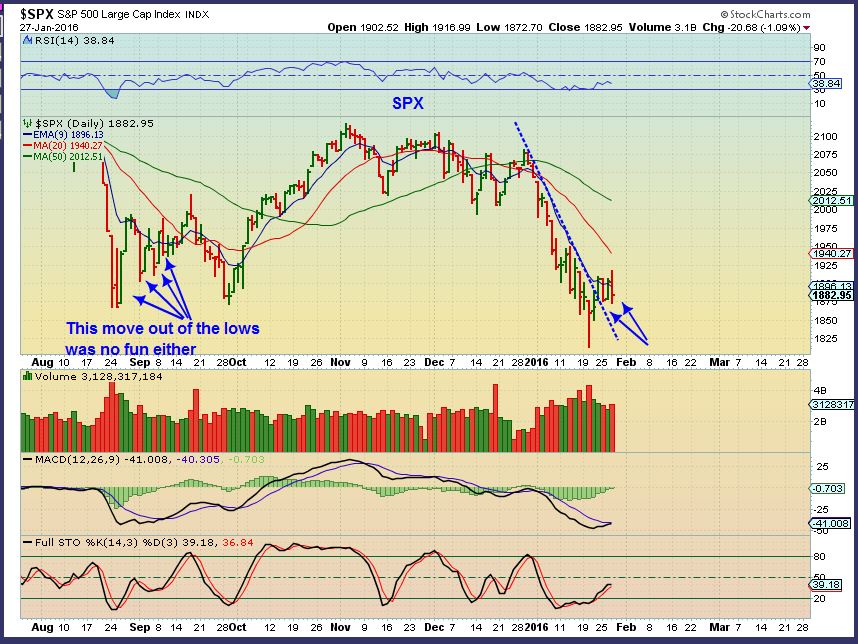
SPX Jan 27 - I pointed out that the drop mid week was normal, the same thing happened coming out of the August lows. I still expected a run higher.
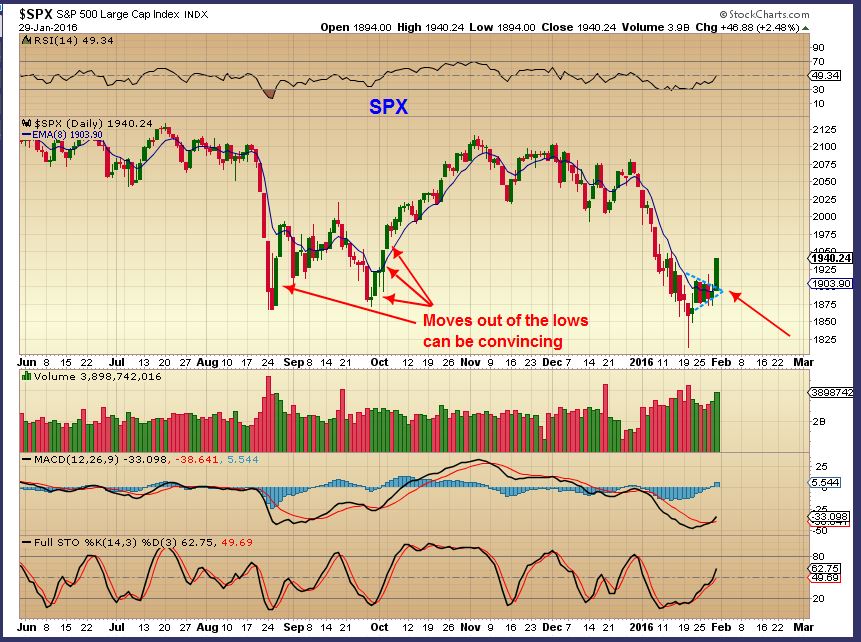
SPX Jan 29 - Friday we got our follow through.
Moves higher out of the lows can be convincing, but will it lead to a break to new highs in a bull market, or a bounce?
PUBLIC POST – PROGRESS
January 29, 2016 /2 Comments/in Public /by Alex - Chart FreakLets review the movement in various areas of the market that we at Chartfreak have been charting. We will look for Progress in what we have expected.
.
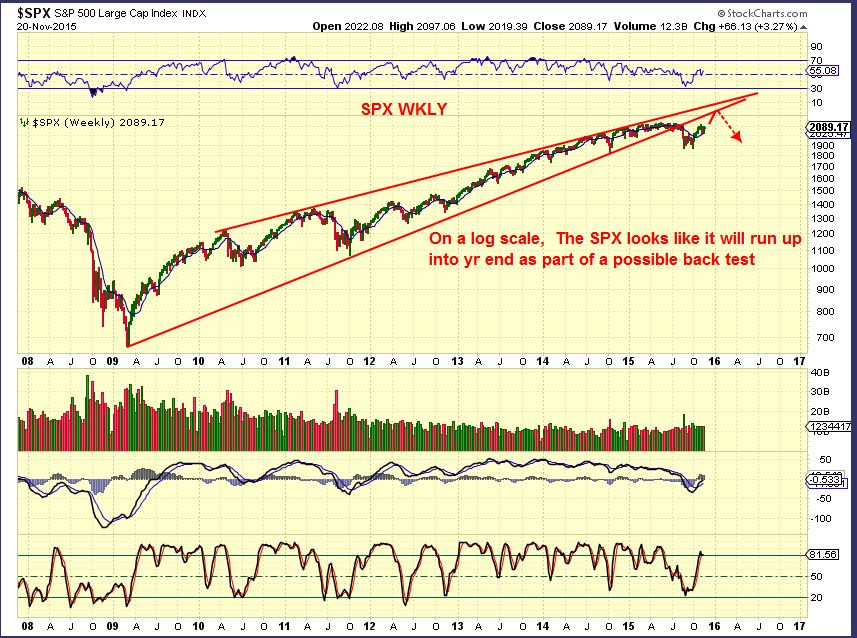
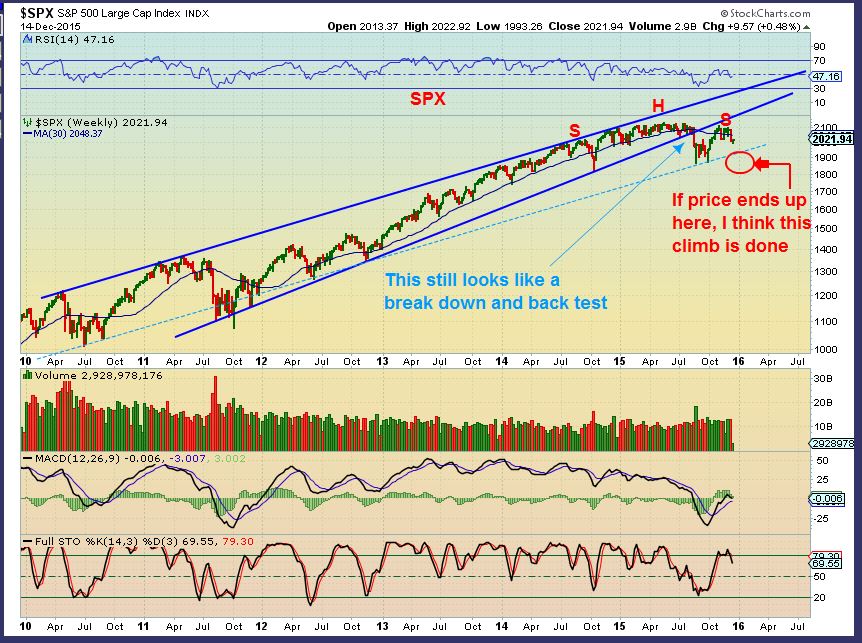
SPX Nov 20- We expected a back test and drop months ago when it seemed like EVERYONE was uber bullish
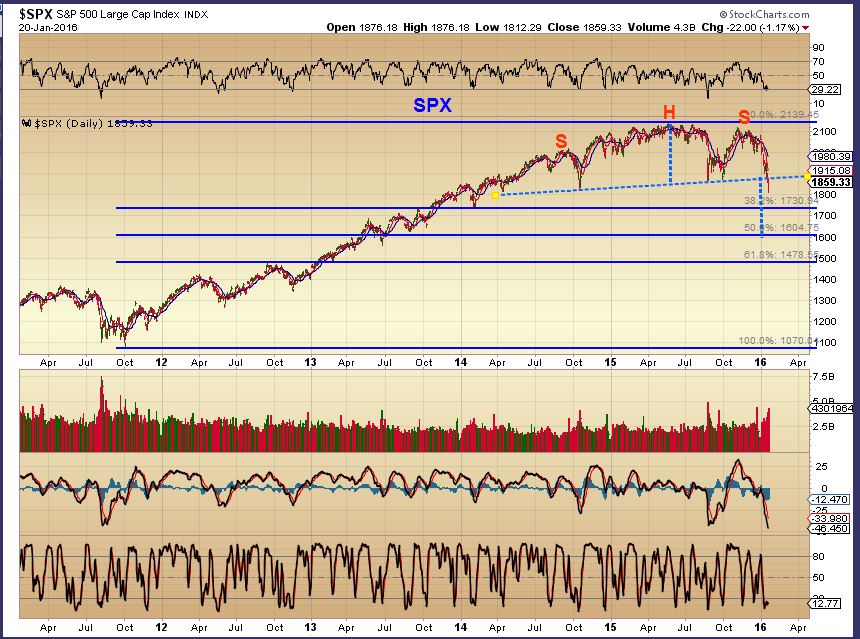
DECEMBER - H&S
Obviously we all know that January has been brutal for "longs', great for those "shorting". Is it over? Well I do expect a good size bounce soon ( multi week even) , but when everyone becomes bullish again, I'll be watching the downside ...
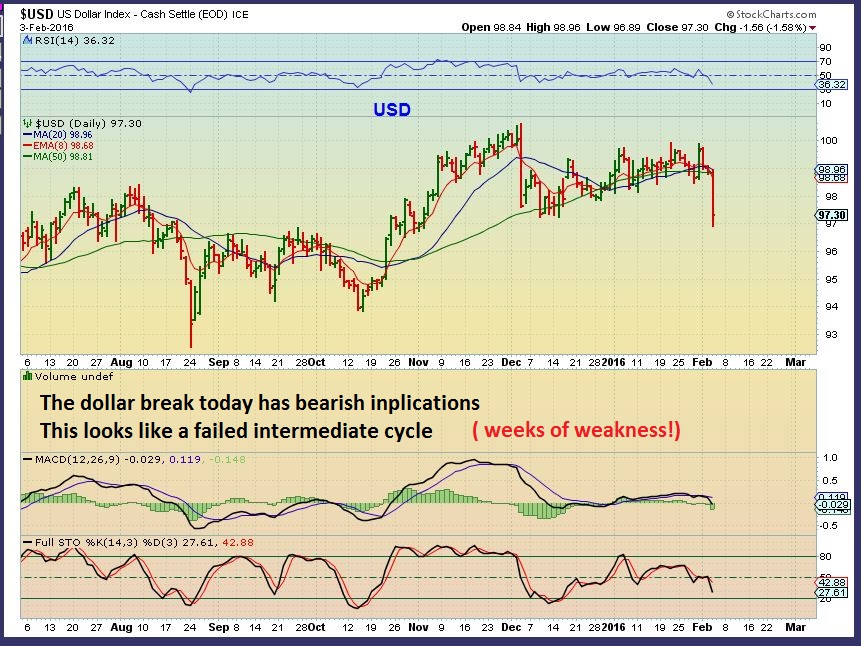
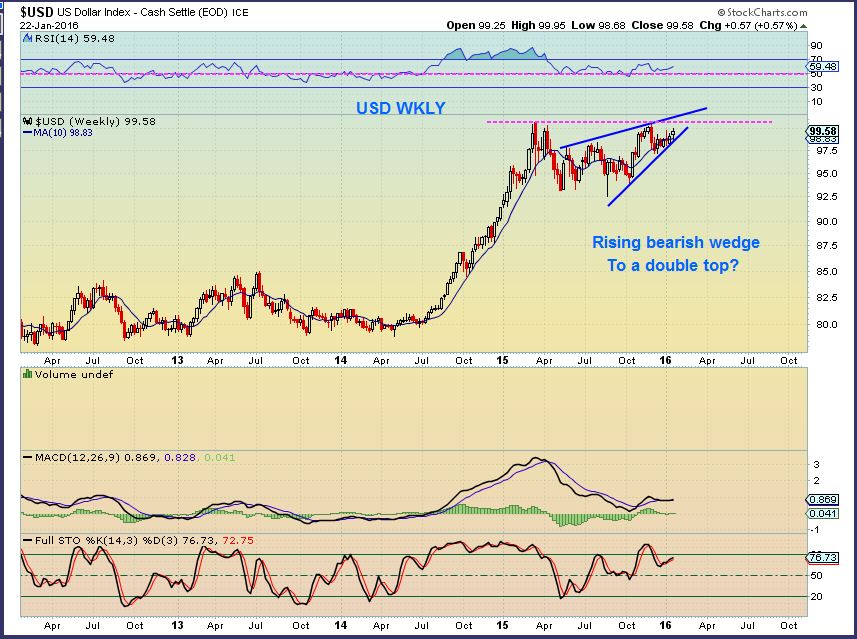
What about THE DOLLAR...
1-29-2016 follow Up
January 29, 2016 /27 Comments/in Premium /by Alex - Chart FreakI wasn't planning on a Friday report, but Thursdays action in several areas was important enough that I wanted to share a few charts. Also a reader ( we shall call him D.F.), pointed out an area of interest that I will touch on here too.
.
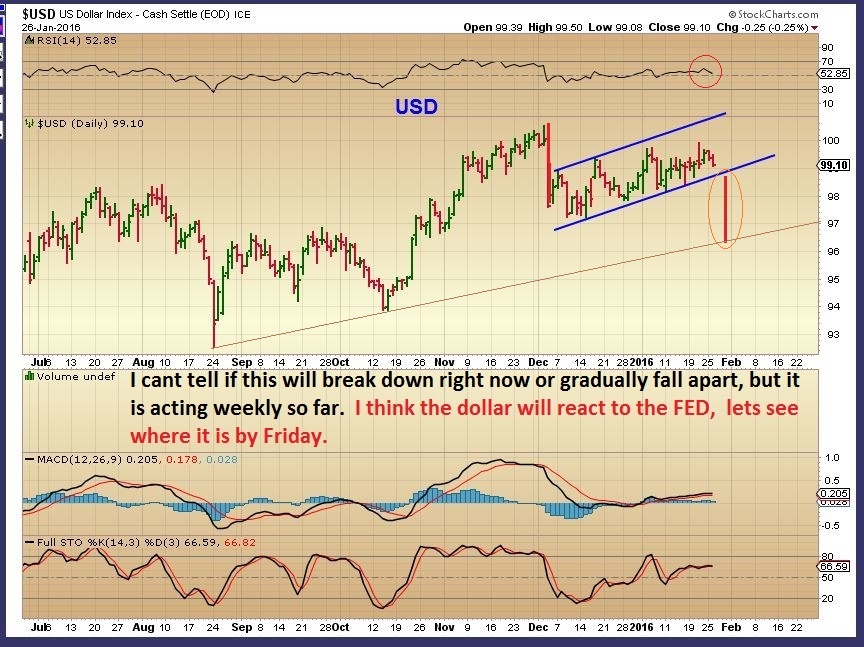
Lets start with the USD. I saw weakness and have been saying that I expect it to drop. I posted these charts last week.
We have been in Gold & Miners for a while now, but a weak dollar could help Precious Metals and Commodities further. I will cover this more in the weekend report , but for now, what did the Dollar do Thursday?
Dancing Markets
January 28, 2016 /45 Comments/in Premium /by Alex - Chart FreakThe markets are always dancing around on a Fed Wednesday, and often the volatility spills over into Thursday. Lets take a look at the charts and see what we can see.
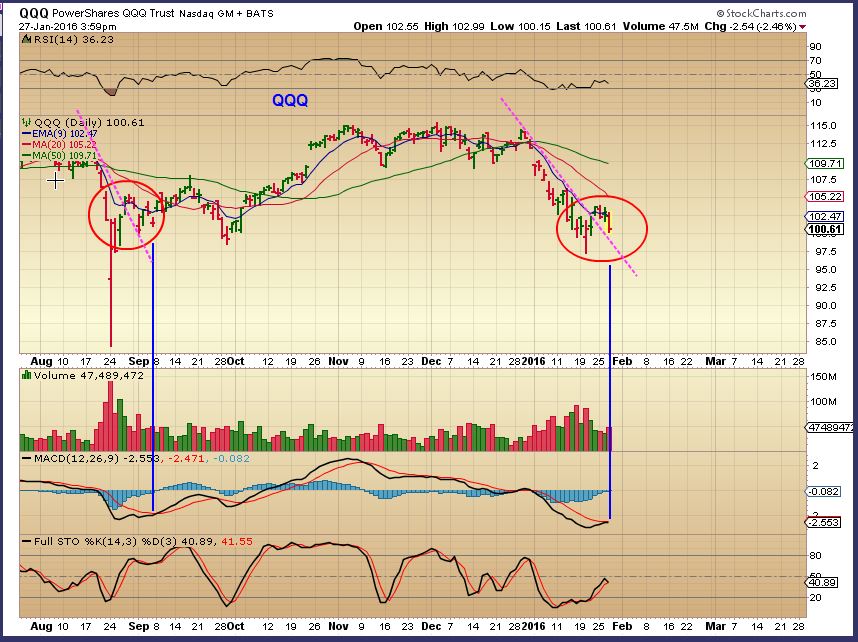
SPX - The markets sold off after the Fed Decision. I called for lows recently and I still expect higher prices to develop from a bounce. You can see that this is how the markets moved coming out of the lows in August too. I do not expect the recent lows to be broken, but a little more downside is not out of the question. Please notice how difficult it would have been to trade the Lows in August/ September.
That being said, the RUT / IWM looks like a bear flag, so lets look at a few other areas.
Lets look at the NASDAQ...
Contact Us
admin@bigleaguefinance.com
Latest Blog Posts
accelerator diet pills goji berry diet pills ultra 90 diet pills keto meal replacement bar top weight loss diet pills for thyroid patients where to buy t lite diet pills keto friendly thickener diet fuel diet pills peanuts keto friendly rite aid diet pills that work envy diet pills diet pills for breastfeeding moms belique diet pills perfect slim weight loss pills calories in a bottle of white wine

