Author Archive for: Alex - Chart Freak
Entries by Alex - Chart Freak
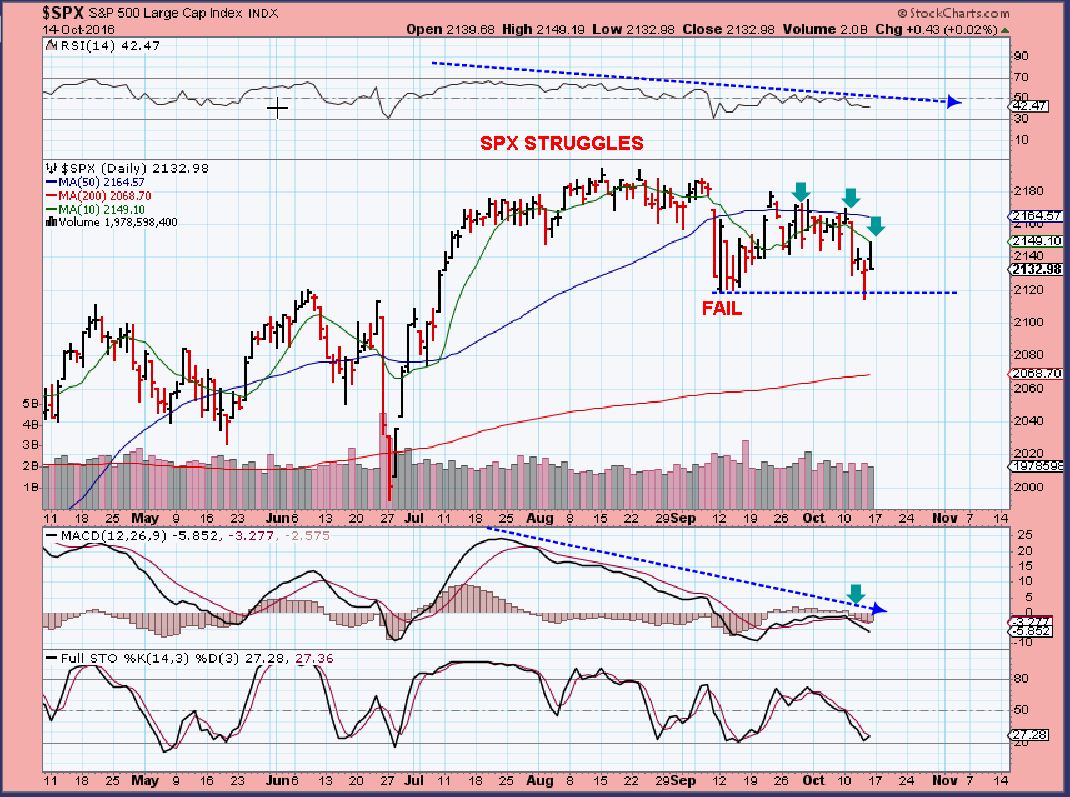
Slow Race To The Finish Line
The SPX ( Left Translated) dropped to break the prior lows and then put in a shake out reversal. It has struggled at the 50sma, and now that it faled, I expect it to roll over, possibly after tagging that 50sma again.
October 13- Still On The Hunt
When hunting for good set ups, just keep in mind that every day that passes brings us closer to the target.
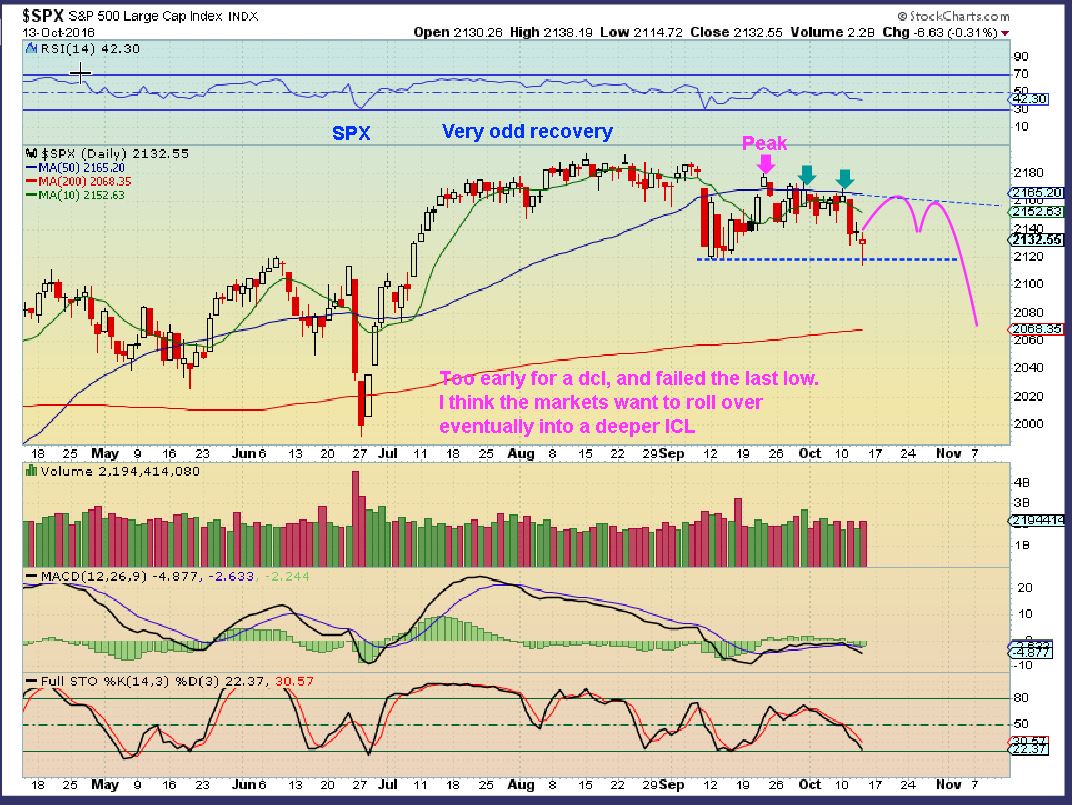
Release The Minutes!
The Fed Minutes are scheduled to be released today. At times like this, we sometimes get a glimpse of what was behind the recent decision on interest rates. Is inflation starting to creep in? Just how divided or united were the Fed members when it came to timing for rate hikes, etc. Lets take a look at the charts and cycles and see if we can glean some idea of what could happen after the Fed Minutes are released.
.
SPX - HMMM, This daily cycle peaked very early (day 8), and today is day 21. There are false break downs and shake outs in life, but this should be viewed as a warning sign. Why? I see a left translated daily cycle breaking down with maybe 10 more days to go. I see more room to drop on the stochastics, and a weak RSI. The Fed minutes could sink this ship or perform a miracle 'shake out' type move and a recovery, but this is a bearish set up the way I see it at this point.
Tired Of Waiting?
If you have been investing and trading for years, no doubt there are times that you find it is best to wait for that 'Fat Pitch', but not always so easy. Well the good news is, I can see that a real low risk buying opportunity is fast approaching, so lets discuss that again in todays report after a quick review of the markets...
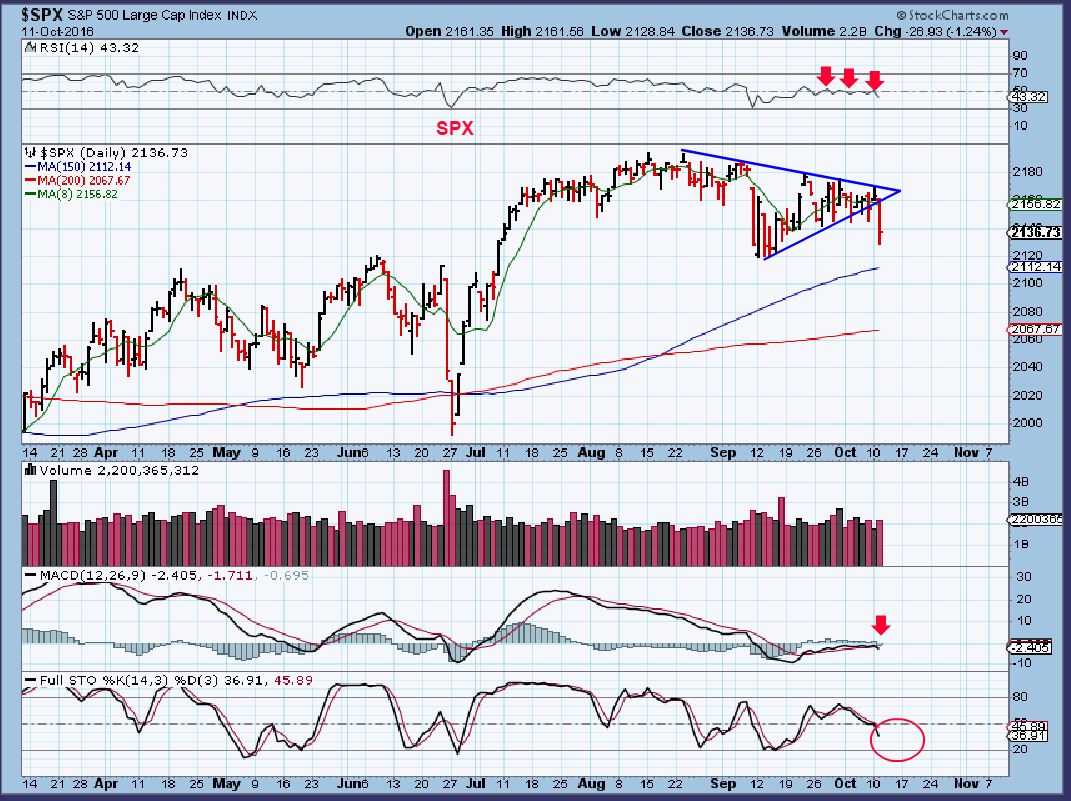
Gathering The Goods
Another week of choppy trading, but there is a lot to talk about this weekend. It may be time to start gathering the goods, so lets get right to the charts.
.
SPX - More of the same, Capped at the 50sma and L.T. ( left Translated) so far, it still needs to break one way or the other. Markets do not like indecision, and maybe this is what we get until after the elections. Please read the chart.
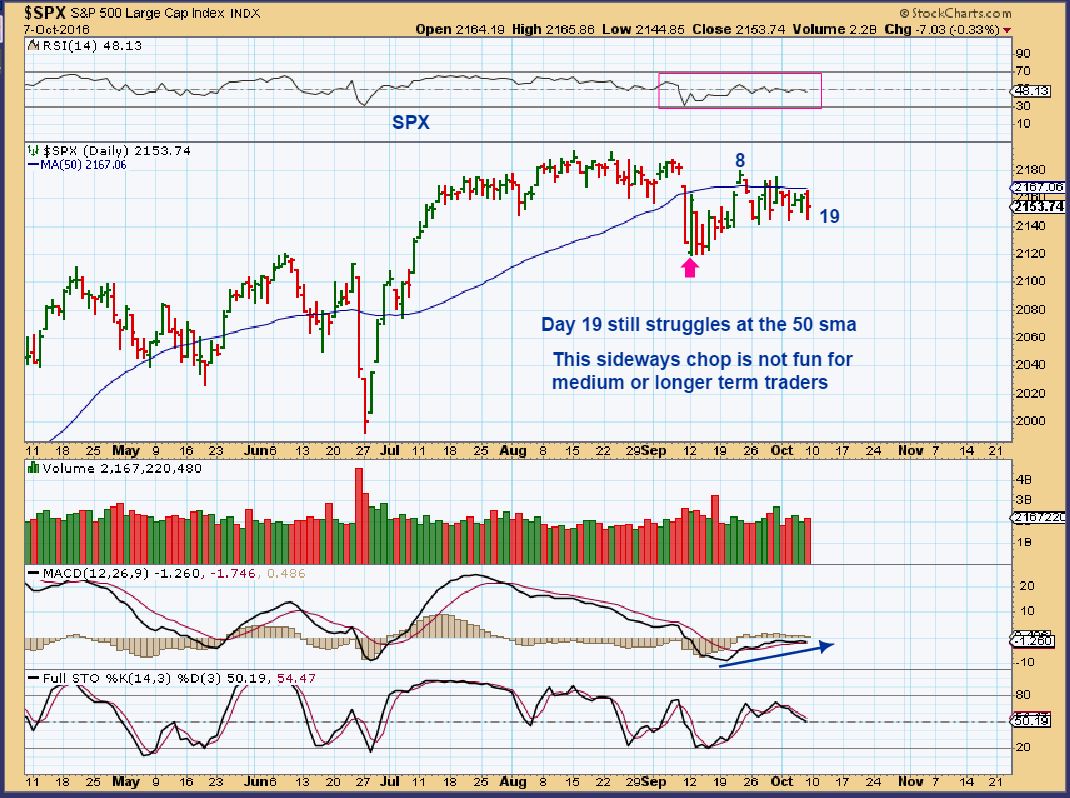
STILL WAITING – OCT 7
We are still waiting and maybe, just maybe, the Jobs report FRIDAY before the bell will act as a catalyst. Lets discuss why it would be great to see the futures in Gold higher before the market opens.
.
$GOLD - To start with, we have been expecting this type of a deep sell off since the summer. This is becoming deeply oversold, from the Brexit buying to this recent steady exit.
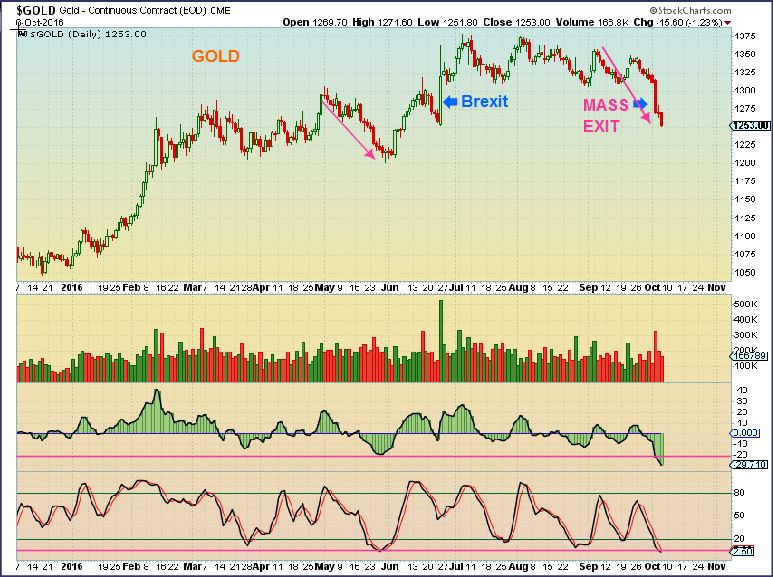
This is what I wanted to point out for Friday...
Oct 6th – A Closer Look
Today I want to take a closer look at Oil and Gold.
Read More
We Were Not Caught Off Guard
If you have been here for a few months, then you know that this is what we have been waiting for. Lets review.
.
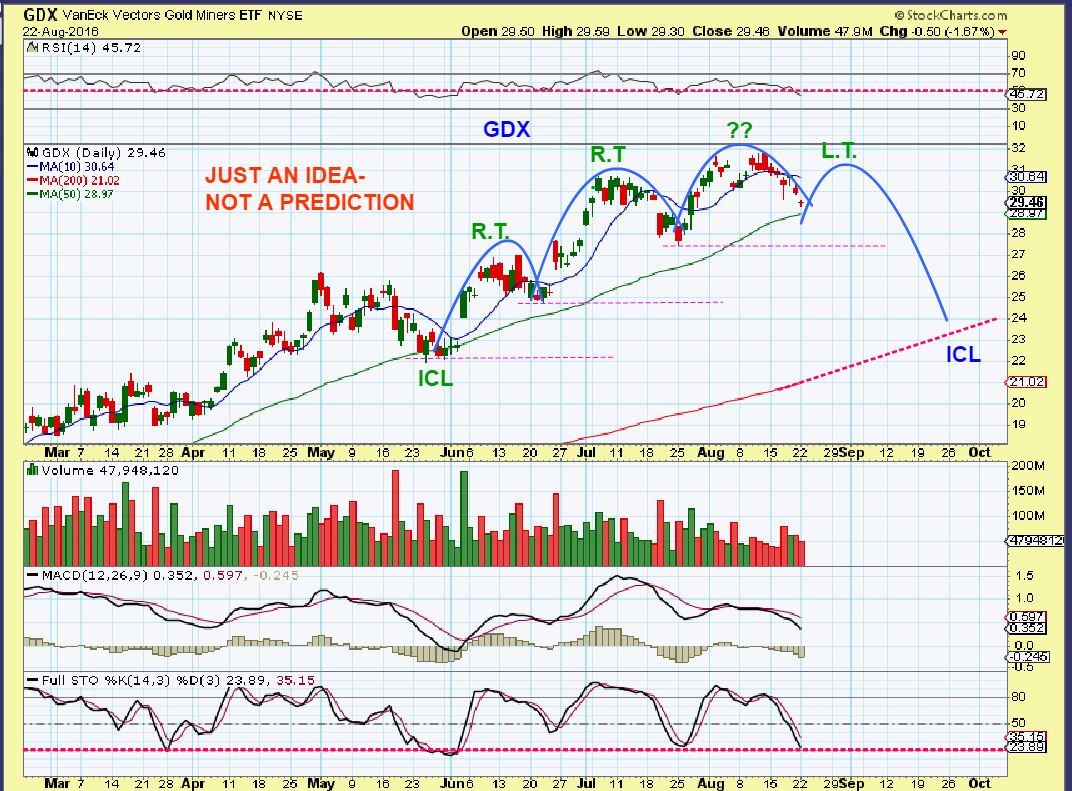
GDX - Way back in August I started to ready us for a deeper pull back than many at that time would think is likely. You may recall that I kept saying that a solid target was $22-$24 and I said to look for that steep drop at the end of September or beginning of October.
This chart from Aug 22 is an example of me preparing us for a coming buying opportunity. I expected a bounce first, then a steep drop.
My Weekly chart showed GDX broke the weekly uptrend line. A wkly trend line break for an 8 month trend is 'ugly', and indicates that a yearly cycle low is coming. That magenta box became the likely target after that bounce at $22-$24 shown in Sept/ Oct. We would monitor things a little closer when we got there.
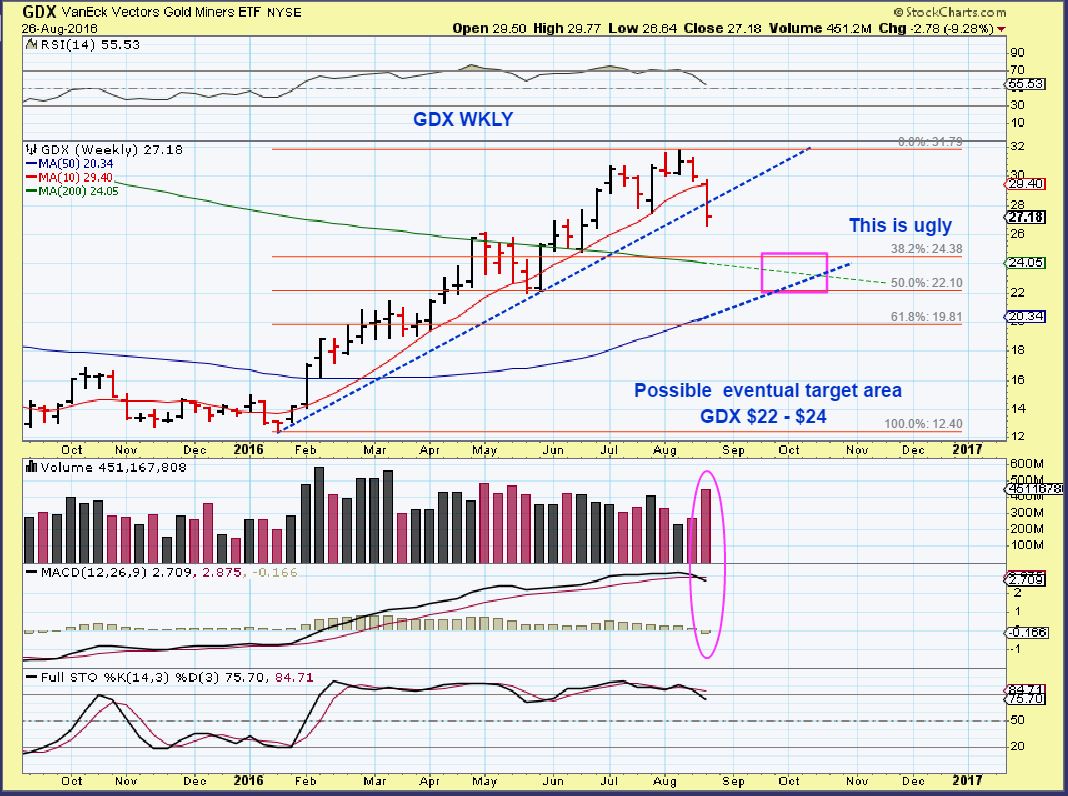
We are there, time to monitor things a bit more closely. 🙂
GOLD & ENERGY OPPORTUNITIES
Our recent weeks of trading have had a lot of choppy sideways action, and this gets frustrating to both the longs and the shorts. My premium reports discussed how that choppiness was ending in Oil, and we began looking at buy set ups forming in the energy markets. I wanted to share my thoughts on […]