Author Archive for: Alex - Chart Freak
About Alex - Chart Freak
I’ve been a full time trader for well over a decade and began trading in the late 1990s while working in management and sales at a well-known aerospace company. As my style evolved, so did my success, and it allowed me to leave corporate America to pursue my passion and trade full time.
Entries by Alex - Chart Freak
10-24th – The Latest Developments
October 24, 2018 in Premium /by Alex - Chart Freak
The selling continued in the stock market, but there is a recent development that I mentioned we should look for.
.
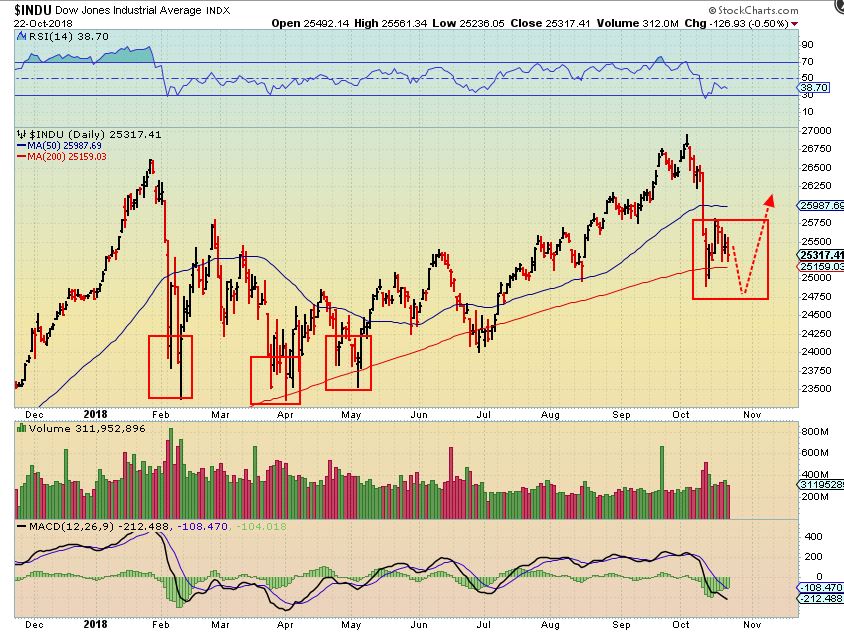
DJIA - Yesterday I used this chart and mentioned that we could look for a possible double bottom low, or 'W'-Bottom with divergence. You see it at other Lows formed this year.
Tuesday the DOW dropped over 500 points and broke below the 200sma as a possible shake out / reversal.
1. It is safer to buy a swing low confirmed above the 10sma, as you can see, the last swing low 2 weeks ago failed at the 10sma. However...
2. For higher risk traders using technical analysis, That low can actually be bought with a stop below yesterdays lows, but keep in mind...
OCT 23rd – Public Market Review
October 23, 2018 in Public /by Alex - Chart FreakI am opening up today's report to the public. Enjoy.
.
Nothing has really changed since the weekend report. The markets have been choppy and difficult to record any gains over the past few days, but I do love the way the Precious Metals sector acted yesterday, so let's take another look at what we have.
.
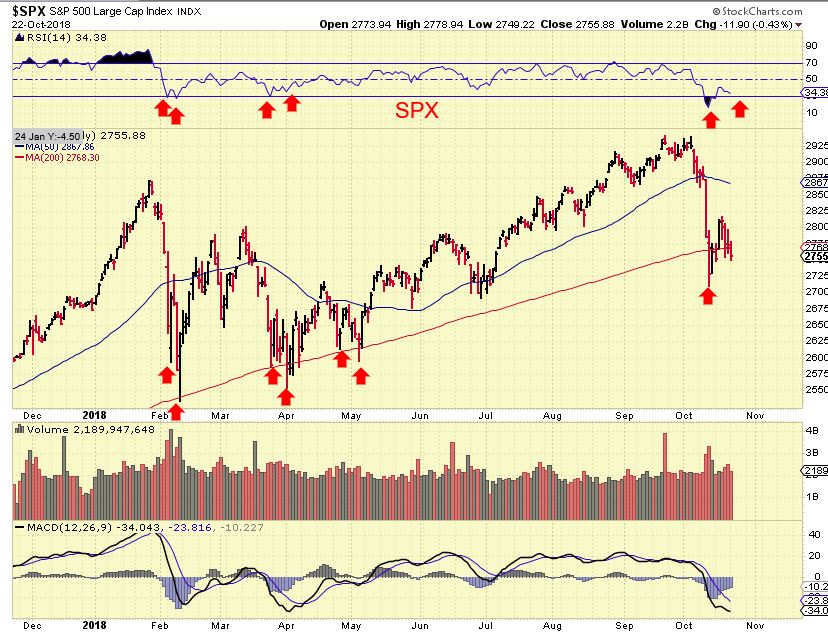
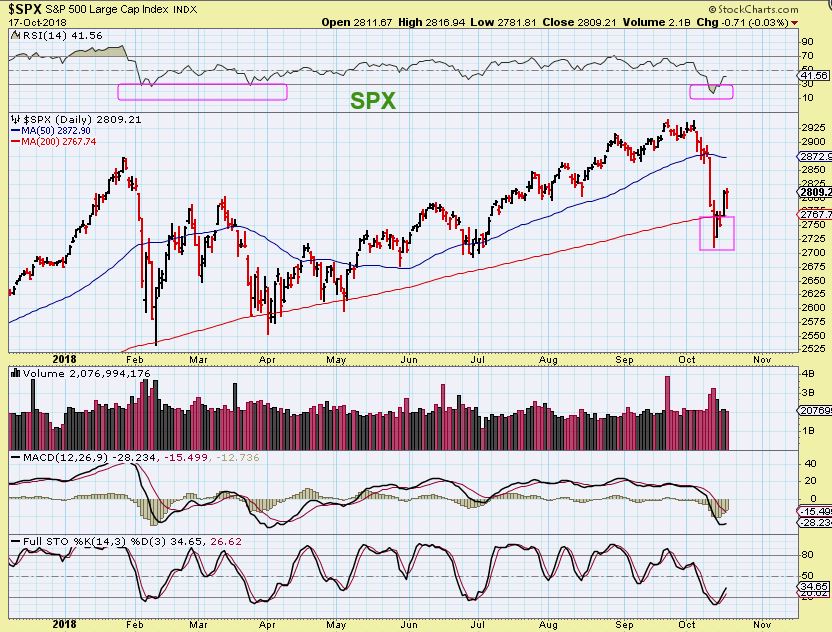
SPX - You can see that these types of sell offs into an ICL can lead to a double bottom, and Monday our General markets sold off further.
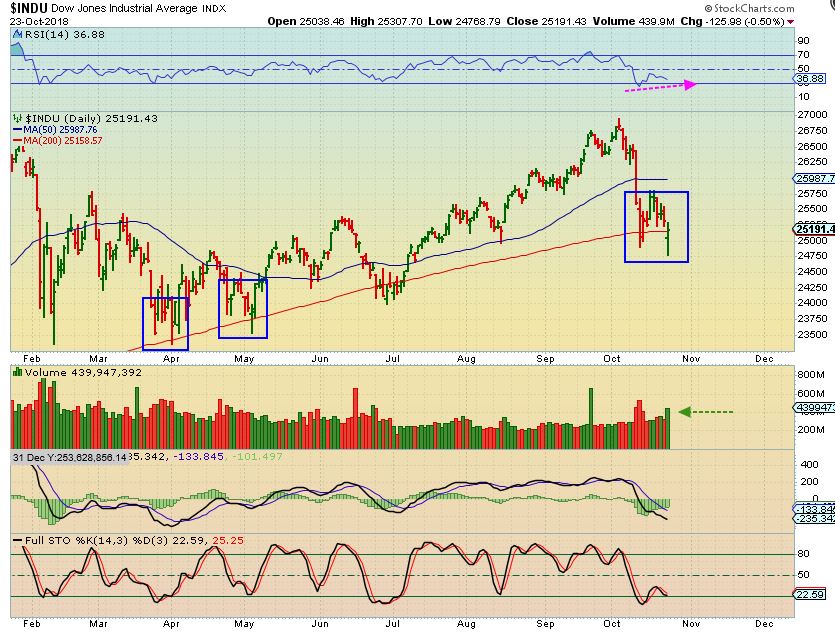
DJIA - You may want to look for something like this
HOWEVER....
Tuesday October 23rd
October 23, 2018 in Premium /by Alex - Chart FreakNothing has really changed since the weekend report. The markets have been choppy and difficult to record any gains over the past few days, but I do love the way the Precious Metals sector acted yesterday, so let's take another look at what we have.
.
SPX - You can see that these types of sell offs into an ICL can lead to a double bottom, and Monday our General markets sold off further.
DJIA - You may want to look for something like this
HOWEVER....
October 20 Weekend Review
October 20, 2018 in Premium /by Alex - Chart Freak
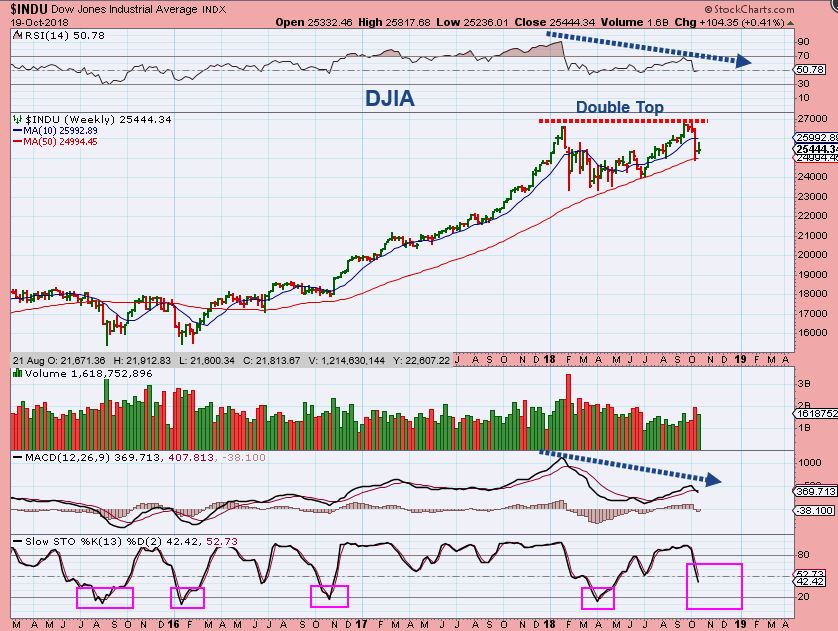
DJIA - I can't say with certainty whether this is a long term double top or not, but it has played out as a short term double top. We were expecting this drop into an ICL for weeks . Look at the strong bearish divergence on the MACD & RSI on a weekly basis. I've discuss in my daily reports what to expect going forward.
Friday Oct 19th
October 19, 2018 in Premium /by Alex - Chart FreakI love Rocky Road Ice cream, but Rocky Road Trading? Not so much. My last few reports have mentioned that even though we do have a 'low risk entry' for Buying at a swing low in the General Markets and some other areas, stops are a must. It is not a confirmed swing low, and we have volatility and choppiness, so buying the swing doesn't necessarily mean that it will be an easy ride.
In fact, yesterdays report was entitled : 'It Is Still A Rough Ride.' Going into the last day of trading for the week, lets review Thursday and see if this proved true.
.
Yes, it proved true - The Dow was down over 399 points and the NASDAQ was down 184 when I captured this in the afternoon...
.
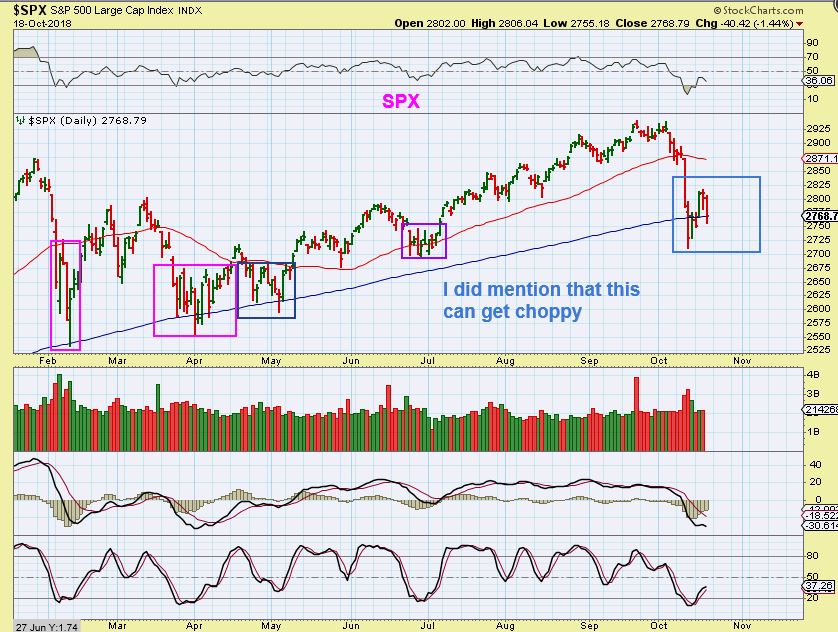
SPX - I also mentioned that similar to February and March, things can be choppy around this 50sma, even with a swing low in place.
Top Notch Tops – Strategy Tips
October 18, 2018 in Public /by Alex - Chart Freak(The images below are a sample of Alex work and are to provide a little education on understanding tops in a market or asset)
Like most things in technical analysis, spotting a top is as much art as it is science. When you see a top, it doesn't mean it is time to run for the hills, take all your positions off the table, hyper leverage shorting the market or throwing computers out of windows. NOPE! It just means you need to be extra cautious with your trades, you probably should take some profits, de-risk most of your positions, tighten stops and don't take on long positions on a large time frame.
Here are some clues that the market was likely to experience the sharp sell-off we experienced last week.
(From 10/13/18)
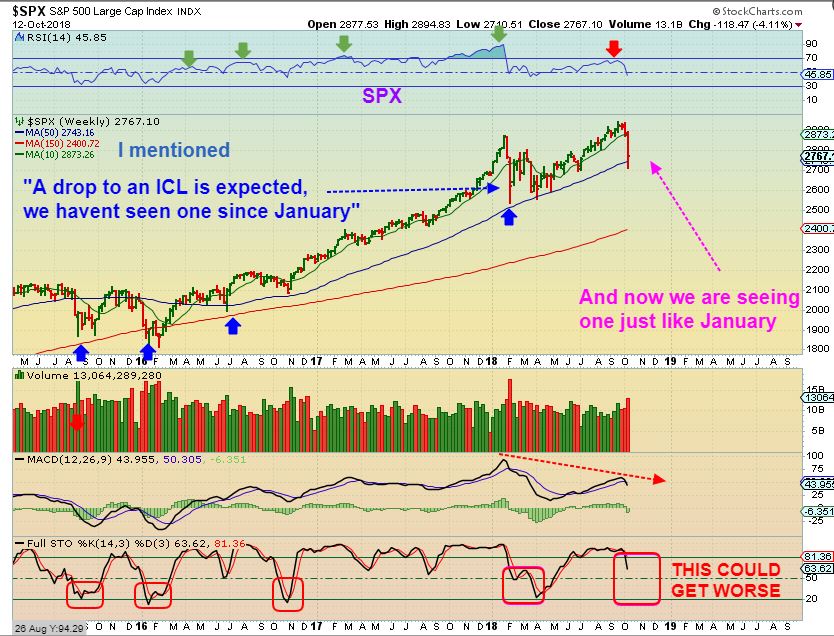
SPX WEEKLY - I've been looking for a drop into an ICL , similar to January. There it is, read the chart, and there is more..
October 18th – It’s Still A Rough Ride
October 18, 2018 in Premium /by Alex - Chart FreakThe release of the FOMC Minutes really didn't seem to have any meaningful or lasting reaction in the markets. It may have added a little knee jerk reaction or volatility, but overall there was no big directional change. Let's take a look at our markets, and again, there really are no major changes from yesterdays report to discuss, but we'll still review what we have...
.
SPX - I have been looking for a steep drop and an ICL. We have that steep drop and a reversal after the 200sma was taken out, so this could be a shake out. It is a swing low, and yesterday I said that this could be bought ( TQQQ or UPRO, etc) however...
September 17 – Slidiing
October 17, 2018 in Premium /by Alex - Chart FreakNote: FED MINUTES are released at 2 p.m. Wednesday.
.
The General Markets stopped sliding, yet 1 day before medical & recreational marijuana is to be legalized in Canada - Pot stocks decide to slide. Is it going to be the typical "Buy the rumor, Sell the news? " in that sector? Is the rally over? We'll take a look at that too. Lets take a look at the market action...
.
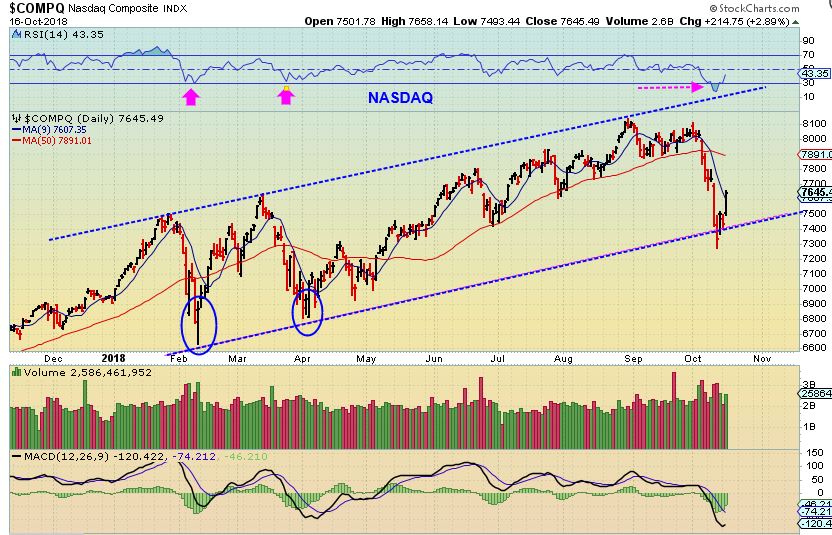
NASDAQ - This ICL drop was steep and broke the RSI below 30, unlike the Feb & March drop. This reversal could be bought at a low risk low, but ...
Tuesday- Things Are Looking Good
October 16, 2018 in Premium /by Alex - Chart FreakThe weekend report covered the Big Picture, so today will cover some of Mondays action and what we can expect from there...
.
Contact Us
admin@bigleaguefinance.com
Latest Blog Posts
accelerator diet pills goji berry diet pills ultra 90 diet pills keto meal replacement bar top weight loss diet pills for thyroid patients where to buy t lite diet pills keto friendly thickener diet fuel diet pills peanuts keto friendly rite aid diet pills that work envy diet pills diet pills for breastfeeding moms belique diet pills perfect slim weight loss pills calories in a bottle of white wine

