
The Bigger Picture Outlook
I have been asked what my Long Term Outlook is and has it changed after The Fed discussed their plans going forward. I usually discuss the Big Picture in my weekend reports, and I cover short & medium term trades and ‘stock picks & set ups’ in the daily reports, so I have decided to release last weekends Big Picture Weekend report to the public.
Enjoy!
Note: It is wise to be flexible and unbiased when you look at a long term outlook, since things can change with time, but so far things are pretty much playing out as expected. We called for the stock market Drop that actually turned into a full blown crash, and we also caught the lows in various sectors. From here we watch how price unfolds coming out of those lows, and this is where we are currently…
.
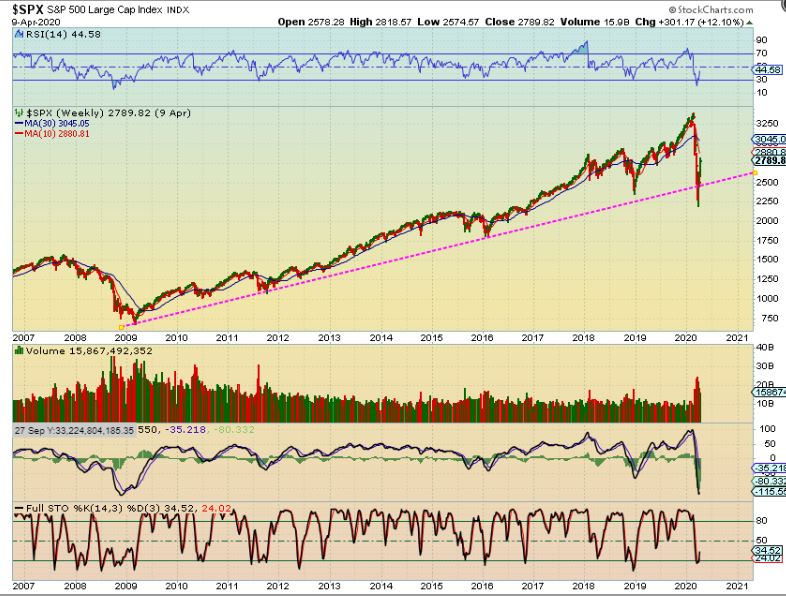
SPX – We have discussed our long term breakdown & Recovery ( Shake out), and …
.
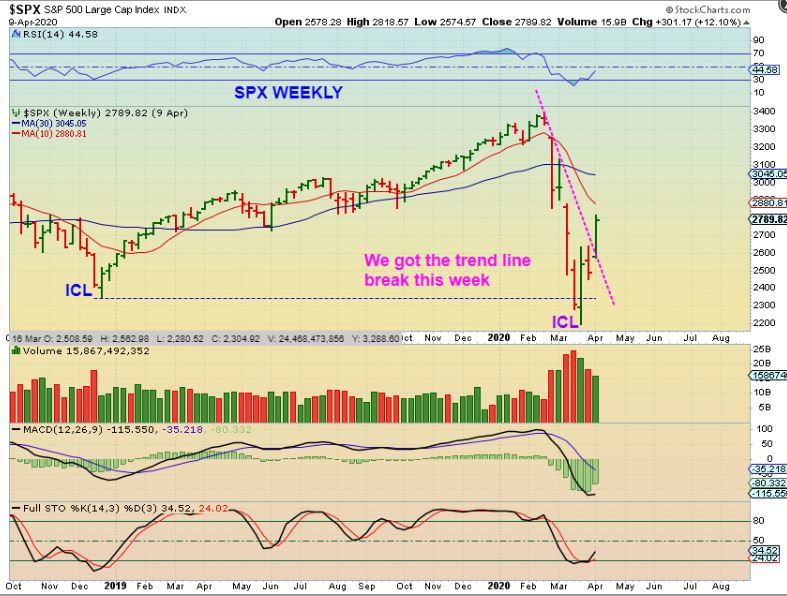
Now it has been determined that we have an ICL in place. SOXL & TQQQ were purchased right at the reversal. The trend line that I pointed out last weekend was broken this week. Is this a recovery in progress or just a bounce?…
.
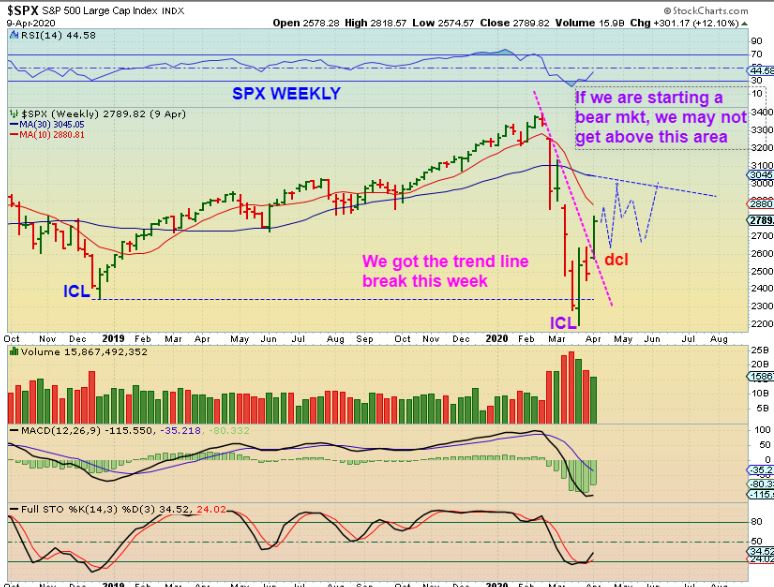
SPX – Now we watch it step by step, to see what kind of an ICL is in place. One that is a recovery going forward ( I feel that may be less likely) or is this just a multi week bounce that gives us several weeks of bullish looking action before it rolls over? Either way, there should be more time in the bounce / rally…
.
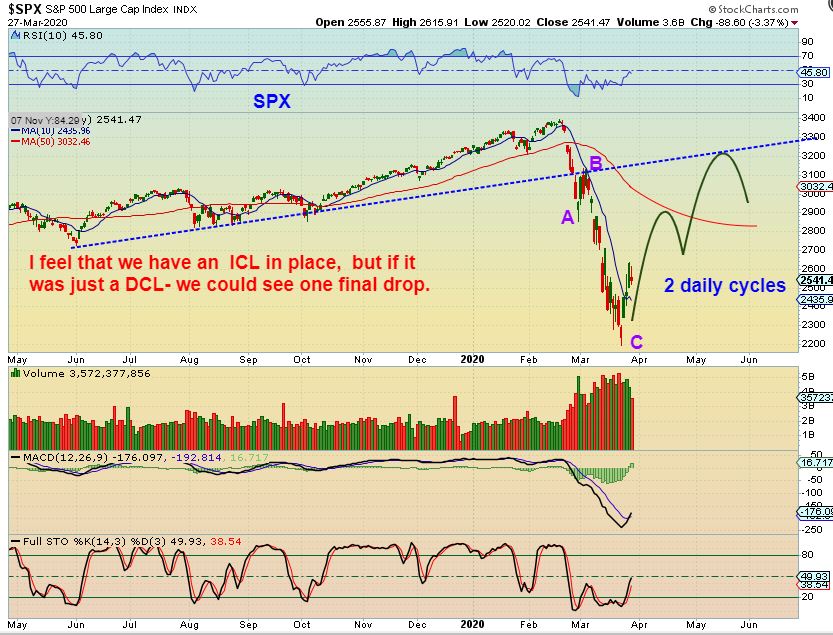
As we moved out of the lows in March, I drew this chart as a reasonable expectation of at least 2 daily cycles higher. IT IS NOT EXACTLY A PREDICTION, but it’s an example of 2 bullish daily cycles, and then a possible resumption of the selling down. At that point, we will look for signs of weakness, and I will remind everyone that as bullish as it may look …
.
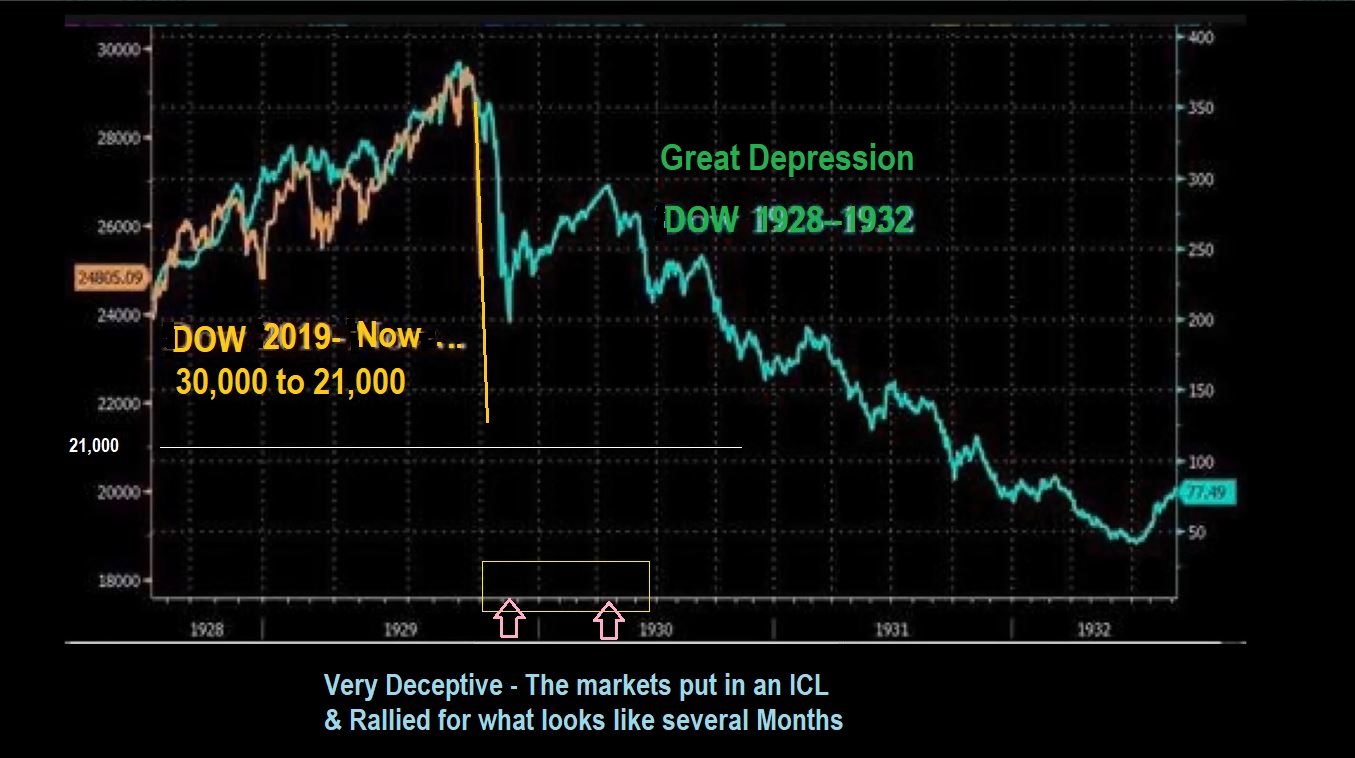
As bullish as a multiweek rally may look…
.
The rally out of the 1928 sell off looked very convincing too. It lasted for 3 daily cycles & then sold off to a bear market. The YELLOW LINE is our current crash compared to that 1929 crash. It was followed by a strong rally—that died.
.
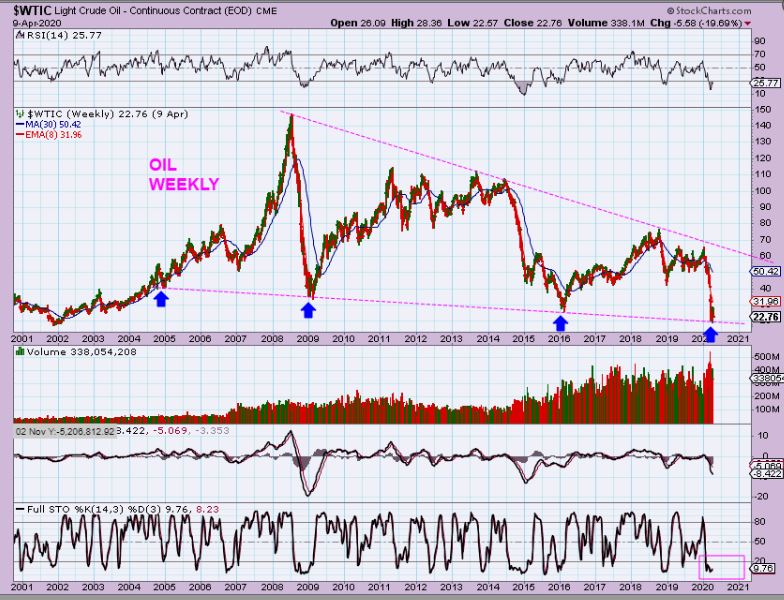
WTIC – Oil was due to put in the DCL / ICL too, and at this point, we at least have a dcl. Oil is just starting to bounce, it is Very Oversold on a weekly basis. This could be OILS LOWS.
.
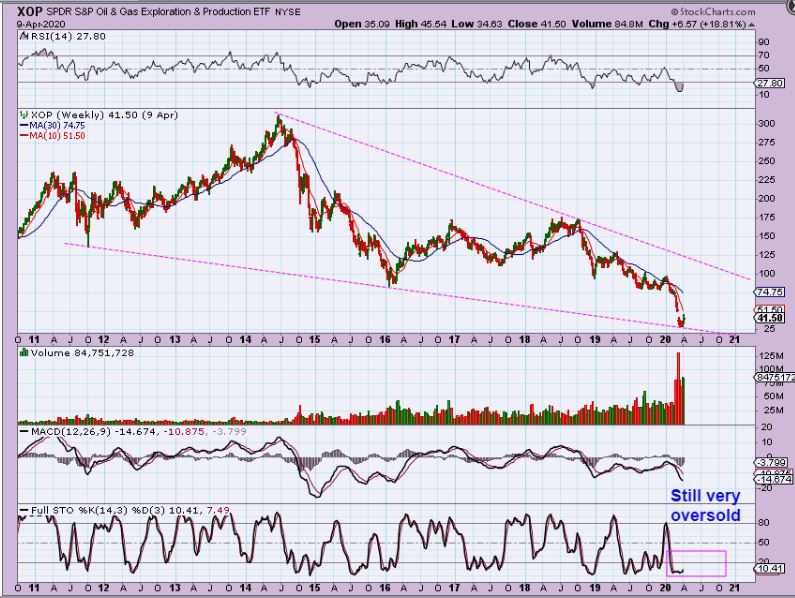
XOP – The Energy stocks are making incredible gains. Even the XOP made a 20% gain last week, and some of the beaten down Oil stocks are up 100% off their lows. I have been covering them in the daily reports, trading stocks like PVAC, APA, MRO, OKE, VLO, etc. Gains have been good, but very volatile trading.
.
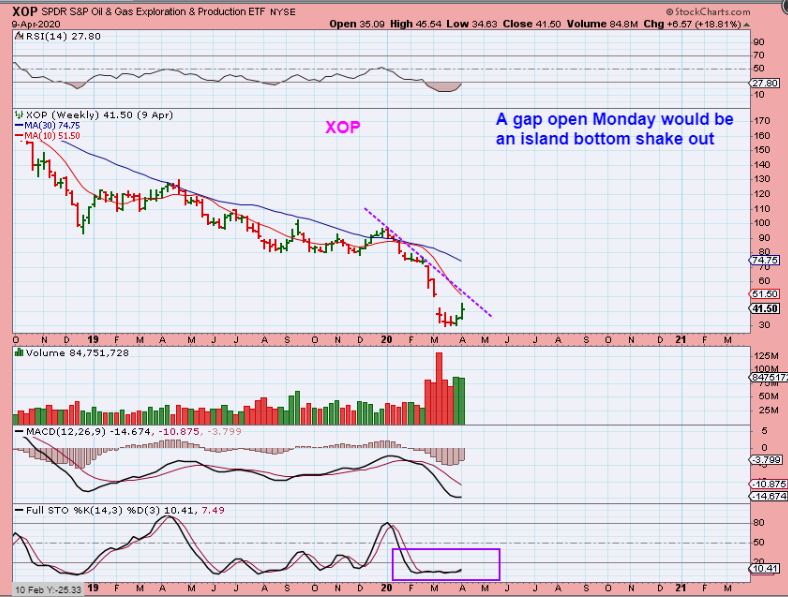
XOP – This is a trend line that, if it gets broken, will help us to gain more conviction in the idea that these lows will last for months ( ICL). This sector remains VERY oversold ( purple rectangle).
.
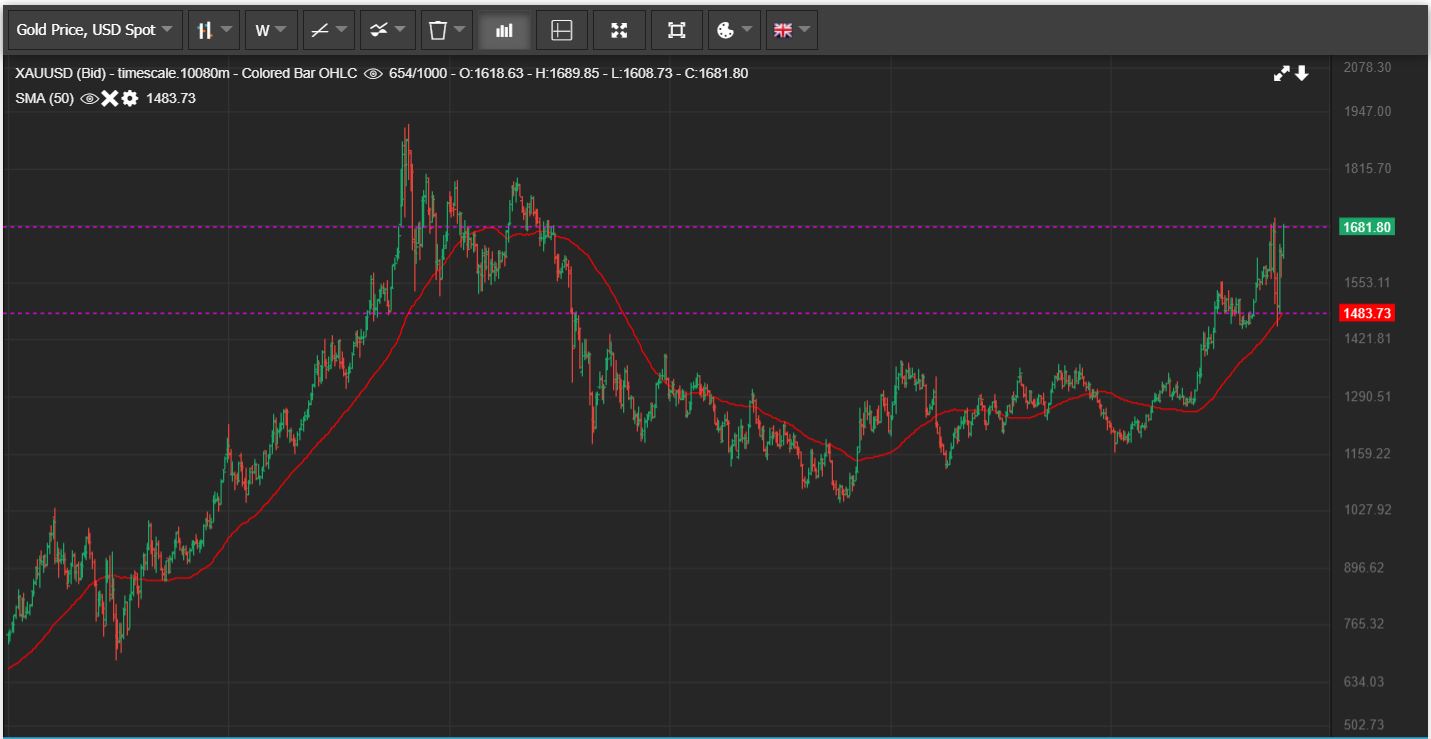
GOLD crashed into an ICL and has now returned right back to the highs. This is very encouraging, because some Miners are now returning to their prior highs and others are beginning to play catch up. We can make GREAT %-Gains in this area in 2020.
.
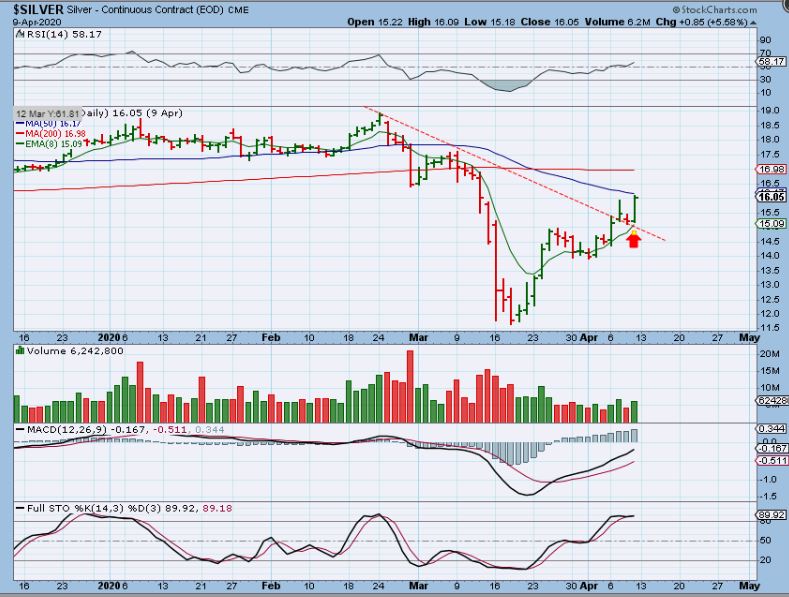
SILVER was lagging behind Golds recovery, but it can and does often play catch up Very Quickly. This is bullish and shows that an ICL is in place too. This is also very good news for you, because many Silver stocks that were lagging now gained 10-20% Friday alone, but they still have a lot of upside potential. I’ll discuss that later.
.
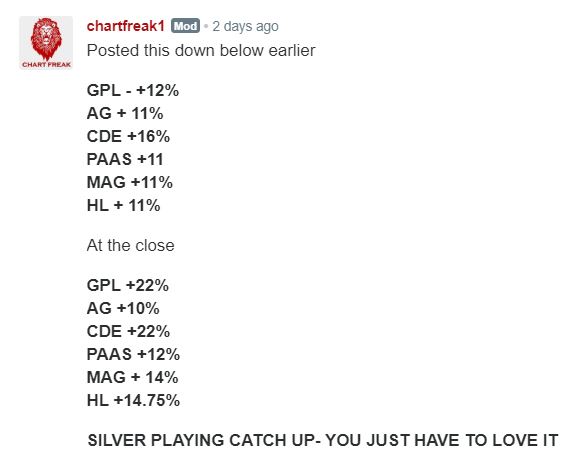
For example, I posted this in Fridays live trading area. One was posted in the morning, the other at the close. These are EXCELLENT one day gains for us, and this can continue.
.
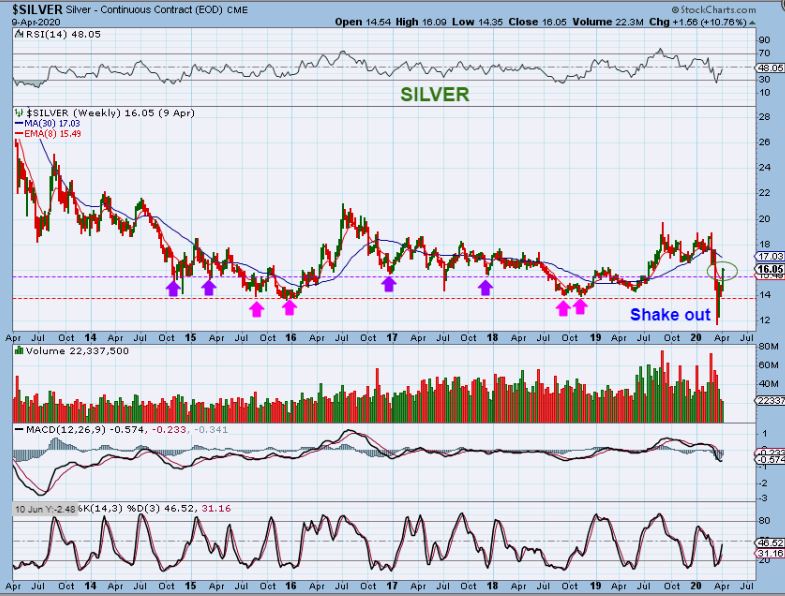
SILVER -This is Silvers recovery process and it made good gains last week. Notice that Silver is still near oversold on a weekly basis. Silver has room to move much higher, so the stocks can really add to their recent gains.
.
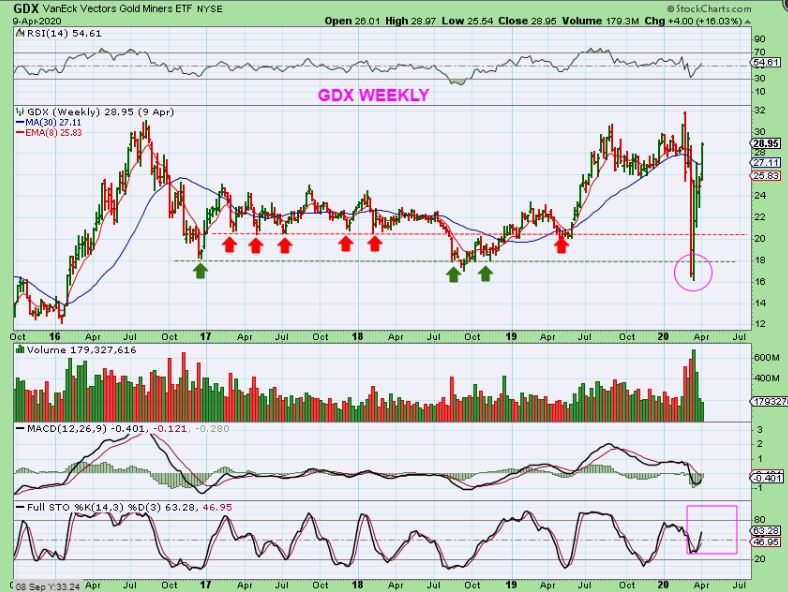
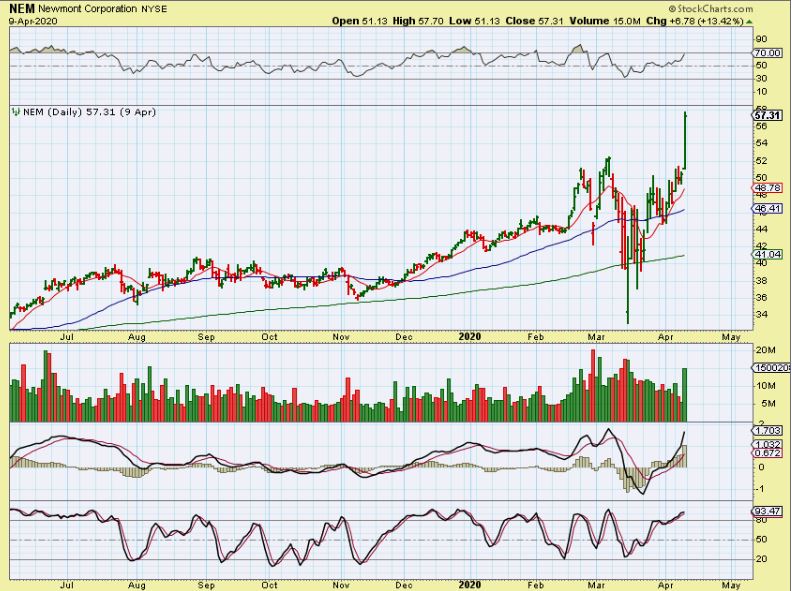
GDX -Talk about a bullish recovery. We had ‘Rail Road tracks’ and then I started to point out and recommend Miners in the reports over the past couple of weeks. Some are ahead of the others, but now they are pretty much ALL making great gains. NEM is back at the highs. GDX is also still not overbought on a weekly basis. I want you to know…
.
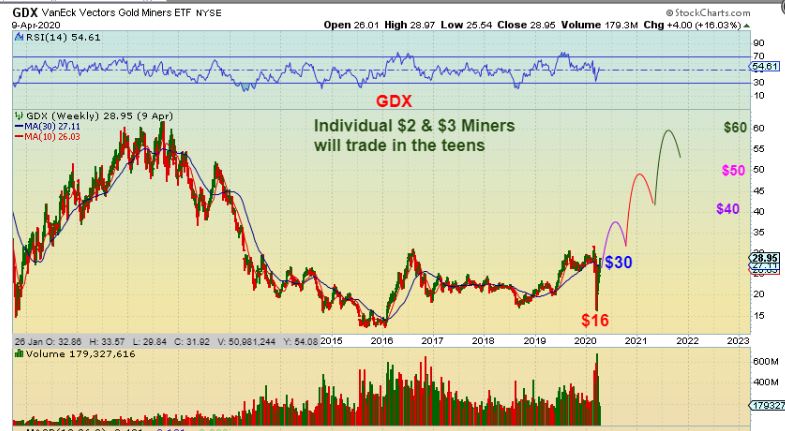
I want you to know that this can get VERY rewarding over time. This is NOT an exact prediction, but this is a visual idea of how bullish this could get. I will cover it day by day in the daily reports.
.
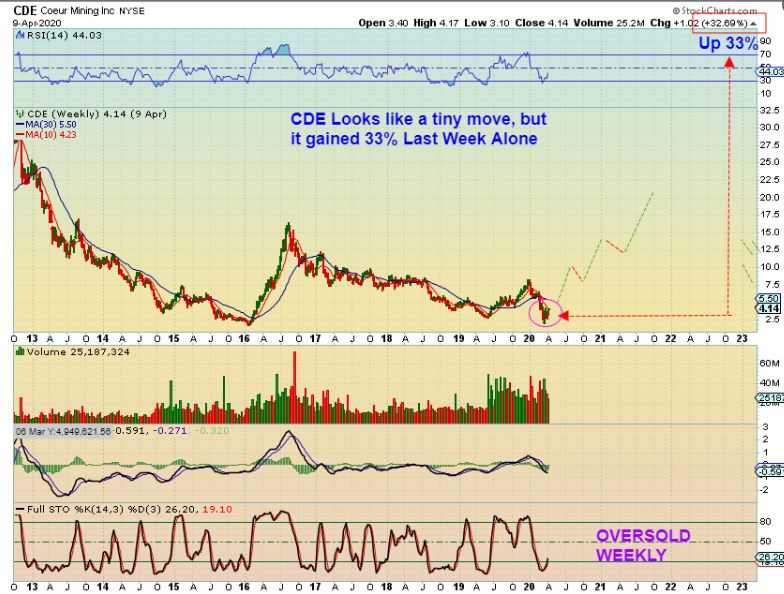
As an example of the potential: CDE gained 33% last week, but on this chart it looks like it hardly moved, compared to where it is likely heading. Can you imagine owning a $3 stock now and then having it trading in the $20’s down the road? Look at CDE in 2016, and that shows the potential with the current double bottom low set up.
.
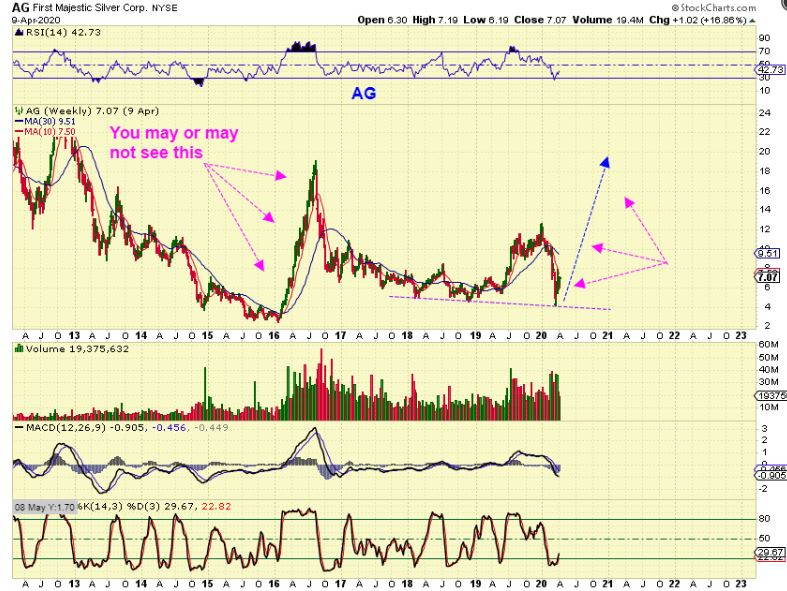
AG – A Silver company like First Majestic could snap right back when a flood of value buying comes in, or it may just chop higher, but either way the potential is very good. The weekly chart is still at oversold levels after gaining 17% last week.
.
This past week was great for traders and investors alike. We saw DCL’s turn into confirmed ICLs, so we know that we should be able to expect those lows to hold up for weeks. We often see at least 2 daily cycles higher, even in bear markets. I always take it step by step in the reports, but at this point I feel that it is safe to say that Miners are set up for higher price and it looks like it could be in more of a sustained manner.
.
NEM was already back at recent highs as a leader Friday morning, and after gaining 13%, it was now well above the recent highs. There should be some good gains ahead as these play ‘recovery & catch up’ from a sell off that now seems to just be a Massive long term shake out.
.
I held on to my Miners and Energy stocks going into the weekend. I have had stock picks in the weekday reports, but I will also discuss a bit more about Miners below for your Monday trading too. Miners confirmed an ICL.
.
Enjoy your weekend and thanks for being here at Chartfreak!
.
~ALEX
.
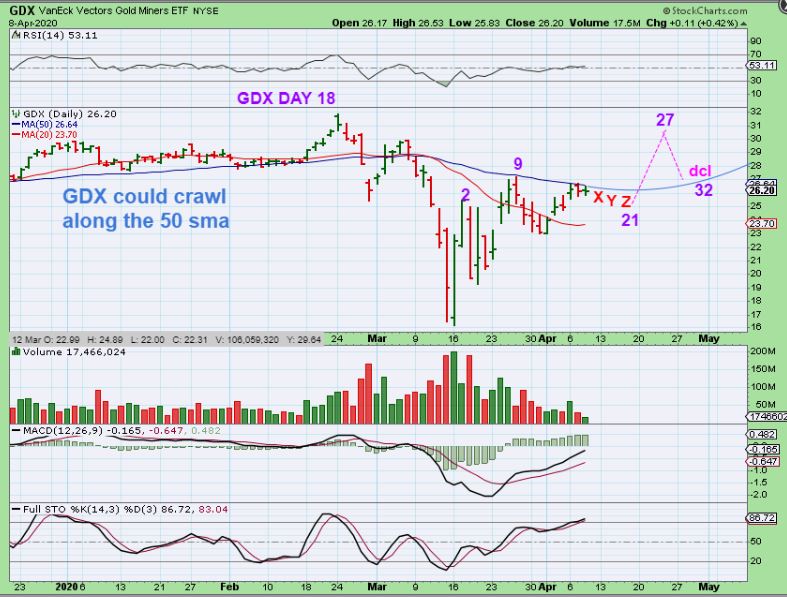
This Was Thursdays Chart:
GDX has been stalling & crawling bullishly under the 50sma. We have seen price crawl along resistance in the past, and with GOLD at the highs, we would expect this to PUSH THROUGH before the end of this daily cycle. I have drawn out a bullish possibility ( just a guess on the count, not an exact prediction. Also day 9 should be 8).
.
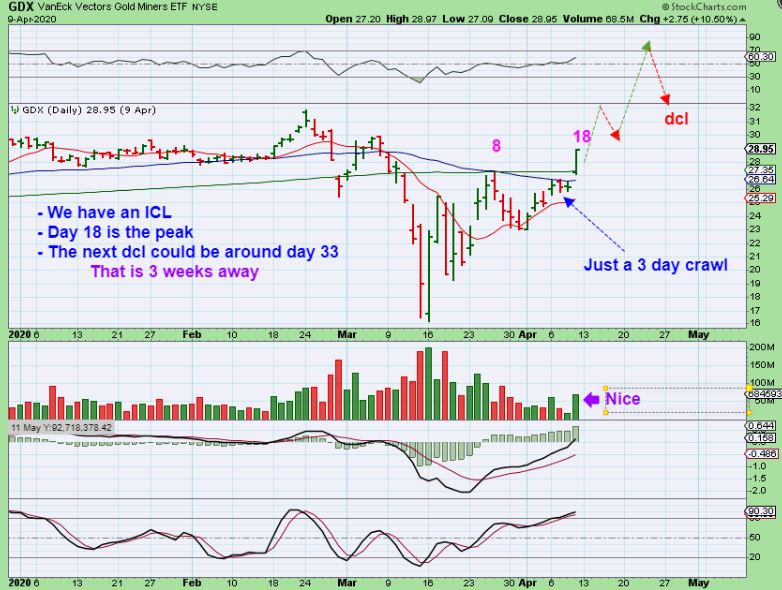
The crawl ended Friday as GDX broke out . It was only a 3 day crawl at the 50sma. This leaves Plenty of time to move higher before a dcl comes due. This is THE FIRST Daily Cycle out of an ICL, the second should push it even higher. Let’s take a look…
THIS IS NOT AN EXACT PREDICTION, but it’s an idea of how this could easily play out with 15 or so trading days left. Please read the chart …
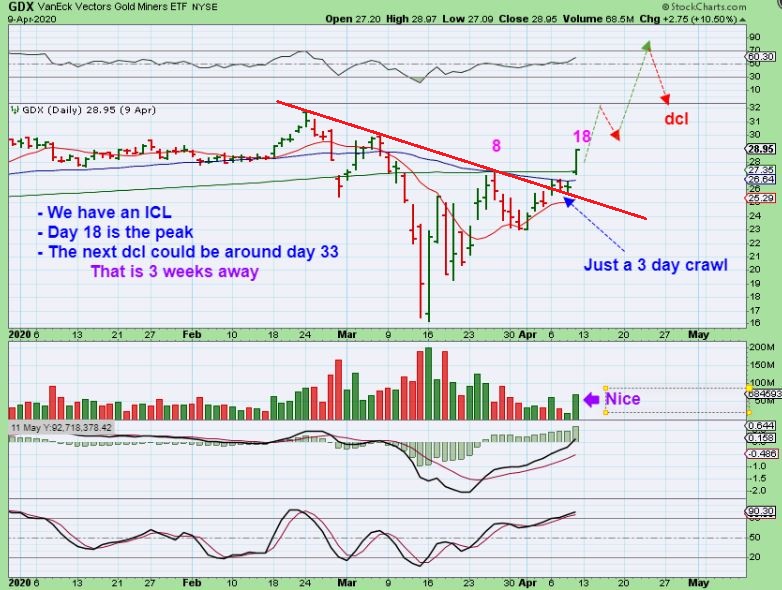
Friday saw the lagging Miners start to move higher too, and Monday will still have some other individual lagger Miners just ready to play catch up too. The down trend Line was broken recently, so the down trend is over for now. This was an easy ‘Buy with a stop’, adding to current positions. Those buying lower can now also raise stops, and it is an ‘Add to positions’ for them.
So this was just an example of the bigger picture weekend report. In the daily reports I’ve pointed out other Miners that looked ready to run, along with some OIL stocks and Tech stocks like AMD, TSEM, COUP, WORK, UBER, TWTR, etc . These are short term trade ideas as well as some buy & hold.
.
If you think that this kind of analysis, in addition to your own trading style, would be helpful, I think that now is the time to join us at Chartfreak. The Miners look especially attractive to me, though there will be pull backs along the way. I have been discussing this in the daily reports and the next buying opportunity is just around the corner. 🙂
For more information on signing up, you can click on the link below. Thanks for checking out Chartfreak!
.

